|
Introduction
|
The Ecological Niche Factor Analysis (ENFA) is the central
part of Biomapper. Its modules were conceived either to prepare ENFA input
data or to evaluate and transform its output data.
|
|
Habitat Suitability
(HS) maps are commonly built on presence/absence data, but the
latter are most generally unavailable or unreliable.
|
HS maps are basically computed by fitting some statistical
or numerical model on environmental data and species distribution data.
Classical methods (e.g. logistic regression, discriminant analysis,
GLM, etc.) need both species presence and absence data; presences attest
a good habitat and absences attest a bad habitat.
An “absence” (=lack of observation) may have three causes:
| 1° The species is present but was not detected |
FALSE ABSENCE |
| 2° The habitat is suitable, but the species is not yet/no more
present |
FALSE ABSENCE |
| 3° The habitat is actually not suitable |
TRUE ABSENCE |
|
|
Input data:
Ecogeographical variables (EGV)
and
Presence data
|
The ENFA needs to types of input data:
-
The EGV describe environmental, topographical and anthropic parameters
of the study area.
 |
 |
 |
| Rock frequency |
Elevation |
Distance to towns |
-
Only presence data are needed. This make the ENFA an analysis particularly
robust to the quality of data.
Presence data
|
|
Ecological Niche
Factor Analysis (ENFA): Marginality and Specialisation
|
The ENFA’s principle is to compare the distributions
of the EGV between the presence data set (species distribution) and the
whole area (global distribution).
Like the Principal Component Analysis, the ENFA summarises many
EGV into a few uncorrelated factors retaining most of the information.
Bur here, the factors have an ecological meaning.
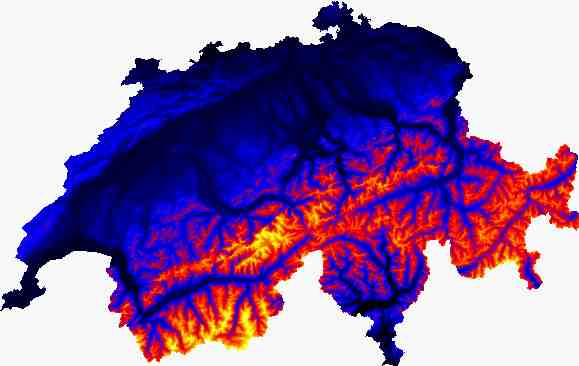
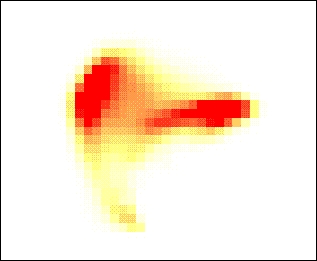
Marginality Factor
It is the direction on which the species niche differs at most from
the available conditions in the global area.
It is computed by drawing a straight line between the centroids
of the global- (yellow) and the species (blue) distribution.
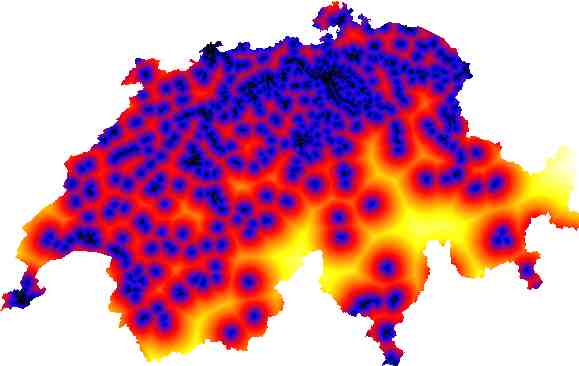
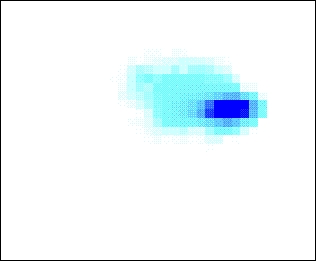
Specialisation Factors
Once the marginality has bee removed, a specialisation factor can
be extracted by computing the direction that maximises the ratio of the
variance of the global distribution (yellow) to that of the species distribution
(blue).
It is then removed and this procedure is repeated until all the
information has been explained. At the end, most of it is explained by
a few of the first factors and only those will then be used.
|
|
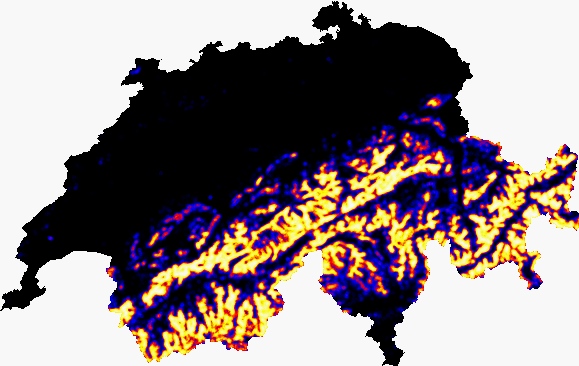
HS map computing
|
The species distribution on the factors allows to compute
a HS index for any set of EGV values and thus to draw the HS map.
 |
 |
| Global distribution along the marginality (horizontal
axis) and specialisation factor (vertical axis) |
Species distribution along the marginality (horizontal
axis) and specialisation factor (vertical axis) |
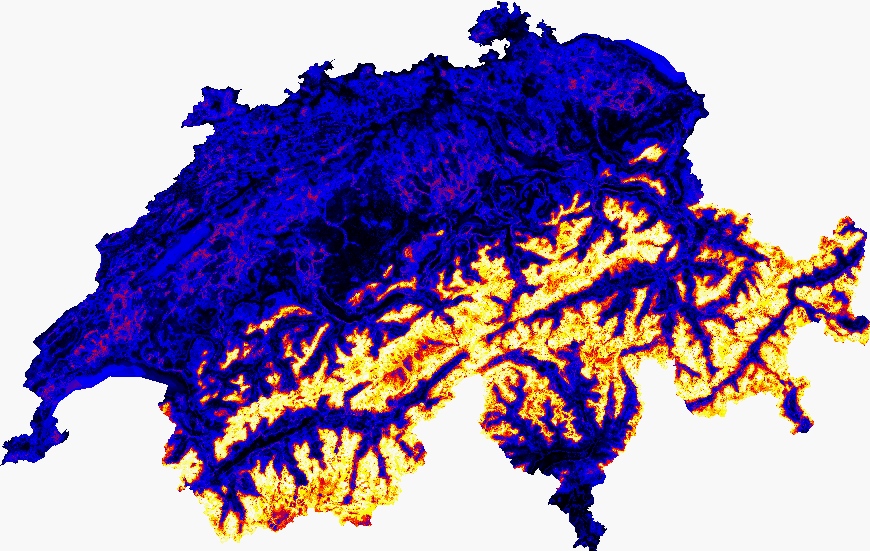
Habitat-Suitability map
|