Previous module |
Next module
Module #341, TG: 2.2, TC: 3, 154 probes, 154 Entrez genes, 4 conditions


HELP
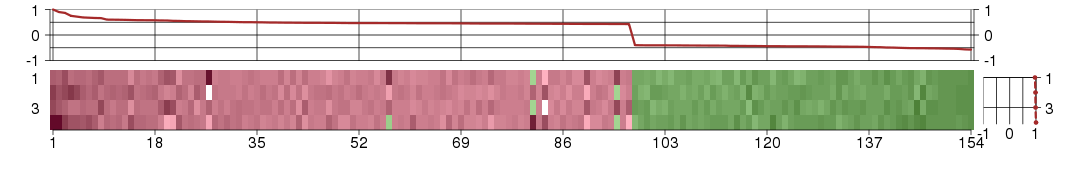
The image plot shows the color-coded level of gene expression, for the
genes and conditions in a given transcription module. The genes are on
the horizontal, the conditions on the vertical axis.
The genes are ordered according to their ISA gene scores, similarly
the conditions are ordered according to their condition scores. The
score of a gene means the «degree of inclusion» in
the module: a high score gene is essential in the module.
Condition scores can also be negative, that means that the genes of
the module are all down-regulated in the condition. Here the absolute
value of the score gives the «degree of inclusion».
The plots above and beside the expression matrix show the gene scores
and condition scores, respectively.
Note that the plot is interactive, you can see the name of the gene
and condition under the mouse cursor.
The expression matrix was normalized to have mean zero and standard
deviation one for every gene separately across all conditions
(i.e. not just for the conditions in the module).
— Click on the Help button again to close this help window.

Under-expression is coded with green,
over-expression with red color.
Help |
Hide |
Top
Help |
Show |
Top
The GO tree — Biological processes
HELP
This is one of three sections showing Gene Ontology enrichment of the
current module: in this case for biological processes.
The graph shows the hierarchy of the GO categories, their enrichment
for the current module is color coded, and the blue number beside the
category is the minus log ten p-value of the enrichment. (Calculated
using the standard hypergeometric test.) The color of the arrows code
«is a» (cyan) and «part of» relationships.
The tree was built the following way. First all GO terms with more
significant enrichment p-value than 0.05 were collected. Then all
paths from these terms to the root node of the GO tree were included
too. If a GO term is included more than once in the tree, then the
green numbers show 1) the id of the node, this makes it easier to find
other appereances of the term, and 2) the number of appearences.
Note that the same GO category might show up on the graph many
times. This is because the GO was «straightened» for this
graph, i.e. if there are more paths from a GO term to the root node of
the tree, all of them are included. The green numbers
Move the mouse cursor over the terms to get their definition. Clicking
on them takes you to the corresponding Gene Ontology web page.
If you cannot see a graph here at all, that means that there were no
significantly enriched GO categories, at the 0.05 level.
— Click on the Help button again to close this help window.
Help |
Hide |
Top
Help |
Show |
Top
The GO tree — Cellular Components
HELP
This is one of three sections showing Gene Ontology enrichment of the
current module: in this case for cellular components.
The graph shows the hierarchy of the GO categories, their enrichment
for the current module is color coded, and the blue number beside the
category is the minus log ten p-value of the enrichment. (Calculated
using the standard hypergeometric test.) The color of the arrows code
«is a» (cyan) and «part of» relationships.
The tree was built the following way. First all GO terms with more
significant enrichment p-value than 0.05 were collected. Then all
paths from these terms to the root node of the GO tree were included
too. If a GO term is included more than once in the tree, then the
green numbers show 1) the id of the node, this makes it easier to find
other appereances of the term, and 2) the number of appearences.
Note that the same GO category might show up on the graph many
times. This is because the GO was «straightened» for this
graph, i.e. if there are more paths from a GO term to the root node of
the tree, all of them are included. The green numbers
Move the mouse cursor over the terms to get their definition. Clicking
on them takes you to the corresponding Gene Ontology web page.
If you cannot see a graph here at all, that means that there were no
significantly enriched GO categories, at the 0.05 level.
— Click on the Help button again to close this help window.
Help |
Hide |
Top
Help |
Show |
Top
The GO tree — Molecular Function
HELP
This is one of three sections showing Gene Ontology enrichment of the
current module: in this case for molecular function.
The graph shows the hierarchy of the GO categories, their enrichment
for the current module is color coded, and the blue number beside the
category is the minus log ten p-value of the enrichment. (Calculated
using the standard hypergeometric test.) The color of the arrows code
«is a» (cyan) and «part of» relationships.
The tree was built the following way. First all GO terms with more
significant enrichment p-value than 0.05 were collected. Then all
paths from these terms to the root node of the GO tree were included
too. If a GO term is included more than once in the tree, then the
green numbers show 1) the id of the node, this makes it easier to find
other appereances of the term, and 2) the number of appearences.
Note that the same GO category might show up on the graph many
times. This is because the GO was «straightened» for this
graph, i.e. if there are more paths from a GO term to the root node of
the tree, all of them are included. The green numbers
Move the mouse cursor over the terms to get their definition. Clicking
on them takes you to the corresponding Gene Ontology web page.
If you cannot see a graph here at all, that means that there were no
significantly enriched GO categories, at the 0.05 level.
— Click on the Help button again to close this help window.
Help |
Hide |
Top
Help |
Show |
Top
GO BP test for over-representation
HELP
List of all enriched GO categories (biological processes), at the 0.05
p-value level.
The columns:
- ExpCount is the expected count of genes in the
module annotated with the given GO term, just by chance.
- Count
is the number of genes in the module annotated with the given GO
term.
- Size is the total number of genes (in our universe)
annotated with the GO term.
Clicking on Count shows the genes that drive the
enrichment. You can also click on the individual numbers in
the Count column, to show the driving genes for that individual
GO category.
Clicking on the GO identifiers takes you to the Gene Ontology web
pages.
— Click on the Help button again to close this help window.
| Id | Pvalue | ExpCount | Count | Size | Term |
| GO:0006397 | 3.867e-02 | 2.521 | 9
AQR, CDC40, CDK11A, CDK11B, CPSF4, HNRNPR, PRPF6, RNMT, THOC7 | 96 | mRNA processing |
Help |
Hide |
Top
Help |
Show |
Top
GO CC test for over-representation
HELP
List of all enriched GO categories (cellular components), at the 0.05
p-value level.
The columns:
- ExpCount is the expected count of genes in the
module annotated with the given GO term, just by chance.
- Count
is the number of genes in the module annotated with the given GO
term.
- Size is the total number of genes (in our universe)
annotated with the GO term.
Clicking on Count shows the genes that drive the
enrichment. You can also click on the individual numbers in
the Count column, to show the driving genes for that individual
GO category.
Clicking on the GO identifiers takes you to the Gene Ontology web
pages.
— Click on the Help button again to close this help window.
Help |
Hide |
Top
Help |
Show |
Top
GO MF test for over-representation
HELP
List of all enriched GO categories (molecular function), at the 0.05
p-value level.
The columns:
- ExpCount is the expected count of genes in the
module annotated with the given GO term, just by chance.
- Count
is the number of genes in the module annotated with the given GO
term.
- Size is the total number of genes (in our universe)
annotated with the GO term.
Clicking on Count shows the genes that drive the
enrichment. You can also click on the individual numbers in
the Count column, to show the driving genes for that individual
GO category.
Clicking on the GO identifiers takes you to the Gene Ontology web
pages.
— Click on the Help button again to close this help window.
Help |
Hide |
Top
Help |
Show |
Top
KEGG Pathway test for over-representation
HELP
List of all enriched KEGG pathways, at the 0.05
p-value level.
The columns:
- ExpCount is the expected count of genes in the
module annotated with the given KEGG pathway, just by chance.
- Count
is the number of genes in the module annotated with the given KEGG
pathway.
- Size is the total number of genes (in our universe)
annotated with the KEGG pathway.
Clicking on Count shows the genes that drive the
enrichment. You can also click on the individual numbers in
the Count column, to show the driving genes for that individual
KEGG pathway.
Clicking on the KEGG identifiers takes you to the KEGG web site.
— Click on the Help button again to close this help window.
Help |
Hide |
Top
Help |
Show |
Top
miRNA test for over-representation
HELP
List of all enriched miRNA families, at the 0.05
p-value level.
The columns:
- ExpCount is the expected count of genes in the
module regulated by the given miRNA family, just by chance.
- Count
is the number of genes in the module regulated by the given miRNA
family.
- Size is the total number of genes (in our universe)
regulated with the given miRNA family.
Clicking on Count shows the genes that drive the
enrichment. You can also click on the individual numbers in
the Count column, to show the driving genes for that individual
miRNA family.
The miRNA regulation data was taken from the TargetScan database.
(Only the conserved sites were used for the current analysis.)
Clicking on the miRNA names takes you to the TargetScan web site.
— Click on the Help button again to close this help window.
Help |
Hide |
Top
Help |
Show |
Top
Chromosome test for over-representation
HELP
List of all enriched Chromosomes, at the 0.05
p-value level.
The columns:
- ExpCount is the expected number of genes in the
module on the given chromosome, just by chance.
- Count
is the number of genes in the module on the given chromosome.
- Size is the total number of genes (in our universe)
on the given chromosome.
Clicking on Count shows the genes that drive the
enrichment. You can also click on the individual numbers in
the Count column, to show the driving genes for that individual
chromosome.
— Click on the Help button again to close this help window.
HELP
A list of all genes in the current module, in alphabetical order. The
size of the text corresponds to the gene scores.
Text color indicates correlation and anti-correlation: genes of the
same color are correlated, both move up or down in the module samples
(listed below). Genes of different color are anti-correlated, they
have opposite behavior in the module samples.
Note, that text color of the individual genes should be interpreted
together with the coloring of the samples below. For
red samples,
red genes have a higher expression
(compared to the average gene expression level),
green genes have a lower
expression.
Green samples have opposite
behavior, in these red genes have a
lower expression, green genes
have a higher expression.
Note that some gene symbols may show up more than once, if many
probes match the same Entrez gene.
Genes with no Entrez mapping are given separately, with their
Affymetrics probe ID.
— Click on the Help button again to close this help window.
Entrez genes
AANATaralkylamine N-acetyltransferase (ENSG00000129673), score: 0.68
AASDHPPTaminoadipate-semialdehyde dehydrogenase-phosphopantetheinyl transferase (ENSG00000149313), score: 0.44
AMMECR1LAMME chromosomal region gene 1-like (ENSG00000144233), score: -0.5
AMZ1archaelysin family metallopeptidase 1 (ENSG00000174945), score: 0.44
ANKRD40ankyrin repeat domain 40 (ENSG00000154945), score: -0.45
AP4E1adaptor-related protein complex 4, epsilon 1 subunit (ENSG00000081014), score: 0.47
AQRaquarius homolog (mouse) (ENSG00000021776), score: 0.43
ARIH2ariadne homolog 2 (Drosophila) (ENSG00000177479), score: -0.46
ARR3arrestin 3, retinal (X-arrestin) (ENSG00000120500), score: 0.43
ATXN7ataxin 7 (ENSG00000163635), score: -0.44
AVPR1Barginine vasopressin receptor 1B (ENSG00000198049), score: 1
AZI15-azacytidine induced 1 (ENSG00000141577), score: -0.44
BCDIN3DBCDIN3 domain containing (ENSG00000186666), score: -0.4
BMP3bone morphogenetic protein 3 (ENSG00000152785), score: 0.54
C12orf29chromosome 12 open reading frame 29 (ENSG00000133641), score: 0.47
C14orf102chromosome 14 open reading frame 102 (ENSG00000119720), score: -0.51
C14orf37chromosome 14 open reading frame 37 (ENSG00000139971), score: 0.5
C17orf68chromosome 17 open reading frame 68 (ENSG00000178971), score: -0.45
C1orf107chromosome 1 open reading frame 107 (ENSG00000117597), score: 0.46
C1orf25chromosome 1 open reading frame 25 (ENSG00000121486), score: 0.6
C20orf4chromosome 20 open reading frame 4 (ENSG00000131043), score: 0.48
C6orf106chromosome 6 open reading frame 106 (ENSG00000196821), score: -0.42
C6orf62chromosome 6 open reading frame 62 (ENSG00000112308), score: 0.58
C8orf40chromosome 8 open reading frame 40 (ENSG00000176209), score: -0.46
CCDC109Acoiled-coil domain containing 109A (ENSG00000156026), score: 0.48
CCDC127coiled-coil domain containing 127 (ENSG00000164366), score: -0.41
CCDC93coiled-coil domain containing 93 (ENSG00000125633), score: 0.46
CDC40cell division cycle 40 homolog (S. cerevisiae) (ENSG00000168438), score: 0.46
CDK15cyclin-dependent kinase 15 (ENSG00000138395), score: 0.43
CDKN2AIPCDKN2A interacting protein (ENSG00000168564), score: -0.52
CHAC2ChaC, cation transport regulator homolog 2 (E. coli) (ENSG00000143942), score: 0.46
CHRNB4cholinergic receptor, nicotinic, beta 4 (ENSG00000117971), score: 0.57
CLCN3chloride channel 3 (ENSG00000109572), score: 0.52
CNTN5contactin 5 (ENSG00000149972), score: 0.72
COL25A1collagen, type XXV, alpha 1 (ENSG00000188517), score: 0.47
COMMD2COMM domain containing 2 (ENSG00000114744), score: 0.44
COPAcoatomer protein complex, subunit alpha (ENSG00000122218), score: -0.57
CPLX4complexin 4 (ENSG00000166569), score: 0.75
CPSF4cleavage and polyadenylation specific factor 4, 30kDa (ENSG00000160917), score: -0.41
CRISPLD1cysteine-rich secretory protein LCCL domain containing 1 (ENSG00000121005), score: 0.45
CRKv-crk sarcoma virus CT10 oncogene homolog (avian) (ENSG00000167193), score: -0.44
CTHRC1collagen triple helix repeat containing 1 (ENSG00000164932), score: 0.47
CTNND1catenin (cadherin-associated protein), delta 1 (ENSG00000198561), score: -0.43
CUL4Acullin 4A (ENSG00000139842), score: -0.41
DCNdecorin (ENSG00000011465), score: -0.41
DCTN4dynactin 4 (p62) (ENSG00000132912), score: 0.6
DFFADNA fragmentation factor, 45kDa, alpha polypeptide (ENSG00000160049), score: 0.49
DIS3LDIS3 mitotic control homolog (S. cerevisiae)-like (ENSG00000166938), score: -0.41
DKK2dickkopf homolog 2 (Xenopus laevis) (ENSG00000155011), score: 0.48
DSCC1defective in sister chromatid cohesion 1 homolog (S. cerevisiae) (ENSG00000136982), score: 0.48
E2F4E2F transcription factor 4, p107/p130-binding (ENSG00000205250), score: -0.41
ENPP7ectonucleotide pyrophosphatase/phosphodiesterase 7 (ENSG00000182156), score: 0.58
EPHA5EPH receptor A5 (ENSG00000145242), score: 0.46
EPS15epidermal growth factor receptor pathway substrate 15 (ENSG00000085832), score: 0.45
ESR2estrogen receptor 2 (ER beta) (ENSG00000140009), score: 0.43
EXTL2exostoses (multiple)-like 2 (ENSG00000162694), score: 0.58
FADDFas (TNFRSF6)-associated via death domain (ENSG00000168040), score: -0.42
FAM164Afamily with sequence similarity 164, member A (ENSG00000104427), score: 0.52
FAM185Afamily with sequence similarity 185, member A (ENSG00000222011), score: -0.44
FARP2FERM, RhoGEF and pleckstrin domain protein 2 (ENSG00000006607), score: -0.43
FBXO9F-box protein 9 (ENSG00000112146), score: 0.46
FGF10fibroblast growth factor 10 (ENSG00000070193), score: 0.45
FLNBfilamin B, beta (ENSG00000136068), score: -0.52
FUT11fucosyltransferase 11 (alpha (1,3) fucosyltransferase) (ENSG00000196968), score: -0.41
GABRA2gamma-aminobutyric acid (GABA) A receptor, alpha 2 (ENSG00000151834), score: 0.47
GOLGA1golgin A1 (ENSG00000136935), score: -0.42
GPR149G protein-coupled receptor 149 (ENSG00000174948), score: 0.56
GRB10growth factor receptor-bound protein 10 (ENSG00000106070), score: -0.52
GUCY2Cguanylate cyclase 2C (heat stable enterotoxin receptor) (ENSG00000070019), score: 0.59
HECW2HECT, C2 and WW domain containing E3 ubiquitin protein ligase 2 (ENSG00000138411), score: 0.45
HELQhelicase, POLQ-like (ENSG00000163312), score: 0.43
HERPUD1homocysteine-inducible, endoplasmic reticulum stress-inducible, ubiquitin-like domain member 1 (ENSG00000051108), score: -0.41
HHLA1HERV-H LTR-associating 1 (ENSG00000132297), score: 0.87
HNRNPRheterogeneous nuclear ribonucleoprotein R (ENSG00000125944), score: 0.43
HRH4histamine receptor H4 (ENSG00000134489), score: 0.5
IBSPintegrin-binding sialoprotein (ENSG00000029559), score: 0.53
IL12RB2interleukin 12 receptor, beta 2 (ENSG00000081985), score: 0.57
IL1RAPL1interleukin 1 receptor accessory protein-like 1 (ENSG00000169306), score: 0.48
IL1RAPL2interleukin 1 receptor accessory protein-like 2 (ENSG00000189108), score: 0.44
IMPAD1inositol monophosphatase domain containing 1 (ENSG00000104331), score: 0.47
ITFG1integrin alpha FG-GAP repeat containing 1 (ENSG00000129636), score: 0.49
KBTBD3kelch repeat and BTB (POZ) domain containing 3 (ENSG00000182359), score: 0.52
LGI2leucine-rich repeat LGI family, member 2 (ENSG00000153012), score: 0.45
LOC100133692similar to cell division cycle 2-like 1 (PITSLRE proteins) (ENSG00000008128), score: -0.44
LOC100134291similar to mitogen-activated protein kinase phosphatase x (ENSG00000112679), score: -0.4
LOC100291726similar to family with sequence similarity 70, member A (ENSG00000125355), score: 0.47
LOC100293905similar to gastrin-releasing peptide receptor (ENSG00000126010), score: 0.66
LRRC26leucine rich repeat containing 26 (ENSG00000184709), score: 0.69
MAK16MAK16 homolog (S. cerevisiae) (ENSG00000198042), score: 0.44
MAN1A2mannosidase, alpha, class 1A, member 2 (ENSG00000198162), score: 0.44
MLXIPMLX interacting protein (ENSG00000175727), score: -0.52
MRPL12mitochondrial ribosomal protein L12 (ENSG00000183093), score: -0.49
MYO19myosin XIX (ENSG00000141140), score: -0.45
N6AMT2N-6 adenine-specific DNA methyltransferase 2 (putative) (ENSG00000150456), score: 0.46
NECAP2NECAP endocytosis associated 2 (ENSG00000157191), score: -0.43
NFKB1nuclear factor of kappa light polypeptide gene enhancer in B-cells 1 (ENSG00000109320), score: -0.48
NGBneuroglobin (ENSG00000165553), score: 0.45
NPATnuclear protein, ataxia-telangiectasia locus (ENSG00000149308), score: 0.45
NPRL2nitrogen permease regulator-like 2 (S. cerevisiae) (ENSG00000114388), score: -0.43
NT5DC25'-nucleotidase domain containing 2 (ENSG00000168268), score: -0.46
OFCC1orofacial cleft 1 candidate 1 (ENSG00000181355), score: 0.44
PANX1pannexin 1 (ENSG00000110218), score: 0.45
PCGF3polycomb group ring finger 3 (ENSG00000185619), score: -0.45
PCGF5polycomb group ring finger 5 (ENSG00000180628), score: -0.49
PDRG1p53 and DNA-damage regulated 1 (ENSG00000088356), score: 0.51
PIGXphosphatidylinositol glycan anchor biosynthesis, class X (ENSG00000163964), score: 0.46
PIK3CDphosphoinositide-3-kinase, catalytic, delta polypeptide (ENSG00000171608), score: 0.47
POLGpolymerase (DNA directed), gamma (ENSG00000140521), score: -0.46
POLR3Fpolymerase (RNA) III (DNA directed) polypeptide F, 39 kDa (ENSG00000132664), score: 0.5
PRPF6PRP6 pre-mRNA processing factor 6 homolog (S. cerevisiae) (ENSG00000101161), score: -0.41
PRPH2peripherin 2 (retinal degeneration, slow) (ENSG00000112619), score: 0.58
PTP4A2protein tyrosine phosphatase type IVA, member 2 (ENSG00000184007), score: -0.43
PTPRAprotein tyrosine phosphatase, receptor type, A (ENSG00000132670), score: 0.54
PUS1pseudouridylate synthase 1 (ENSG00000177192), score: -0.41
RAB11ARAB11A, member RAS oncogene family (ENSG00000103769), score: 0.51
RAB3GAP2RAB3 GTPase activating protein subunit 2 (non-catalytic) (ENSG00000118873), score: 0.44
RFC3replication factor C (activator 1) 3, 38kDa (ENSG00000133119), score: 0.47
RGS8regulator of G-protein signaling 8 (ENSG00000135824), score: 0.44
RNF114ring finger protein 114 (ENSG00000124226), score: -0.45
RNMTRNA (guanine-7-) methyltransferase (ENSG00000101654), score: 0.54
RNPEParginyl aminopeptidase (aminopeptidase B) (ENSG00000176393), score: -0.56
RPS6KC1ribosomal protein S6 kinase, 52kDa, polypeptide 1 (ENSG00000136643), score: 0.6
RRP9ribosomal RNA processing 9, small subunit (SSU) processome component, homolog (yeast) (ENSG00000114767), score: -0.41
RXRAretinoid X receptor, alpha (ENSG00000186350), score: -0.44
SERPINB2serpin peptidase inhibitor, clade B (ovalbumin), member 2 (ENSG00000197632), score: 0.47
SH2B3SH2B adaptor protein 3 (ENSG00000111252), score: -0.44
SLC35A5solute carrier family 35, member A5 (ENSG00000138459), score: -0.55
SLC35F4solute carrier family 35, member F4 (ENSG00000151812), score: 0.48
SPASTspastin (ENSG00000021574), score: 0.47
SRIsorcin (ENSG00000075142), score: 0.48
STAU1staufen, RNA binding protein, homolog 1 (Drosophila) (ENSG00000124214), score: 0.46
STOML2stomatin (EPB72)-like 2 (ENSG00000165283), score: -0.54
STX12syntaxin 12 (ENSG00000117758), score: 0.46
TBC1D19TBC1 domain family, member 19 (ENSG00000109680), score: 0.43
TDRD7tudor domain containing 7 (ENSG00000196116), score: -0.47
THOC7THO complex 7 homolog (Drosophila) (ENSG00000163634), score: -0.52
TMEM117transmembrane protein 117 (ENSG00000139173), score: 0.59
TMEM128transmembrane protein 128 (ENSG00000132406), score: 0.44
TMEM50Atransmembrane protein 50A (ENSG00000183726), score: 0.48
TOPORStopoisomerase I binding, arginine/serine-rich (ENSG00000197579), score: -0.48
TPBGtrophoblast glycoprotein (ENSG00000146242), score: 0.48
TRPA1transient receptor potential cation channel, subfamily A, member 1 (ENSG00000104321), score: 0.55
TRPC5transient receptor potential cation channel, subfamily C, member 5 (ENSG00000072315), score: 0.46
TSTD2thiosulfate sulfurtransferase (rhodanese)-like domain containing 2 (ENSG00000136925), score: -0.43
TUBGCP2tubulin, gamma complex associated protein 2 (ENSG00000130640), score: -0.53
UBL3ubiquitin-like 3 (ENSG00000122042), score: 0.45
VGLL1vestigial like 1 (Drosophila) (ENSG00000102243), score: 0.67
WDR26WD repeat domain 26 (ENSG00000162923), score: -0.46
WDR3WD repeat domain 3 (ENSG00000065183), score: 0.49
WDR44WD repeat domain 44 (ENSG00000131725), score: 0.5
WNT3Awingless-type MMTV integration site family, member 3A (ENSG00000154342), score: 0.9
YTHDC2YTH domain containing 2 (ENSG00000047188), score: -0.53
ZHX1zinc fingers and homeoboxes 1 (ENSG00000165156), score: 0.43
ZNF326zinc finger protein 326 (ENSG00000162664), score: 0.53
Non-Entrez genes
Unknown, score:
HELP
Conditions in the module, given in the same order as on the expression
plot above. Red color means over-expression, green under-expression in
the given condition.
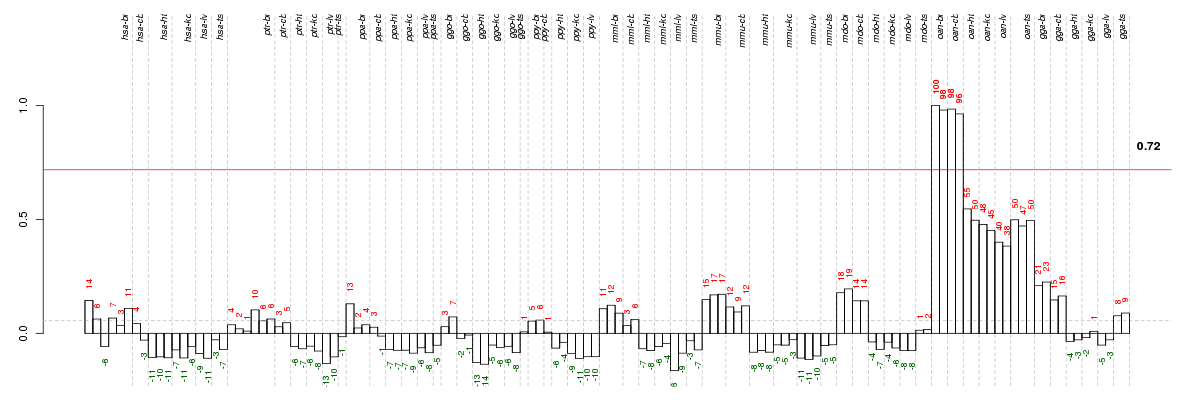
The barplot below shows the condition (sample) scores. A separate bar
is shown for each sample, its height is the corresponding score of the
sample in the module. The red and green numbers on the bars are the
sample scores expressed in percents, i.e. 100% is 1.0.
The height of each bar corresponds to the weighted
mean expression of the module genes. The weights are the gene scores
of the module and they are positive for the genes listed in
red above and they are negative for
the genes that are listed in
green.
Bars going up correspond to samples listed in
red (the ones that are different
enough to included in the module). In these samples
the red module genes are highly
expressed, and the green
module genes are lowly expressed. The behavior of the genes is the
opposite for bars going down.
The red and green lines show the module thresholds, samples above
the red line and below the green line are included in the module.
The different species and tissues that were part of the study, are separated
by dashed vertical lines.
— Click on the Help button again to close this help window.
| Id | species | tissue | sex | individual |
| oan_cb_f_ca1 | oan | cb | f | _ |
| oan_br_f_ca1 | oan | br | f | _ |
| oan_cb_m_ca1 | oan | cb | m | _ |
| oan_br_m_ca1 | oan | br | m | _ |


© 2008-2010 Computational Biology Group, Department of Medical Genetics,
University of Lausanne, Switzerland