File:Image5.png

Size of this preview: 800 × 516 pixels. Other resolutions: 320 × 207 pixels | 953 × 615 pixels.
Original file (953 × 615 pixels, file size: 97 KB, MIME type: image/png)
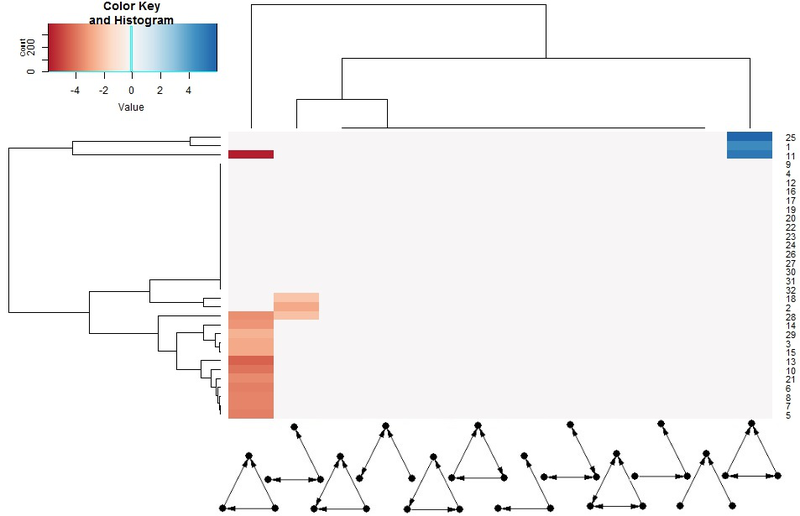
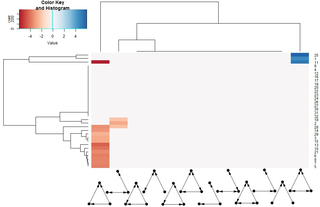
Figure 5: On x axis are all 12 three knots’ motifs and in y axis are all 32 true networks. This heatmap shows the z-score of each motifs for each cluster that had a significant p-value after a benjamini hochberg correction for multiple testing.
File history
Click on a date/time to view the file as it appeared at that time.
| Date/Time | Thumbnail | Dimensions | User | Comment | |
|---|---|---|---|---|---|
| current | 10:15, 29 May 2015 | | 953 × 615 (97 KB) | Sbprm2015 3 (talk | contribs) |
- You cannot overwrite this file.
File usage
The following page links to this file: