Previous module |
Next module
Module #647, TG: 2.8, TC: 2, 82 probes, 82 Entrez genes, 4 conditions


HELP
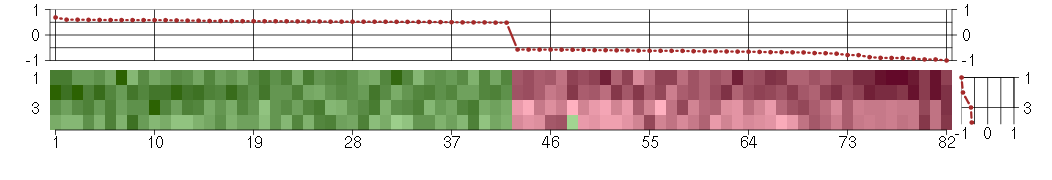
The image plot shows the color-coded level of gene expression, for the
genes and conditions in a given transcription module. The genes are on
the horizontal, the conditions on the vertical axis.
The genes are ordered according to their ISA gene scores, similarly
the conditions are ordered according to their condition scores. The
score of a gene means the «degree of inclusion» in
the module: a high score gene is essential in the module.
Condition scores can also be negative, that means that the genes of
the module are all down-regulated in the condition. Here the absolute
value of the score gives the «degree of inclusion».
The plots above and beside the expression matrix show the gene scores
and condition scores, respectively.
Note that the plot is interactive, you can see the name of the gene
and condition under the mouse cursor.
The expression matrix was normalized to have mean zero and standard
deviation one for every gene separately across all conditions
(i.e. not just for the conditions in the module).
— Click on the Help button again to close this help window.

Under-expression is coded with green,
over-expression with red color.
Help |
Hide |
Top
Help |
Show |
Top
The GO tree — Biological processes
HELP
This is one of three sections showing Gene Ontology enrichment of the
current module: in this case for biological processes.
The graph shows the hierarchy of the GO categories, their enrichment
for the current module is color coded, and the blue number beside the
category is the minus log ten p-value of the enrichment. (Calculated
using the standard hypergeometric test.) The color of the arrows code
«is a» (cyan) and «part of» relationships.
The tree was built the following way. First all GO terms with more
significant enrichment p-value than 0.05 were collected. Then all
paths from these terms to the root node of the GO tree were included
too. If a GO term is included more than once in the tree, then the
green numbers show 1) the id of the node, this makes it easier to find
other appereances of the term, and 2) the number of appearences.
Note that the same GO category might show up on the graph many
times. This is because the GO was «straightened» for this
graph, i.e. if there are more paths from a GO term to the root node of
the tree, all of them are included. The green numbers
Move the mouse cursor over the terms to get their definition. Clicking
on them takes you to the corresponding Gene Ontology web page.
If you cannot see a graph here at all, that means that there were no
significantly enriched GO categories, at the 0.05 level.
— Click on the Help button again to close this help window.
Help |
Hide |
Top
Help |
Show |
Top
The GO tree — Cellular Components
HELP
This is one of three sections showing Gene Ontology enrichment of the
current module: in this case for cellular components.
The graph shows the hierarchy of the GO categories, their enrichment
for the current module is color coded, and the blue number beside the
category is the minus log ten p-value of the enrichment. (Calculated
using the standard hypergeometric test.) The color of the arrows code
«is a» (cyan) and «part of» relationships.
The tree was built the following way. First all GO terms with more
significant enrichment p-value than 0.05 were collected. Then all
paths from these terms to the root node of the GO tree were included
too. If a GO term is included more than once in the tree, then the
green numbers show 1) the id of the node, this makes it easier to find
other appereances of the term, and 2) the number of appearences.
Note that the same GO category might show up on the graph many
times. This is because the GO was «straightened» for this
graph, i.e. if there are more paths from a GO term to the root node of
the tree, all of them are included. The green numbers
Move the mouse cursor over the terms to get their definition. Clicking
on them takes you to the corresponding Gene Ontology web page.
If you cannot see a graph here at all, that means that there were no
significantly enriched GO categories, at the 0.05 level.
— Click on the Help button again to close this help window.
extracellular region
The space external to the outermost structure of a cell. For cells without external protective or external encapsulating structures this refers to space outside of the plasma membrane. This term covers the host cell environment outside an intracellular parasite.
cellular_component
The part of a cell or its extracellular environment in which a gene product is located. A gene product may be located in one or more parts of a cell and its location may be as specific as a particular macromolecular complex, that is, a stable, persistent association of macromolecules that function together.
extracellular matrix
A structure lying external to one or more cells, which provides structural support for cells or tissues; may be completely external to the cell (as in animals) or be part of the cell (as in plants).
extracellular matrix part
Any constituent part of the extracellular matrix, the structure lying external to one or more cells, which provides structural support for cells or tissues; may be completely external to the cell (as in animals) or be part of the cell (as often seen in plants).
extracellular region part
Any constituent part of the extracellular region, the space external to the outermost structure of a cell. For cells without external protective or external encapsulating structures this refers to space outside of the plasma membrane. This term covers constituent parts of the host cell environment outside an intracellular parasite.
all
This term is the most general term possible
extracellular region part
Any constituent part of the extracellular region, the space external to the outermost structure of a cell. For cells without external protective or external encapsulating structures this refers to space outside of the plasma membrane. This term covers constituent parts of the host cell environment outside an intracellular parasite.
extracellular matrix part
Any constituent part of the extracellular matrix, the structure lying external to one or more cells, which provides structural support for cells or tissues; may be completely external to the cell (as in animals) or be part of the cell (as often seen in plants).
Help |
Hide |
Top
Help |
Show |
Top
The GO tree — Molecular Function
HELP
This is one of three sections showing Gene Ontology enrichment of the
current module: in this case for molecular function.
The graph shows the hierarchy of the GO categories, their enrichment
for the current module is color coded, and the blue number beside the
category is the minus log ten p-value of the enrichment. (Calculated
using the standard hypergeometric test.) The color of the arrows code
«is a» (cyan) and «part of» relationships.
The tree was built the following way. First all GO terms with more
significant enrichment p-value than 0.05 were collected. Then all
paths from these terms to the root node of the GO tree were included
too. If a GO term is included more than once in the tree, then the
green numbers show 1) the id of the node, this makes it easier to find
other appereances of the term, and 2) the number of appearences.
Note that the same GO category might show up on the graph many
times. This is because the GO was «straightened» for this
graph, i.e. if there are more paths from a GO term to the root node of
the tree, all of them are included. The green numbers
Move the mouse cursor over the terms to get their definition. Clicking
on them takes you to the corresponding Gene Ontology web page.
If you cannot see a graph here at all, that means that there were no
significantly enriched GO categories, at the 0.05 level.
— Click on the Help button again to close this help window.
Help |
Hide |
Top
Help |
Show |
Top
GO BP test for over-representation
HELP
List of all enriched GO categories (biological processes), at the 0.05
p-value level.
The columns:
- ExpCount is the expected count of genes in the
module annotated with the given GO term, just by chance.
- Count
is the number of genes in the module annotated with the given GO
term.
- Size is the total number of genes (in our universe)
annotated with the GO term.
Clicking on Count shows the genes that drive the
enrichment. You can also click on the individual numbers in
the Count column, to show the driving genes for that individual
GO category.
Clicking on the GO identifiers takes you to the Gene Ontology web
pages.
— Click on the Help button again to close this help window.
| Id | Pvalue | ExpCount | Count | Size | Term |
| GO:0006805 | 1.526e-02 | 0.1156 | 3
UGT1A1, UGT1A6, UGT1A9 | 13 | xenobiotic metabolic process |
| GO:0048545 | 2.234e-02 | 0.3291 | 4
CD24, FAS, GATA3, UGT1A1 | 37 | response to steroid hormone stimulus |
| GO:0009410 | 2.464e-02 | 0.1423 | 3
UGT1A1, UGT1A6, UGT1A9 | 16 | response to xenobiotic stimulus |
| GO:0009725 | 3.960e-02 | 0.7115 | 5
CD24, FAS, GATA3, IRS2, UGT1A1 | 80 | response to hormone stimulus |
Help |
Hide |
Top
Help |
Show |
Top
GO CC test for over-representation
HELP
List of all enriched GO categories (cellular components), at the 0.05
p-value level.
The columns:
- ExpCount is the expected count of genes in the
module annotated with the given GO term, just by chance.
- Count
is the number of genes in the module annotated with the given GO
term.
- Size is the total number of genes (in our universe)
annotated with the GO term.
Clicking on Count shows the genes that drive the
enrichment. You can also click on the individual numbers in
the Count column, to show the driving genes for that individual
GO category.
Clicking on the GO identifiers takes you to the Gene Ontology web
pages.
— Click on the Help button again to close this help window.
| Id | Pvalue | ExpCount | Count | Size | Term |
| GO:0044420 | 7.480e-03 | 0.5563 | 5
COL11A1, MFAP5, SNCA, SPARC, TIMP2 | 63 | extracellular matrix part |
| GO:0005578 | 1.176e-02 | 1.351 | 7
COL11A1, CRTAP, LTBP2, MFAP5, SNCA, SPARC, TIMP2 | 153 | proteinaceous extracellular matrix |
| GO:0031012 | 1.630e-02 | 1.439 | 7
COL11A1, CRTAP, LTBP2, MFAP5, SNCA, SPARC, TIMP2 | 163 | extracellular matrix |
| GO:0043205 | 3.815e-02 | 0.06181 | 2
MFAP5, SNCA | 7 | fibril |
Help |
Hide |
Top
Help |
Show |
Top
GO MF test for over-representation
HELP
List of all enriched GO categories (molecular function), at the 0.05
p-value level.
The columns:
- ExpCount is the expected count of genes in the
module annotated with the given GO term, just by chance.
- Count
is the number of genes in the module annotated with the given GO
term.
- Size is the total number of genes (in our universe)
annotated with the GO term.
Clicking on Count shows the genes that drive the
enrichment. You can also click on the individual numbers in
the Count column, to show the driving genes for that individual
GO category.
Clicking on the GO identifiers takes you to the Gene Ontology web
pages.
— Click on the Help button again to close this help window.
| Id | Pvalue | ExpCount | Count | Size | Term |
| GO:0015020 | 1.606e-02 | 0.1054 | 3
UGT1A1, UGT1A6, UGT1A9 | 12 | glucuronosyltransferase activity |
Help |
Hide |
Top
Help |
Show |
Top
KEGG Pathway test for over-representation
HELP
List of all enriched KEGG pathways, at the 0.05
p-value level.
The columns:
- ExpCount is the expected count of genes in the
module annotated with the given KEGG pathway, just by chance.
- Count
is the number of genes in the module annotated with the given KEGG
pathway.
- Size is the total number of genes (in our universe)
annotated with the KEGG pathway.
Clicking on Count shows the genes that drive the
enrichment. You can also click on the individual numbers in
the Count column, to show the driving genes for that individual
KEGG pathway.
Clicking on the KEGG identifiers takes you to the KEGG web site.
— Click on the Help button again to close this help window.
| Id | Pvalue | ExpCount | Count | Size | Term |
| 00040 | 1.395e-02 | 0.1161 | 3
UGT1A1, UGT1A6, UGT1A9 | 13 | Pentose and glucuronate interconversions |
| 00150 | 4.165e-02 | 0.1875 | 3
UGT1A1, UGT1A6, UGT1A9 | 21 | Androgen and estrogen metabolism |
| 00830 | 4.165e-02 | 0.1875 | 3
UGT1A1, UGT1A6, UGT1A9 | 21 | Retinol metabolism |
Help |
Hide |
Top
Help |
Show |
Top
miRNA test for over-representation
HELP
List of all enriched miRNA families, at the 0.05
p-value level.
The columns:
- ExpCount is the expected count of genes in the
module regulated by the given miRNA family, just by chance.
- Count
is the number of genes in the module regulated by the given miRNA
family.
- Size is the total number of genes (in our universe)
regulated with the given miRNA family.
Clicking on Count shows the genes that drive the
enrichment. You can also click on the individual numbers in
the Count column, to show the driving genes for that individual
miRNA family.
The miRNA regulation data was taken from the TargetScan database.
(Only the conserved sites were used for the current analysis.)
Clicking on the miRNA names takes you to the TargetScan web site.
— Click on the Help button again to close this help window.
Help |
Hide |
Top
Help |
Show |
Top
Chromosome test for over-representation
HELP
List of all enriched Chromosomes, at the 0.05
p-value level.
The columns:
- ExpCount is the expected number of genes in the
module on the given chromosome, just by chance.
- Count
is the number of genes in the module on the given chromosome.
- Size is the total number of genes (in our universe)
on the given chromosome.
Clicking on Count shows the genes that drive the
enrichment. You can also click on the individual numbers in
the Count column, to show the driving genes for that individual
chromosome.
— Click on the Help button again to close this help window.
HELP
A list of all genes in the current module, in alphabetical order. The
size of the text corresponds to the gene scores.
Note that some gene symbols may show up more than once, if many
probes match the same Entrez gene.
Genes with no Entrez mapping are given separately, with their
Affymetrics probe ID.
— Click on the Help button again to close this help window.
Entrez genes
A2Malpha-2-macroglobulin (217757_at), score: -0.65
ABCB1ATP-binding cassette, sub-family B (MDR/TAP), member 1 (209993_at), score: -1
ABHD14Aabhydrolase domain containing 14A (210006_at), score: 0.55
AIM2absent in melanoma 2 (206513_at), score: -0.65
ATP6V1B2ATPase, H+ transporting, lysosomal 56/58kDa, V1 subunit B2 (201089_at), score: -0.58
BAZ2Abromodomain adjacent to zinc finger domain, 2A (201353_s_at), score: -0.58
C4orf31chromosome 4 open reading frame 31 (219747_at), score: 0.51
C5orf30chromosome 5 open reading frame 30 (221823_at), score: 0.55
CD24CD24 molecule (266_s_at), score: -0.62
CDR2Lcerebellar degeneration-related protein 2-like (213230_at), score: 0.52
COL11A1collagen, type XI, alpha 1 (37892_at), score: 0.52
COPZ2coatomer protein complex, subunit zeta 2 (219561_at), score: 0.48
CRTAPcartilage associated protein (201380_at), score: 0.59
CRYABcrystallin, alpha B (209283_at), score: 0.59
DDX17DEAD (Asp-Glu-Ala-Asp) box polypeptide 17 (208151_x_at), score: -0.71
DIO2deiodinase, iodothyronine, type II (203700_s_at), score: -0.67
DUSP14dual specificity phosphatase 14 (203367_at), score: 0.51
EPHB2EPH receptor B2 (209589_s_at), score: -0.68
FAM169Afamily with sequence similarity 169, member A (213954_at), score: -0.64
FASFas (TNF receptor superfamily, member 6) (204780_s_at), score: 0.49
FAT1FAT tumor suppressor homolog 1 (Drosophila) (201579_at), score: 0.58
FKBP4FK506 binding protein 4, 59kDa (200894_s_at), score: -0.61
FKBP9FK506 binding protein 9, 63 kDa (212169_at), score: 0.69
GAGE4G antigen 4 (207086_x_at), score: -0.96
GAGE6G antigen 6 (208155_x_at), score: -0.93
GAS6growth arrest-specific 6 (202177_at), score: 0.54
GATA3GATA binding protein 3 (209604_s_at), score: -0.79
GLSglutaminase (203159_at), score: 0.51
HAS2hyaluronan synthase 2 (206432_at), score: 0.53
HERC5hect domain and RLD 5 (219863_at), score: -0.72
HGSNATheparan-alpha-glucosaminide N-acetyltransferase (218017_s_at), score: 0.6
HLA-DPA1major histocompatibility complex, class II, DP alpha 1 (211990_at), score: -0.57
HSPB7heat shock 27kDa protein family, member 7 (cardiovascular) (218934_s_at), score: 0.59
IRS2insulin receptor substrate 2 (209185_s_at), score: 0.6
L1CAML1 cell adhesion molecule (204584_at), score: -0.6
LDOC1leucine zipper, down-regulated in cancer 1 (204454_at), score: 0.54
LOC728855hypothetical LOC728855 (222001_x_at), score: -0.62
LRRC2leucine rich repeat containing 2 (219949_at), score: 0.49
LTBP2latent transforming growth factor beta binding protein 2 (204682_at), score: 0.52
MAN2A1mannosidase, alpha, class 2A, member 1 (205105_at), score: 0.56
MARK1MAP/microtubule affinity-regulating kinase 1 (221047_s_at), score: -0.79
MFAP5microfibrillar associated protein 5 (213764_s_at), score: 0.59
MITFmicrophthalmia-associated transcription factor (207233_s_at), score: -0.62
MYO1Cmyosin IC (214656_x_at), score: 0.58
NEFLneurofilament, light polypeptide (221805_at), score: -0.73
NMUneuromedin U (206023_at), score: -0.61
NRGNneurogranin (protein kinase C substrate, RC3) (204081_at), score: -0.66
OASL2'-5'-oligoadenylate synthetase-like (210797_s_at), score: -0.96
PCLOpiccolo (presynaptic cytomatrix protein) (213558_at), score: -0.58
PDE10Aphosphodiesterase 10A (205501_at), score: -0.6
PILRBpaired immunoglobin-like type 2 receptor beta (220954_s_at), score: -0.62
PODXLpodocalyxin-like (201578_at), score: 0.54
PSMB4proteasome (prosome, macropain) subunit, beta type, 4 (202243_s_at), score: 0.58
PTGER3prostaglandin E receptor 3 (subtype EP3) (213933_at), score: 0.54
QPCTglutaminyl-peptide cyclotransferase (205174_s_at), score: 0.52
RAB40BRAB40B, member RAS oncogene family (204547_at), score: 0.54
RABGAP1LRAB GTPase activating protein 1-like (213982_s_at), score: 0.52
RAD23BRAD23 homolog B (S. cerevisiae) (201223_s_at), score: 0.53
REEP1receptor accessory protein 1 (204364_s_at), score: -0.57
RP6-213H19.1serine/threonine protein kinase MST4 (218499_at), score: -0.64
SLC4A4solute carrier family 4, sodium bicarbonate cotransporter, member 4 (203908_at), score: 0.54
SNCAsynuclein, alpha (non A4 component of amyloid precursor) (204466_s_at), score: -0.68
SPARCsecreted protein, acidic, cysteine-rich (osteonectin) (212667_at), score: 0.52
SYTL2synaptotagmin-like 2 (220613_s_at), score: -0.64
TBC1D8TBC1 domain family, member 8 (with GRAM domain) (204526_s_at), score: -0.57
TCEAL2transcription elongation factor A (SII)-like 2 (211276_at), score: -0.87
TEKTEK tyrosine kinase, endothelial (206702_at), score: 0.5
TIMP2TIMP metallopeptidase inhibitor 2 (203167_at), score: 0.56
TMEM204transmembrane protein 204 (219315_s_at), score: 0.48
TMEM47transmembrane protein 47 (209656_s_at), score: 0.57
TMOD1tropomodulin 1 (203661_s_at), score: -0.65
TNS1tensin 1 (221748_s_at), score: 0.52
TSPAN13tetraspanin 13 (217979_at), score: 0.53
UAP1UDP-N-acteylglucosamine pyrophosphorylase 1 (209340_at), score: 0.52
UBL3ubiquitin-like 3 (201535_at), score: 0.58
UGT1A1UDP glucuronosyltransferase 1 family, polypeptide A1 (207126_x_at), score: -0.9
UGT1A6UDP glucuronosyltransferase 1 family, polypeptide A6 (206094_x_at), score: -0.9
UGT1A9UDP glucuronosyltransferase 1 family, polypeptide A9 (204532_x_at), score: -0.9
USP18ubiquitin specific peptidase 18 (219211_at), score: -0.57
VWA5Avon Willebrand factor A domain containing 5A (210102_at), score: -0.6
WT1Wilms tumor 1 (206067_s_at), score: -0.67
ZNF415zinc finger protein 415 (205514_at), score: 0.49
Non-Entrez genes
Unknown, score:
HELP
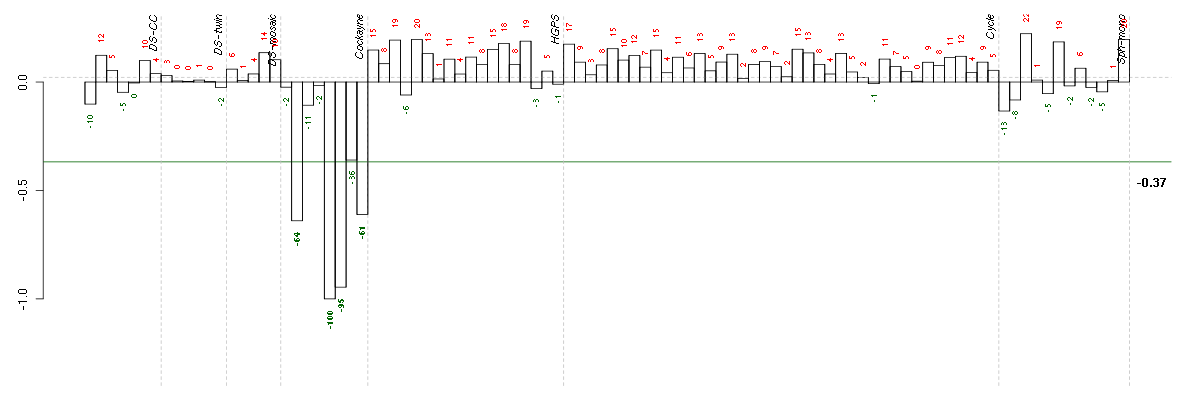
Conditions in the module, given in the same order as on the expression
plot above. Red color means over-expression, green under-expression in
the given condition.
The barplot below shows the condition (sample) scores. A separate bar
is shown for each sample, its height is the corresponding score of the
sample in the module. The red and green numbers on the bars are the
sample scores expressed in percents, i.e. 100% is 1.0.
The red and green lines show the module thresholds, samples above
the red line and below the green line are included in the module.
The different experiments that were part of the study, are separated
by dashed vertical lines.
— Click on the Help button again to close this help window.
| Id | sample | Experiment | ExpName | Array | Syndrome | Cell.line |
| E-GEOD-3407-raw-cel-1437949721.cel | 5 | 4 | Cockayne | hgu133a | CS | CSB |
| E-GEOD-3407-raw-cel-1437949750.cel | 6 | 4 | Cockayne | hgu133a | CS | CSB |
| E-GEOD-3407-raw-cel-1437949579.cel | 2 | 4 | Cockayne | hgu133a | none | CSB |
| E-GEOD-3407-raw-cel-1437949938.cel | 8 | 4 | Cockayne | hgu133a | none | CSB |


© 2008-2010 Computational Biology Group, Department of Medical Genetics,
University of Lausanne, Switzerland