Previous module |
Next module
Module #664, TG: 2.8, TC: 2, 112 probes, 111 Entrez genes, 3 conditions


HELP
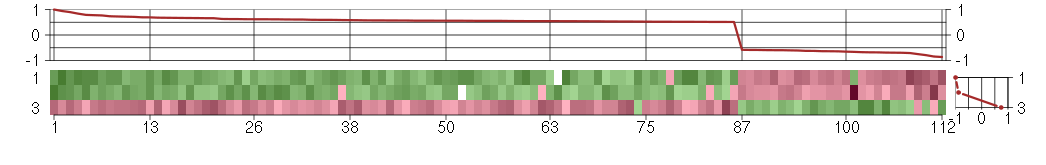
The image plot shows the color-coded level of gene expression, for the
genes and conditions in a given transcription module. The genes are on
the horizontal, the conditions on the vertical axis.
The genes are ordered according to their ISA gene scores, similarly
the conditions are ordered according to their condition scores. The
score of a gene means the «degree of inclusion» in
the module: a high score gene is essential in the module.
Condition scores can also be negative, that means that the genes of
the module are all down-regulated in the condition. Here the absolute
value of the score gives the «degree of inclusion».
The plots above and beside the expression matrix show the gene scores
and condition scores, respectively.
Note that the plot is interactive, you can see the name of the gene
and condition under the mouse cursor.
The expression matrix was normalized to have mean zero and standard
deviation one for every gene separately across all conditions
(i.e. not just for the conditions in the module).
— Click on the Help button again to close this help window.

Under-expression is coded with green,
over-expression with red color.
Help |
Hide |
Top
Help |
Show |
Top
The GO tree — Biological processes
HELP
This is one of three sections showing Gene Ontology enrichment of the
current module: in this case for biological processes.
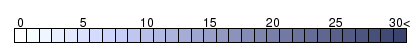
The graph shows the hierarchy of the GO categories, their enrichment
for the current module is color coded, and the blue number beside the
category is the minus log ten p-value of the enrichment. (Calculated
using the standard hypergeometric test.) The color of the arrows code
«is a» (cyan) and «part of» relationships.
The tree was built the following way. First all GO terms with more
significant enrichment p-value than 0.05 were collected. Then all
paths from these terms to the root node of the GO tree were included
too. If a GO term is included more than once in the tree, then the
green numbers show 1) the id of the node, this makes it easier to find
other appereances of the term, and 2) the number of appearences.
Note that the same GO category might show up on the graph many
times. This is because the GO was «straightened» for this
graph, i.e. if there are more paths from a GO term to the root node of
the tree, all of them are included. The green numbers
Move the mouse cursor over the terms to get their definition. Clicking
on them takes you to the corresponding Gene Ontology web page.
If you cannot see a graph here at all, that means that there were no
significantly enriched GO categories, at the 0.05 level.
— Click on the Help button again to close this help window.
Help |
Hide |
Top
Help |
Show |
Top
The GO tree — Cellular Components
HELP
This is one of three sections showing Gene Ontology enrichment of the
current module: in this case for cellular components.
The graph shows the hierarchy of the GO categories, their enrichment
for the current module is color coded, and the blue number beside the
category is the minus log ten p-value of the enrichment. (Calculated
using the standard hypergeometric test.) The color of the arrows code
«is a» (cyan) and «part of» relationships.
The tree was built the following way. First all GO terms with more
significant enrichment p-value than 0.05 were collected. Then all
paths from these terms to the root node of the GO tree were included
too. If a GO term is included more than once in the tree, then the
green numbers show 1) the id of the node, this makes it easier to find
other appereances of the term, and 2) the number of appearences.
Note that the same GO category might show up on the graph many
times. This is because the GO was «straightened» for this
graph, i.e. if there are more paths from a GO term to the root node of
the tree, all of them are included. The green numbers
Move the mouse cursor over the terms to get their definition. Clicking
on them takes you to the corresponding Gene Ontology web page.
If you cannot see a graph here at all, that means that there were no
significantly enriched GO categories, at the 0.05 level.
— Click on the Help button again to close this help window.
Help |
Hide |
Top
Help |
Show |
Top
The GO tree — Molecular Function
HELP
This is one of three sections showing Gene Ontology enrichment of the
current module: in this case for molecular function.
The graph shows the hierarchy of the GO categories, their enrichment
for the current module is color coded, and the blue number beside the
category is the minus log ten p-value of the enrichment. (Calculated
using the standard hypergeometric test.) The color of the arrows code
«is a» (cyan) and «part of» relationships.
The tree was built the following way. First all GO terms with more
significant enrichment p-value than 0.05 were collected. Then all
paths from these terms to the root node of the GO tree were included
too. If a GO term is included more than once in the tree, then the
green numbers show 1) the id of the node, this makes it easier to find
other appereances of the term, and 2) the number of appearences.
Note that the same GO category might show up on the graph many
times. This is because the GO was «straightened» for this
graph, i.e. if there are more paths from a GO term to the root node of
the tree, all of them are included. The green numbers
Move the mouse cursor over the terms to get their definition. Clicking
on them takes you to the corresponding Gene Ontology web page.
If you cannot see a graph here at all, that means that there were no
significantly enriched GO categories, at the 0.05 level.
— Click on the Help button again to close this help window.
Help |
Hide |
Top
Help |
Show |
Top
GO BP test for over-representation
HELP
List of all enriched GO categories (biological processes), at the 0.05
p-value level.
The columns:
- ExpCount is the expected count of genes in the
module annotated with the given GO term, just by chance.
- Count
is the number of genes in the module annotated with the given GO
term.
- Size is the total number of genes (in our universe)
annotated with the GO term.
Clicking on Count shows the genes that drive the
enrichment. You can also click on the individual numbers in
the Count column, to show the driving genes for that individual
GO category.
Clicking on the GO identifiers takes you to the Gene Ontology web
pages.
— Click on the Help button again to close this help window.
| Id | Pvalue | ExpCount | Count | Size | Term |
| GO:0032501 | 2.392e-02 | 21.04 | 36
AFF2, AGT, APP, ARHGAP26, BCL2L11, BEX1, CDK5R1, CEACAM1, CELSR2, CHRNA6, CTSE, CYSLTR1, ENTPD1, F11, FGF12, FGF9, HBB, HOXD1, KALRN, MATN3, MYL4, NEFM, OR2W1, PDE3B, PDLIM3, PLXDC1, PRLR, RPGRIP1, SEMA6D, SEPT5, SNAP25, TBX6, TP63, TTLL7, VGF, WNT2B | 1611 | multicellular organismal process |
| GO:0051046 | 4.501e-02 | 0.7446 | 5
AGT, CHRNA6, PDE3B, SEPT5, SNAP25 | 57 | regulation of secretion |
| GO:0030073 | 4.642e-02 | 0.1959 | 3
PDE3B, SNAP25, VGF | 15 | insulin secretion |
Help |
Hide |
Top
Help |
Show |
Top
GO CC test for over-representation
HELP
List of all enriched GO categories (cellular components), at the 0.05
p-value level.
The columns:
- ExpCount is the expected count of genes in the
module annotated with the given GO term, just by chance.
- Count
is the number of genes in the module annotated with the given GO
term.
- Size is the total number of genes (in our universe)
annotated with the GO term.
Clicking on Count shows the genes that drive the
enrichment. You can also click on the individual numbers in
the Count column, to show the driving genes for that individual
GO category.
Clicking on the GO identifiers takes you to the Gene Ontology web
pages.
— Click on the Help button again to close this help window.
| Id | Pvalue | ExpCount | Count | Size | Term |
| GO:0005886 | 1.047e-02 | 17.67 | 32
APP, ARHGAP26, ATP1B4, BAI2, BCL2L11, C22orf29, C9orf127, CDK5R1, CEACAM1, CELSR2, CHRNA6, CYSLTR1, ENTPD1, HPN, ICAM2, IL2RB, IRS4, KIRREL, LILRB4, MUC13, NEO1, OR2W1, SCN11A, SEMA6D, SEPT5, SLC38A4, SNAP25, STYK1, TNFSF10, TP63, TRA@, ULBP1 | 1409 | plasma membrane |
| GO:0005576 | 1.730e-02 | 8.44 | 19
ACP6, ADAMDEC1, AGT, APOL1, APP, CEACAM1, CFI, F11, FGF12, FGF9, MATN3, MSTP9, MUC13, MUC5AC, PLXDC1, PRLR, TNFSF10, VGF, WNT2B | 673 | extracellular region |
Help |
Hide |
Top
Help |
Show |
Top
GO MF test for over-representation
HELP
List of all enriched GO categories (molecular function), at the 0.05
p-value level.
The columns:
- ExpCount is the expected count of genes in the
module annotated with the given GO term, just by chance.
- Count
is the number of genes in the module annotated with the given GO
term.
- Size is the total number of genes (in our universe)
annotated with the GO term.
Clicking on Count shows the genes that drive the
enrichment. You can also click on the individual numbers in
the Count column, to show the driving genes for that individual
GO category.
Clicking on the GO identifiers takes you to the Gene Ontology web
pages.
— Click on the Help button again to close this help window.
Help |
Hide |
Top
Help |
Show |
Top
KEGG Pathway test for over-representation
HELP
List of all enriched KEGG pathways, at the 0.05
p-value level.
The columns:
- ExpCount is the expected count of genes in the
module annotated with the given KEGG pathway, just by chance.
- Count
is the number of genes in the module annotated with the given KEGG
pathway.
- Size is the total number of genes (in our universe)
annotated with the KEGG pathway.
Clicking on Count shows the genes that drive the
enrichment. You can also click on the individual numbers in
the Count column, to show the driving genes for that individual
KEGG pathway.
Clicking on the KEGG identifiers takes you to the KEGG web site.
— Click on the Help button again to close this help window.
Help |
Hide |
Top
Help |
Show |
Top
miRNA test for over-representation
HELP
List of all enriched miRNA families, at the 0.05
p-value level.
The columns:
- ExpCount is the expected count of genes in the
module regulated by the given miRNA family, just by chance.
- Count
is the number of genes in the module regulated by the given miRNA
family.
- Size is the total number of genes (in our universe)
regulated with the given miRNA family.
Clicking on Count shows the genes that drive the
enrichment. You can also click on the individual numbers in
the Count column, to show the driving genes for that individual
miRNA family.
The miRNA regulation data was taken from the TargetScan database.
(Only the conserved sites were used for the current analysis.)
Clicking on the miRNA names takes you to the TargetScan web site.
— Click on the Help button again to close this help window.
Help |
Hide |
Top
Help |
Show |
Top
Chromosome test for over-representation
HELP
List of all enriched Chromosomes, at the 0.05
p-value level.
The columns:
- ExpCount is the expected number of genes in the
module on the given chromosome, just by chance.
- Count
is the number of genes in the module on the given chromosome.
- Size is the total number of genes (in our universe)
on the given chromosome.
Clicking on Count shows the genes that drive the
enrichment. You can also click on the individual numbers in
the Count column, to show the driving genes for that individual
chromosome.
— Click on the Help button again to close this help window.
HELP
A list of all genes in the current module, in alphabetical order. The
size of the text corresponds to the gene scores.
Note that some gene symbols may show up more than once, if many
probes match the same Entrez gene.
Genes with no Entrez mapping are given separately, with their
Affymetrics probe ID.
— Click on the Help button again to close this help window.
Entrez genes
ABOABO blood group (transferase A, alpha 1-3-N-acetylgalactosaminyltransferase; transferase B, alpha 1-3-galactosyltransferase) (216716_at), score: 0.84
ACP6acid phosphatase 6, lysophosphatidic (218795_at), score: -0.68
ACSL5acyl-CoA synthetase long-chain family member 5 (218322_s_at), score: 0.57
ADAM21ADAM metallopeptidase domain 21 (207665_at), score: -0.61
ADAMDEC1ADAM-like, decysin 1 (206134_at), score: 0.58
AFF2AF4/FMR2 family, member 2 (206105_at), score: 0.54
AGBL5ATP/GTP binding protein-like 5 (218480_at), score: -0.7
AGMATagmatine ureohydrolase (agmatinase) (219792_at), score: 0.61
AGTangiotensinogen (serpin peptidase inhibitor, clade A, member 8) (202834_at), score: 0.58
APOL1apolipoprotein L, 1 (209546_s_at), score: 0.52
APPamyloid beta (A4) precursor protein (200602_at), score: 0.56
ARHGAP26Rho GTPase activating protein 26 (205068_s_at), score: 0.57
ARHGEF3Rho guanine nucleotide exchange factor (GEF) 3 (218501_at), score: -0.6
ATAD5ATPase family, AAA domain containing 5 (220223_at), score: 0.53
ATP1B4ATPase, (Na+)/K+ transporting, beta 4 polypeptide (220556_at), score: 0.55
B9D1B9 protein domain 1 (210534_s_at), score: -0.75
BAI2brain-specific angiogenesis inhibitor 2 (204966_at), score: 0.61
BCL2L11BCL2-like 11 (apoptosis facilitator) (222343_at), score: 0.79
BDH23-hydroxybutyrate dehydrogenase, type 2 (218285_s_at), score: -0.64
BEX1brain expressed, X-linked 1 (218332_at), score: -0.59
BNC2basonuclin 2 (220272_at), score: -0.67
C11orf1chromosome 11 open reading frame 1 (218925_s_at), score: 0.56
C11orf20chromosome 11 open reading frame 20 (219883_at), score: 0.59
C22orf29chromosome 22 open reading frame 29 (219560_at), score: -0.65
C7orf28Achromosome 7 open reading frame 28A (201974_s_at), score: 0.57
C9orf127chromosome 9 open reading frame 127 (207839_s_at), score: -0.59
CAMK2Bcalcium/calmodulin-dependent protein kinase II beta (34846_at), score: 0.55
CC2D1Acoiled-coil and C2 domain containing 1A (58994_at), score: 0.55
CCDC28Acoiled-coil domain containing 28A (209479_at), score: -0.63
CCDC9coiled-coil domain containing 9 (206257_at), score: 0.55
CDK5R1cyclin-dependent kinase 5, regulatory subunit 1 (p35) (204995_at), score: 0.53
CEACAM1carcinoembryonic antigen-related cell adhesion molecule 1 (biliary glycoprotein) (211883_x_at), score: 0.55
CELSR2cadherin, EGF LAG seven-pass G-type receptor 2 (flamingo homolog, Drosophila) (204029_at), score: 1
CFIcomplement factor I (203854_at), score: -0.66
CHRNA6cholinergic receptor, nicotinic, alpha 6 (207568_at), score: 0.53
CLIP1CAP-GLY domain containing linker protein 1 (210716_s_at), score: 0.54
CPEB3cytoplasmic polyadenylation element binding protein 3 (205773_at), score: 0.72
CTSEcathepsin E (205927_s_at), score: 0.57
CYP2R1cytochrome P450, family 2, subfamily R, polypeptide 1 (207786_at), score: 0.73
CYSLTR1cysteinyl leukotriene receptor 1 (216288_at), score: 0.56
ENTPD1ectonucleoside triphosphate diphosphohydrolase 1 (209473_at), score: 0.55
EXD3exonuclease 3'-5' domain containing 3 (220838_at), score: 0.62
F11coagulation factor XI (206610_s_at), score: 0.52
FGF12fibroblast growth factor 12 (207501_s_at), score: 0.78
FGF9fibroblast growth factor 9 (glia-activating factor) (206404_at), score: -0.71
GOLSYNGolgi-localized protein (218692_at), score: 0.56
HBBhemoglobin, beta (211696_x_at), score: 0.66
HIST1H2AGhistone cluster 1, H2ag (207156_at), score: -0.69
HOXD1homeobox D1 (205975_s_at), score: 0.51
HPNhepsin (204934_s_at), score: 0.57
HSPA6heat shock 70kDa protein 6 (HSP70B') (117_at), score: 0.62
ICAM2intercellular adhesion molecule 2 (204683_at), score: 0.71
IKZF4IKAROS family zinc finger 4 (Eos) (208472_at), score: 0.54
IL2RBinterleukin 2 receptor, beta (205291_at), score: 0.63
INE1inactivation escape 1 (non-protein coding) (207252_at), score: 0.63
IRS4insulin receptor substrate 4 (207403_at), score: 0.62
KALRNkalirin, RhoGEF kinase (206078_at), score: 0.67
KIAA1305KIAA1305 (220911_s_at), score: -0.86
KIRRELkin of IRRE like (Drosophila) (220825_s_at), score: 0.54
LILRB4leukocyte immunoglobulin-like receptor, subfamily B (with TM and ITIM domains), member 4 (210152_at), score: 0.62
MATN3matrilin 3 (206091_at), score: -0.68
MSTP9macrophage stimulating, pseudogene 9 (213382_at), score: 0.59
MUC13mucin 13, cell surface associated (218687_s_at), score: 0.9
MUC3Bmucin 3B, cell surface associated (214898_x_at), score: 0.53
MUC5ACmucin 5AC, oligomeric mucus/gel-forming (217182_at), score: 0.52
MYL4myosin, light chain 4, alkali; atrial, embryonic (210088_x_at), score: 0.56
NACA2nascent polypeptide-associated complex alpha subunit 2 (222224_at), score: 0.59
NCRNA00153non-protein coding RNA 153 (219961_s_at), score: -0.62
NEFMneurofilament, medium polypeptide (205113_at), score: 0.66
NEO1neogenin homolog 1 (chicken) (204321_at), score: -0.59
OR2W1olfactory receptor, family 2, subfamily W, member 1 (221451_s_at), score: 0.51
PDE3Bphosphodiesterase 3B, cGMP-inhibited (208591_s_at), score: 0.52
PDLIM3PDZ and LIM domain 3 (209621_s_at), score: 0.51
PECRperoxisomal trans-2-enoyl-CoA reductase (221142_s_at), score: -0.69
PET112LPET112-like (yeast) (204300_at), score: -0.64
PHF17PHD finger protein 17 (218517_at), score: 0.56
PLXDC1plexin domain containing 1 (219700_at), score: 0.69
PRLRprolactin receptor (216638_s_at), score: 0.51
PYHIN1pyrin and HIN domain family, member 1 (216748_at), score: 0.52
RANBP17RAN binding protein 17 (219661_at), score: 0.53
RAPGEF4Rap guanine nucleotide exchange factor (GEF) 4 (205651_x_at), score: 0.68
RNPEPL1arginyl aminopeptidase (aminopeptidase B)-like 1 (218301_at), score: 0.62
RPGRIP1retinitis pigmentosa GTPase regulator interacting protein 1 (206608_s_at), score: 0.61
SCN11Asodium channel, voltage-gated, type XI, alpha subunit (220791_x_at), score: 0.55
SEMA6Dsema domain, transmembrane domain (TM), and cytoplasmic domain, (semaphorin) 6D (220574_at), score: 0.52
SEPT5septin 5 (209767_s_at), score: 0.56
SERPINB13serpin peptidase inhibitor, clade B (ovalbumin), member 13 (211362_s_at), score: 0.66
SETD1ASET domain containing 1A (213202_at), score: 0.52
SLC38A4solute carrier family 38, member 4 (220786_s_at), score: -0.6
SNAP25synaptosomal-associated protein, 25kDa (202508_s_at), score: -0.84
STYK1serine/threonine/tyrosine kinase 1 (221696_s_at), score: 0.54
TBX6T-box 6 (207684_at), score: 0.6
TCP10t-complex 10 homolog (mouse) (207503_at), score: 0.59
TFDP2transcription factor Dp-2 (E2F dimerization partner 2) (203588_s_at), score: -0.62
TIAF1TGFB1-induced anti-apoptotic factor 1 (202039_at), score: -0.58
TNFSF10tumor necrosis factor (ligand) superfamily, member 10 (214329_x_at), score: 0.94
TNK1tyrosine kinase, non-receptor, 1 (217149_x_at), score: 0.61
TP53TG1TP53 target 1 (non-protein coding) (209917_s_at), score: -0.6
TP63tumor protein p63 (209863_s_at), score: 0.69
TRA@T cell receptor alpha locus (216540_at), score: 0.68
TTLL7tubulin tyrosine ligase-like family, member 7 (219882_at), score: 0.54
UGT1A8UDP glucuronosyltransferase 1 family, polypeptide A8 (221304_at), score: 0.54
ULBP1UL16 binding protein 1 (221323_at), score: 0.77
VGFVGF nerve growth factor inducible (205586_x_at), score: 0.56
VWA5Avon Willebrand factor A domain containing 5A (210102_at), score: -0.79
WNT2Bwingless-type MMTV integration site family, member 2B (206459_s_at), score: 0.54
ZBTB40zinc finger and BTB domain containing 40 (203958_s_at), score: 0.67
ZNF254zinc finger protein 254 (206862_at), score: 0.57
ZNF37Bzinc finger protein 37B (215358_x_at), score: 0.52
ZNF440zinc finger protein 440 (215892_at), score: 0.54
ZNF749zinc finger protein 749 (215289_at), score: 0.73
Non-Entrez genes
203958_s_atUnknown, score: 0.67
HELP
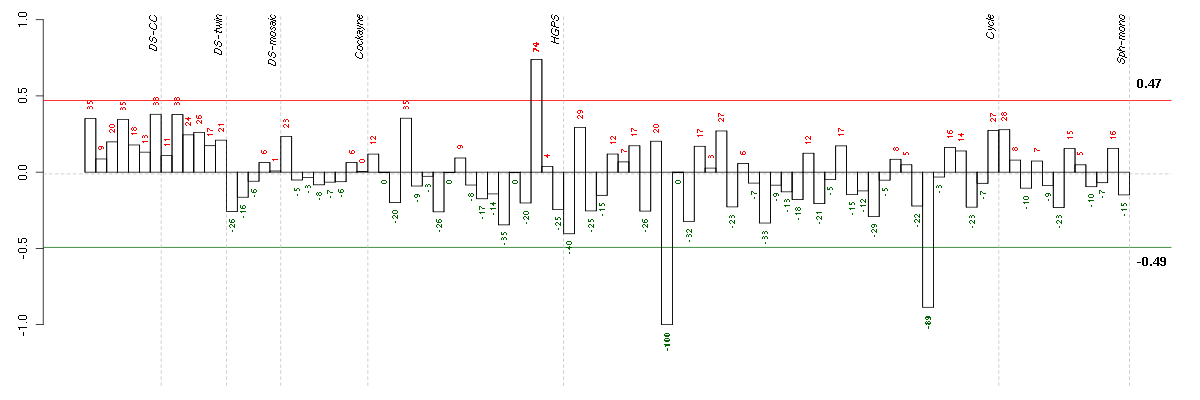
Conditions in the module, given in the same order as on the expression
plot above. Red color means over-expression, green under-expression in
the given condition.
The barplot below shows the condition (sample) scores. A separate bar
is shown for each sample, its height is the corresponding score of the
sample in the module. The red and green numbers on the bars are the
sample scores expressed in percents, i.e. 100% is 1.0.
The red and green lines show the module thresholds, samples above
the red line and below the green line are included in the module.
The different experiments that were part of the study, are separated
by dashed vertical lines.
— Click on the Help button again to close this help window.
| Id | sample | Experiment | ExpName | Array | Syndrome | Cell.line |
| E-TABM-263-raw-cel-1515485831.cel | 10 | 6 | Cycle | hgu133a2 | none | Cycle 1 |
| E-TABM-263-raw-cel-1515486311.cel | 34 | 6 | Cycle | hgu133a2 | none | Cycle 1 |
| E-GEOD-3860-raw-cel-1561690432.cel | 16 | 5 | HGPS | hgu133a | HGPS | AG10750 |


© 2008-2010 Computational Biology Group, Department of Medical Genetics,
University of Lausanne, Switzerland