Previous module |
Next module
Module #723, TG: 2.8, TC: 1.4, 96 probes, 96 Entrez genes, 13 conditions


HELP
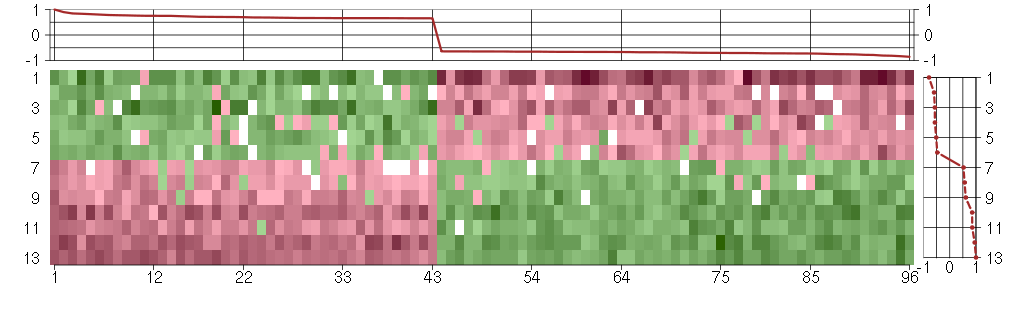
The image plot shows the color-coded level of gene expression, for the
genes and conditions in a given transcription module. The genes are on
the horizontal, the conditions on the vertical axis.
The genes are ordered according to their ISA gene scores, similarly
the conditions are ordered according to their condition scores. The
score of a gene means the «degree of inclusion» in
the module: a high score gene is essential in the module.
Condition scores can also be negative, that means that the genes of
the module are all down-regulated in the condition. Here the absolute
value of the score gives the «degree of inclusion».
The plots above and beside the expression matrix show the gene scores
and condition scores, respectively.
Note that the plot is interactive, you can see the name of the gene
and condition under the mouse cursor.
The expression matrix was normalized to have mean zero and standard
deviation one for every gene separately across all conditions
(i.e. not just for the conditions in the module).
— Click on the Help button again to close this help window.

Under-expression is coded with green,
over-expression with red color.
Help |
Hide |
Top
Help |
Show |
Top
The GO tree — Biological processes
HELP
This is one of three sections showing Gene Ontology enrichment of the
current module: in this case for biological processes.
The graph shows the hierarchy of the GO categories, their enrichment
for the current module is color coded, and the blue number beside the
category is the minus log ten p-value of the enrichment. (Calculated
using the standard hypergeometric test.) The color of the arrows code
«is a» (cyan) and «part of» relationships.
The tree was built the following way. First all GO terms with more
significant enrichment p-value than 0.05 were collected. Then all
paths from these terms to the root node of the GO tree were included
too. If a GO term is included more than once in the tree, then the
green numbers show 1) the id of the node, this makes it easier to find
other appereances of the term, and 2) the number of appearences.
Note that the same GO category might show up on the graph many
times. This is because the GO was «straightened» for this
graph, i.e. if there are more paths from a GO term to the root node of
the tree, all of them are included. The green numbers
Move the mouse cursor over the terms to get their definition. Clicking
on them takes you to the corresponding Gene Ontology web page.
If you cannot see a graph here at all, that means that there were no
significantly enriched GO categories, at the 0.05 level.
— Click on the Help button again to close this help window.
Help |
Hide |
Top
Help |
Show |
Top
The GO tree — Cellular Components
HELP
This is one of three sections showing Gene Ontology enrichment of the
current module: in this case for cellular components.
The graph shows the hierarchy of the GO categories, their enrichment
for the current module is color coded, and the blue number beside the
category is the minus log ten p-value of the enrichment. (Calculated
using the standard hypergeometric test.) The color of the arrows code
«is a» (cyan) and «part of» relationships.
The tree was built the following way. First all GO terms with more
significant enrichment p-value than 0.05 were collected. Then all
paths from these terms to the root node of the GO tree were included
too. If a GO term is included more than once in the tree, then the
green numbers show 1) the id of the node, this makes it easier to find
other appereances of the term, and 2) the number of appearences.
Note that the same GO category might show up on the graph many
times. This is because the GO was «straightened» for this
graph, i.e. if there are more paths from a GO term to the root node of
the tree, all of them are included. The green numbers
Move the mouse cursor over the terms to get their definition. Clicking
on them takes you to the corresponding Gene Ontology web page.
If you cannot see a graph here at all, that means that there were no
significantly enriched GO categories, at the 0.05 level.
— Click on the Help button again to close this help window.
Help |
Hide |
Top
Help |
Show |
Top
The GO tree — Molecular Function
HELP
This is one of three sections showing Gene Ontology enrichment of the
current module: in this case for molecular function.
The graph shows the hierarchy of the GO categories, their enrichment
for the current module is color coded, and the blue number beside the
category is the minus log ten p-value of the enrichment. (Calculated
using the standard hypergeometric test.) The color of the arrows code
«is a» (cyan) and «part of» relationships.
The tree was built the following way. First all GO terms with more
significant enrichment p-value than 0.05 were collected. Then all
paths from these terms to the root node of the GO tree were included
too. If a GO term is included more than once in the tree, then the
green numbers show 1) the id of the node, this makes it easier to find
other appereances of the term, and 2) the number of appearences.
Note that the same GO category might show up on the graph many
times. This is because the GO was «straightened» for this
graph, i.e. if there are more paths from a GO term to the root node of
the tree, all of them are included. The green numbers
Move the mouse cursor over the terms to get their definition. Clicking
on them takes you to the corresponding Gene Ontology web page.
If you cannot see a graph here at all, that means that there were no
significantly enriched GO categories, at the 0.05 level.
— Click on the Help button again to close this help window.
peptide receptor activity
Combining with an extracellular or intracellular peptide to initiate a change in cell activity.
molecular_function
Elemental activities, such as catalysis or binding, describing the actions of a gene product at the molecular level. A given gene product may exhibit one or more molecular functions.
signal transducer activity
Mediates the transfer of a signal from the outside to the inside of a cell by means other than the introduction of the signal molecule itself into the cell.
receptor activity
Combining with an extracellular or intracellular messenger to initiate a change in cell activity.
transmembrane receptor activity
Combining with an extracellular or intracellular messenger to initiate a change in cell activity, and spanning to the membrane of either the cell or an organelle.
G-protein coupled receptor activity
A receptor that binds an extracellular ligand and transmits the signal to a heterotrimeric G-protein complex. These receptors are characteristically seven-transmembrane receptors and are made up of hetero- or homodimers.
binding
The selective, often stoichiometric, interaction of a molecule with one or more specific sites on another molecule.
peptide receptor activity, G-protein coupled
Combining with an extracellular or intracellular peptide to initiate a G-protein mediated change in cell activity. A G-protein is a signal transduction molecule that alternates between an inactive GDP-bound and an active GTP-bound state.
peptide binding
Interacting selectively with peptides, any of a group of organic compounds comprising two or more amino acids linked by peptide bonds.
molecular transducer activity
The molecular function that accepts an input of one form and creates an output of a different form.
all
This term is the most general term possible
peptide receptor activity
Combining with an extracellular or intracellular peptide to initiate a change in cell activity.
peptide receptor activity, G-protein coupled
Combining with an extracellular or intracellular peptide to initiate a G-protein mediated change in cell activity. A G-protein is a signal transduction molecule that alternates between an inactive GDP-bound and an active GTP-bound state.
Help |
Hide |
Top
Help |
Show |
Top
GO BP test for over-representation
HELP
List of all enriched GO categories (biological processes), at the 0.05
p-value level.
The columns:
- ExpCount is the expected count of genes in the
module annotated with the given GO term, just by chance.
- Count
is the number of genes in the module annotated with the given GO
term.
- Size is the total number of genes (in our universe)
annotated with the GO term.
Clicking on Count shows the genes that drive the
enrichment. You can also click on the individual numbers in
the Count column, to show the driving genes for that individual
GO category.
Clicking on the GO identifiers takes you to the Gene Ontology web
pages.
— Click on the Help button again to close this help window.
| Id | Pvalue | ExpCount | Count | Size | Term |
| GO:0051239 | 1.756e-02 | 3.088 | 11
ADORA2B, BDKRB2, DMPK, IRF1, MC4R, NEFM, PPARG, SMAD3, TICAM2, TLR3, TP53 | 313 | regulation of multicellular organismal process |
| GO:0032501 | 4.605e-02 | 15.9 | 28
ACSL4, ADORA2B, ANGPTL2, BDKRB2, CDH6, DCLK1, DHRS3, DMPK, GMCL1, IRF1, KAL1, MC4R, MMP10, MMP16, NEFM, NPTX1, OSTM1, PITX1, PPARG, RERE, ROR2, SECTM1, SMAD3, SSTR1, TBC1D8, TICAM2, TLR3, TP53 | 1611 | multicellular organismal process |
Help |
Hide |
Top
Help |
Show |
Top
GO CC test for over-representation
HELP
List of all enriched GO categories (cellular components), at the 0.05
p-value level.
The columns:
- ExpCount is the expected count of genes in the
module annotated with the given GO term, just by chance.
- Count
is the number of genes in the module annotated with the given GO
term.
- Size is the total number of genes (in our universe)
annotated with the GO term.
Clicking on Count shows the genes that drive the
enrichment. You can also click on the individual numbers in
the Count column, to show the driving genes for that individual
GO category.
Clicking on the GO identifiers takes you to the Gene Ontology web
pages.
— Click on the Help button again to close this help window.
| Id | Pvalue | ExpCount | Count | Size | Term |
| GO:0005886 | 3.790e-02 | 13.88 | 25
ACSL4, ADORA2B, BDKRB2, CALB2, CDH6, DCLK1, EPHA4, JUP, LRP8, MC4R, MFAP3L, MMP16, OPCML, P2RY5, PCDH9, ROR2, SECTM1, SLC25A13, SLC4A7, SMAD3, SSTR1, TENC1, TICAM2, TLR3, ULBP2 | 1409 | plasma membrane |
| GO:0031224 | 4.006e-02 | 19.81 | 32
ACSL4, ADORA2B, BDKRB2, CDH6, DCLK1, DHRS3, EPHA4, GALNT12, GOLT1B, KIAA1305, LOC399491, LRP8, MAN1C1, MC4R, MFAP3L, MMP16, NPIP, OPCML, ORAI3, OSTM1, PCDH9, ROR2, SECTM1, SLC25A13, SLC4A7, SSTR1, THSD7A, TICAM2, TLR3, TMEM2, ULBP2, ZDHHC7 | 2010 | intrinsic to membrane |
Help |
Hide |
Top
Help |
Show |
Top
GO MF test for over-representation
HELP
List of all enriched GO categories (molecular function), at the 0.05
p-value level.
The columns:
- ExpCount is the expected count of genes in the
module annotated with the given GO term, just by chance.
- Count
is the number of genes in the module annotated with the given GO
term.
- Size is the total number of genes (in our universe)
annotated with the GO term.
Clicking on Count shows the genes that drive the
enrichment. You can also click on the individual numbers in
the Count column, to show the driving genes for that individual
GO category.
Clicking on the GO identifiers takes you to the Gene Ontology web
pages.
— Click on the Help button again to close this help window.
| Id | Pvalue | ExpCount | Count | Size | Term |
| GO:0004888 | 3.021e-03 | 3.229 | 13
ADORA2B, BDKRB2, EPHA4, LRP8, MC4R, OPCML, P2RY5, PPARG, ROR2, SSTR1, TICAM2, TLR3, ULBP2 | 324 | transmembrane receptor activity |
| GO:0008528 | 9.729e-03 | 0.2292 | 4
BDKRB2, MC4R, OPCML, SSTR1 | 23 | peptide receptor activity, G-protein coupled |
| GO:0001653 | 1.602e-02 | 0.2691 | 4
BDKRB2, MC4R, OPCML, SSTR1 | 27 | peptide receptor activity |
| GO:0050327 | 2.809e-02 | 0.0299 | 2
AKR1C3, HSD17B6 | 3 | testosterone 17-beta-dehydrogenase activity |
| GO:0004930 | 2.907e-02 | 1.306 | 7
ADORA2B, BDKRB2, MC4R, OPCML, P2RY5, PPARG, SSTR1 | 131 | G-protein coupled receptor activity |
Help |
Hide |
Top
Help |
Show |
Top
KEGG Pathway test for over-representation
HELP
List of all enriched KEGG pathways, at the 0.05
p-value level.
The columns:
- ExpCount is the expected count of genes in the
module annotated with the given KEGG pathway, just by chance.
- Count
is the number of genes in the module annotated with the given KEGG
pathway.
- Size is the total number of genes (in our universe)
annotated with the KEGG pathway.
Clicking on Count shows the genes that drive the
enrichment. You can also click on the individual numbers in
the Count column, to show the driving genes for that individual
KEGG pathway.
Clicking on the KEGG identifiers takes you to the KEGG web site.
— Click on the Help button again to close this help window.
Help |
Hide |
Top
Help |
Show |
Top
miRNA test for over-representation
HELP
List of all enriched miRNA families, at the 0.05
p-value level.
The columns:
- ExpCount is the expected count of genes in the
module regulated by the given miRNA family, just by chance.
- Count
is the number of genes in the module regulated by the given miRNA
family.
- Size is the total number of genes (in our universe)
regulated with the given miRNA family.
Clicking on Count shows the genes that drive the
enrichment. You can also click on the individual numbers in
the Count column, to show the driving genes for that individual
miRNA family.
The miRNA regulation data was taken from the TargetScan database.
(Only the conserved sites were used for the current analysis.)
Clicking on the miRNA names takes you to the TargetScan web site.
— Click on the Help button again to close this help window.
Help |
Hide |
Top
Help |
Show |
Top
Chromosome test for over-representation
HELP
List of all enriched Chromosomes, at the 0.05
p-value level.
The columns:
- ExpCount is the expected number of genes in the
module on the given chromosome, just by chance.
- Count
is the number of genes in the module on the given chromosome.
- Size is the total number of genes (in our universe)
on the given chromosome.
Clicking on Count shows the genes that drive the
enrichment. You can also click on the individual numbers in
the Count column, to show the driving genes for that individual
chromosome.
— Click on the Help button again to close this help window.
HELP
A list of all genes in the current module, in alphabetical order. The
size of the text corresponds to the gene scores.
Note that some gene symbols may show up more than once, if many
probes match the same Entrez gene.
Genes with no Entrez mapping are given separately, with their
Affymetrics probe ID.
— Click on the Help button again to close this help window.
Entrez genes
ACSL4acyl-CoA synthetase long-chain family member 4 (202422_s_at), score: 0.66
ACTR3BARP3 actin-related protein 3 homolog B (yeast) (218868_at), score: 0.71
ADORA2Badenosine A2b receptor (205891_at), score: -0.76
AHI1Abelson helper integration site 1 (221569_at), score: 0.7
AIM1absent in melanoma 1 (212543_at), score: -0.72
AKR1C3aldo-keto reductase family 1, member C3 (3-alpha hydroxysteroid dehydrogenase, type II) (209160_at), score: -0.64
ANGPTL2angiopoietin-like 2 (213004_at), score: -0.72
ANXA10annexin A10 (210143_at), score: 0.76
APOL6apolipoprotein L, 6 (219716_at), score: -0.64
BDKRB2bradykinin receptor B2 (205870_at), score: -0.65
C13orf15chromosome 13 open reading frame 15 (218723_s_at), score: -0.72
C4orf43chromosome 4 open reading frame 43 (218513_at), score: 0.66
CALB2calbindin 2 (205428_s_at), score: 0.68
CALCOCO1calcium binding and coiled-coil domain 1 (209002_s_at), score: -0.78
CDH6cadherin 6, type 2, K-cadherin (fetal kidney) (205532_s_at), score: 0.67
CLIP3CAP-GLY domain containing linker protein 3 (212358_at), score: -0.67
CRTC3CREB regulated transcription coactivator 3 (218648_at), score: -0.83
DCLK1doublecortin-like kinase 1 (205399_at), score: -0.71
DENND2ADENN/MADD domain containing 2A (53991_at), score: -0.65
DEPDC6DEP domain containing 6 (218858_at), score: -0.65
DHRS3dehydrogenase/reductase (SDR family) member 3 (202481_at), score: -0.67
DMPKdystrophia myotonica-protein kinase (37996_s_at), score: -0.7
DNAJB9DnaJ (Hsp40) homolog, subfamily B, member 9 (202843_at), score: 0.78
DOCK10dedicator of cytokinesis 10 (219279_at), score: 0.66
DUSP4dual specificity phosphatase 4 (204014_at), score: 0.66
EIF4Eeukaryotic translation initiation factor 4E (201436_at), score: 0.67
EPHA4EPH receptor A4 (206114_at), score: 0.66
ESM1endothelial cell-specific molecule 1 (208394_x_at), score: 0.66
GALNT12UDP-N-acetyl-alpha-D-galactosamine:polypeptide N-acetylgalactosaminyltransferase 12 (GalNAc-T12) (218885_s_at), score: -0.66
GFOD1glucose-fructose oxidoreductase domain containing 1 (219821_s_at), score: 0.8
GKglycerol kinase (207387_s_at), score: 0.73
GK3Pglycerol kinase 3 pseudogene (215966_x_at), score: 0.82
GMCL1germ cell-less homolog 1 (Drosophila) (218458_at), score: 0.74
GOLT1Bgolgi transport 1 homolog B (S. cerevisiae) (218193_s_at), score: 0.66
GTF2A1Lgeneral transcription factor IIA, 1-like (213413_at), score: -0.85
HSD17B6hydroxysteroid (17-beta) dehydrogenase 6 homolog (mouse) (37512_at), score: 0.71
HSPA12Aheat shock 70kDa protein 12A (214434_at), score: -0.7
IFIH1interferon induced with helicase C domain 1 (219209_at), score: -0.65
IRF1interferon regulatory factor 1 (202531_at), score: -0.69
JUPjunction plakoglobin (201015_s_at), score: -0.65
KAL1Kallmann syndrome 1 sequence (205206_at), score: 0.85
KIAA1305KIAA1305 (220911_s_at), score: -0.81
KIAA1462KIAA1462 (213316_at), score: -0.65
KLHL23kelch-like 23 (Drosophila) (213610_s_at), score: 0.75
LARP4La ribonucleoprotein domain family, member 4 (214155_s_at), score: 0.68
LOC100132540similar to LOC339047 protein (214870_x_at), score: -0.71
LOC339047hypothetical protein LOC339047 (221501_x_at), score: -0.73
LOC399491LOC399491 protein (214035_x_at), score: -0.66
LRP8low density lipoprotein receptor-related protein 8, apolipoprotein e receptor (205282_at), score: 0.78
MAN1C1mannosidase, alpha, class 1C, member 1 (218918_at), score: -0.81
MC4Rmelanocortin 4 receptor (221467_at), score: 0.77
MFAP3Lmicrofibrillar-associated protein 3-like (205442_at), score: 0.66
MMP10matrix metallopeptidase 10 (stromelysin 2) (205680_at), score: 0.71
MMP16matrix metallopeptidase 16 (membrane-inserted) (207012_at), score: 0.71
MSTO1misato homolog 1 (Drosophila) (218296_x_at), score: 0.66
MX2myxovirus (influenza virus) resistance 2 (mouse) (204994_at), score: -0.66
NEFMneurofilament, medium polypeptide (205113_at), score: 1
NPIPnuclear pore complex interacting protein (204538_x_at), score: -0.74
NPTX1neuronal pentraxin I (204684_at), score: 0.71
OAS22'-5'-oligoadenylate synthetase 2, 69/71kDa (204972_at), score: -0.78
OPCMLopioid binding protein/cell adhesion molecule-like (214111_at), score: 0.75
ORAI3ORAI calcium release-activated calcium modulator 3 (221864_at), score: -0.68
OSTM1osteopetrosis associated transmembrane protein 1 (218196_at), score: 0.67
P2RY5purinergic receptor P2Y, G-protein coupled, 5 (218589_at), score: -0.72
PCDH9protocadherin 9 (219737_s_at), score: 0.9
PCYT2phosphate cytidylyltransferase 2, ethanolamine (209577_at), score: -0.7
PDE5Aphosphodiesterase 5A, cGMP-specific (206757_at), score: -0.64
PITX1paired-like homeodomain 1 (208502_s_at), score: -0.68
PPARGperoxisome proliferator-activated receptor gamma (208510_s_at), score: -0.68
RAB1ARAB1A, member RAS oncogene family (213440_at), score: 0.69
RASSF2Ras association (RalGDS/AF-6) domain family member 2 (203185_at), score: -0.73
REREarginine-glutamic acid dipeptide (RE) repeats (200940_s_at), score: -0.71
ROR2receptor tyrosine kinase-like orphan receptor 2 (205578_at), score: -0.66
RPLP2P1ribosomal protein, large P2, pseudogene 1 (216490_x_at), score: 0.66
SAV1salvador homolog 1 (Drosophila) (218276_s_at), score: -0.66
SECTM1secreted and transmembrane 1 (213716_s_at), score: -0.68
SLC25A13solute carrier family 25, member 13 (citrin) (203775_at), score: 0.75
SLC4A7solute carrier family 4, sodium bicarbonate cotransporter, member 7 (209884_s_at), score: 0.75
SMAD3SMAD family member 3 (218284_at), score: -0.65
SSTR1somatostatin receptor 1 (208482_at), score: 0.66
TBC1D2BTBC1 domain family, member 2B (212796_s_at), score: -0.64
TBC1D8TBC1 domain family, member 8 (with GRAM domain) (204526_s_at), score: -0.66
TENC1tensin like C1 domain containing phosphatase (tensin 2) (212494_at), score: -0.68
THSD7Athrombospondin, type I, domain containing 7A (214920_at), score: -0.71
TICAM2toll-like receptor adaptor molecule 2 (214658_at), score: 0.67
TLR3toll-like receptor 3 (206271_at), score: -0.72
TMEM2transmembrane protein 2 (218113_at), score: 0.67
TNFAIP6tumor necrosis factor, alpha-induced protein 6 (206026_s_at), score: -0.66
TP53tumor protein p53 (201746_at), score: -0.75
TRIM21tripartite motif-containing 21 (204804_at), score: -0.75
UHRF1BP1LUHRF1 binding protein 1-like (213118_at), score: 0.65
ULBP2UL16 binding protein 2 (221291_at), score: 0.83
VWA5Avon Willebrand factor A domain containing 5A (210102_at), score: -0.67
WDR4WD repeat domain 4 (221632_s_at), score: 0.69
WDR6WD repeat domain 6 (217734_s_at), score: -0.65
ZDHHC7zinc finger, DHHC-type containing 7 (218606_at), score: -0.7
Non-Entrez genes
Unknown, score:
HELP
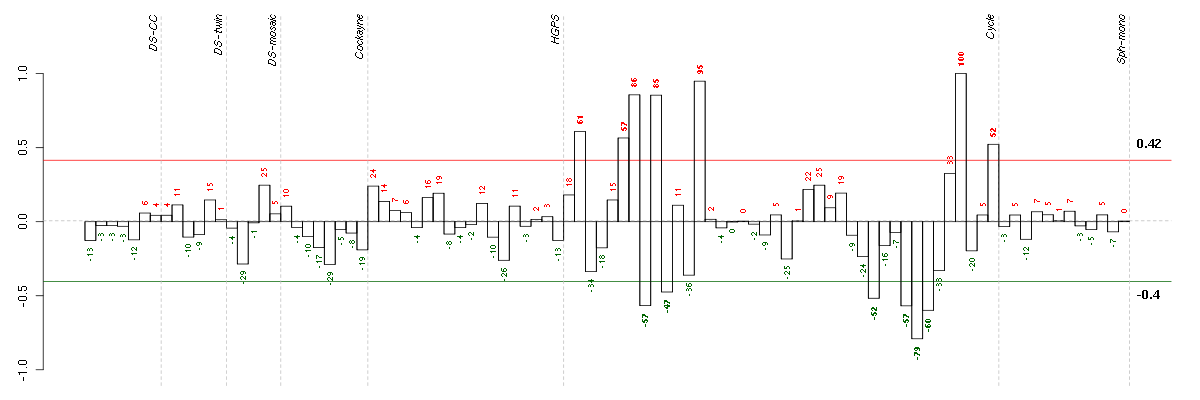
Conditions in the module, given in the same order as on the expression
plot above. Red color means over-expression, green under-expression in
the given condition.
The barplot below shows the condition (sample) scores. A separate bar
is shown for each sample, its height is the corresponding score of the
sample in the module. The red and green numbers on the bars are the
sample scores expressed in percents, i.e. 100% is 1.0.
The red and green lines show the module thresholds, samples above
the red line and below the green line are included in the module.
The different experiments that were part of the study, are separated
by dashed vertical lines.
— Click on the Help button again to close this help window.
| Id | sample | Experiment | ExpName | Array | Syndrome | Cell.line |
| E-TABM-263-raw-cel-1515486291.cel | 33 | 6 | Cycle | hgu133a2 | none | Cycle 1 |
| E-TABM-263-raw-cel-1515486311.cel | 34 | 6 | Cycle | hgu133a2 | none | Cycle 1 |
| E-TABM-263-raw-cel-1515486271.cel | 32 | 6 | Cycle | hgu133a2 | none | Cycle 1 |
| E-TABM-263-raw-cel-1515485791.cel | 8 | 6 | Cycle | hgu133a2 | none | Cycle 1 |
| E-TABM-263-raw-cel-1515486211.cel | 29 | 6 | Cycle | hgu133a2 | none | Cycle 1 |
| E-TABM-263-raw-cel-1515485831.cel | 10 | 6 | Cycle | hgu133a2 | none | Cycle 1 |
| E-TABM-263-raw-cel-1515486431.cel | 40 | 6 | Cycle | hgu133a2 | none | Cycle 1 |
| E-TABM-263-raw-cel-1515485751.cel | 6 | 6 | Cycle | hgu133a2 | none | Cycle 1 |
| E-TABM-263-raw-cel-1515485671.cel | 2 | 6 | Cycle | hgu133a2 | none | Cycle 1 |
| E-TABM-263-raw-cel-1515485811.cel | 9 | 6 | Cycle | hgu133a2 | none | Cycle 1 |
| E-TABM-263-raw-cel-1515485771.cel | 7 | 6 | Cycle | hgu133a2 | none | Cycle 1 |
| E-TABM-263-raw-cel-1515485891.cel | 13 | 6 | Cycle | hgu133a2 | none | Cycle 1 |
| E-TABM-263-raw-cel-1515486371.cel | 37 | 6 | Cycle | hgu133a2 | none | Cycle 1 |


© 2008-2010 Computational Biology Group, Department of Medical Genetics,
University of Lausanne, Switzerland