Previous module |
Next module
Module #866, TG: 2.4, TC: 1.8, 121 probes, 120 Entrez genes, 6 conditions


HELP
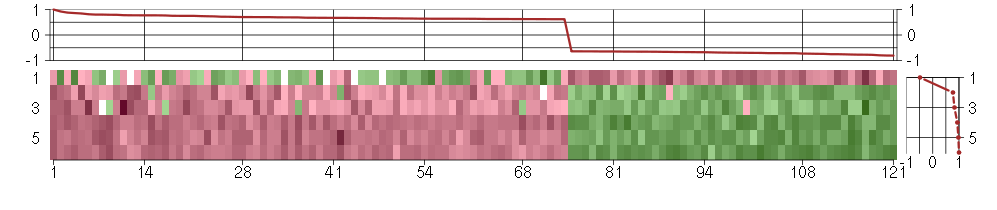
The image plot shows the color-coded level of gene expression, for the
genes and conditions in a given transcription module. The genes are on
the horizontal, the conditions on the vertical axis.
The genes are ordered according to their ISA gene scores, similarly
the conditions are ordered according to their condition scores. The
score of a gene means the «degree of inclusion» in
the module: a high score gene is essential in the module.
Condition scores can also be negative, that means that the genes of
the module are all down-regulated in the condition. Here the absolute
value of the score gives the «degree of inclusion».
The plots above and beside the expression matrix show the gene scores
and condition scores, respectively.
Note that the plot is interactive, you can see the name of the gene
and condition under the mouse cursor.
The expression matrix was normalized to have mean zero and standard
deviation one for every gene separately across all conditions
(i.e. not just for the conditions in the module).
— Click on the Help button again to close this help window.

Under-expression is coded with green,
over-expression with red color.
Help |
Hide |
Top
Help |
Show |
Top
The GO tree — Biological processes
HELP
This is one of three sections showing Gene Ontology enrichment of the
current module: in this case for biological processes.
The graph shows the hierarchy of the GO categories, their enrichment
for the current module is color coded, and the blue number beside the
category is the minus log ten p-value of the enrichment. (Calculated
using the standard hypergeometric test.) The color of the arrows code
«is a» (cyan) and «part of» relationships.
The tree was built the following way. First all GO terms with more
significant enrichment p-value than 0.05 were collected. Then all
paths from these terms to the root node of the GO tree were included
too. If a GO term is included more than once in the tree, then the
green numbers show 1) the id of the node, this makes it easier to find
other appereances of the term, and 2) the number of appearences.
Note that the same GO category might show up on the graph many
times. This is because the GO was «straightened» for this
graph, i.e. if there are more paths from a GO term to the root node of
the tree, all of them are included. The green numbers
Move the mouse cursor over the terms to get their definition. Clicking
on them takes you to the corresponding Gene Ontology web page.
If you cannot see a graph here at all, that means that there were no
significantly enriched GO categories, at the 0.05 level.
— Click on the Help button again to close this help window.
Help |
Hide |
Top
Help |
Show |
Top
The GO tree — Cellular Components
HELP
This is one of three sections showing Gene Ontology enrichment of the
current module: in this case for cellular components.
The graph shows the hierarchy of the GO categories, their enrichment
for the current module is color coded, and the blue number beside the
category is the minus log ten p-value of the enrichment. (Calculated
using the standard hypergeometric test.) The color of the arrows code
«is a» (cyan) and «part of» relationships.
The tree was built the following way. First all GO terms with more
significant enrichment p-value than 0.05 were collected. Then all
paths from these terms to the root node of the GO tree were included
too. If a GO term is included more than once in the tree, then the
green numbers show 1) the id of the node, this makes it easier to find
other appereances of the term, and 2) the number of appearences.
Note that the same GO category might show up on the graph many
times. This is because the GO was «straightened» for this
graph, i.e. if there are more paths from a GO term to the root node of
the tree, all of them are included. The green numbers
Move the mouse cursor over the terms to get their definition. Clicking
on them takes you to the corresponding Gene Ontology web page.
If you cannot see a graph here at all, that means that there were no
significantly enriched GO categories, at the 0.05 level.
— Click on the Help button again to close this help window.
Help |
Hide |
Top
Help |
Show |
Top
The GO tree — Molecular Function
HELP
This is one of three sections showing Gene Ontology enrichment of the
current module: in this case for molecular function.
The graph shows the hierarchy of the GO categories, their enrichment
for the current module is color coded, and the blue number beside the
category is the minus log ten p-value of the enrichment. (Calculated
using the standard hypergeometric test.) The color of the arrows code
«is a» (cyan) and «part of» relationships.
The tree was built the following way. First all GO terms with more
significant enrichment p-value than 0.05 were collected. Then all
paths from these terms to the root node of the GO tree were included
too. If a GO term is included more than once in the tree, then the
green numbers show 1) the id of the node, this makes it easier to find
other appereances of the term, and 2) the number of appearences.
Note that the same GO category might show up on the graph many
times. This is because the GO was «straightened» for this
graph, i.e. if there are more paths from a GO term to the root node of
the tree, all of them are included. The green numbers
Move the mouse cursor over the terms to get their definition. Clicking
on them takes you to the corresponding Gene Ontology web page.
If you cannot see a graph here at all, that means that there were no
significantly enriched GO categories, at the 0.05 level.
— Click on the Help button again to close this help window.
Help |
Hide |
Top
Help |
Show |
Top
GO BP test for over-representation
HELP
List of all enriched GO categories (biological processes), at the 0.05
p-value level.
The columns:
- ExpCount is the expected count of genes in the
module annotated with the given GO term, just by chance.
- Count
is the number of genes in the module annotated with the given GO
term.
- Size is the total number of genes (in our universe)
annotated with the GO term.
Clicking on Count shows the genes that drive the
enrichment. You can also click on the individual numbers in
the Count column, to show the driving genes for that individual
GO category.
Clicking on the GO identifiers takes you to the Gene Ontology web
pages.
— Click on the Help button again to close this help window.
| Id | Pvalue | ExpCount | Count | Size | Term |
| GO:0030511 | 1.328e-02 | 0.1126 | 3
CDKN1C, THBS1, TWSG1 | 9 | positive regulation of transforming growth factor beta receptor signaling pathway |
| GO:0042537 | 3.025e-02 | 0.03752 | 2
CYP1A2, KYNU | 3 | benzene and derivative metabolic process |
| GO:0043537 | 3.025e-02 | 0.03752 | 2
FGF2, THBS1 | 3 | negative regulation of blood vessel endothelial cell migration |
| GO:0043536 | 4.771e-02 | 0.05003 | 2
FGF2, THBS1 | 4 | positive regulation of blood vessel endothelial cell migration |
Help |
Hide |
Top
Help |
Show |
Top
GO CC test for over-representation
HELP
List of all enriched GO categories (cellular components), at the 0.05
p-value level.
The columns:
- ExpCount is the expected count of genes in the
module annotated with the given GO term, just by chance.
- Count
is the number of genes in the module annotated with the given GO
term.
- Size is the total number of genes (in our universe)
annotated with the GO term.
Clicking on Count shows the genes that drive the
enrichment. You can also click on the individual numbers in
the Count column, to show the driving genes for that individual
GO category.
Clicking on the GO identifiers takes you to the Gene Ontology web
pages.
— Click on the Help button again to close this help window.
| Id | Pvalue | ExpCount | Count | Size | Term |
| GO:0005576 | 2.162e-02 | 8.613 | 19
ASPN, CD248, COL11A1, CTSS, DKK1, FGF2, GPC1, GREM1, IL23A, ITFG1, LUM, PSG5, PSG9, SPINLW1, SULF1, THBS1, TWSG1, VEGFC, WFDC8 | 673 | extracellular region |
Help |
Hide |
Top
Help |
Show |
Top
GO MF test for over-representation
HELP
List of all enriched GO categories (molecular function), at the 0.05
p-value level.
The columns:
- ExpCount is the expected count of genes in the
module annotated with the given GO term, just by chance.
- Count
is the number of genes in the module annotated with the given GO
term.
- Size is the total number of genes (in our universe)
annotated with the GO term.
Clicking on Count shows the genes that drive the
enrichment. You can also click on the individual numbers in
the Count column, to show the driving genes for that individual
GO category.
Clicking on the GO identifiers takes you to the Gene Ontology web
pages.
— Click on the Help button again to close this help window.
Help |
Hide |
Top
Help |
Show |
Top
KEGG Pathway test for over-representation
HELP
List of all enriched KEGG pathways, at the 0.05
p-value level.
The columns:
- ExpCount is the expected count of genes in the
module annotated with the given KEGG pathway, just by chance.
- Count
is the number of genes in the module annotated with the given KEGG
pathway.
- Size is the total number of genes (in our universe)
annotated with the KEGG pathway.
Clicking on Count shows the genes that drive the
enrichment. You can also click on the individual numbers in
the Count column, to show the driving genes for that individual
KEGG pathway.
Clicking on the KEGG identifiers takes you to the KEGG web site.
— Click on the Help button again to close this help window.
Help |
Hide |
Top
Help |
Show |
Top
miRNA test for over-representation
HELP
List of all enriched miRNA families, at the 0.05
p-value level.
The columns:
- ExpCount is the expected count of genes in the
module regulated by the given miRNA family, just by chance.
- Count
is the number of genes in the module regulated by the given miRNA
family.
- Size is the total number of genes (in our universe)
regulated with the given miRNA family.
Clicking on Count shows the genes that drive the
enrichment. You can also click on the individual numbers in
the Count column, to show the driving genes for that individual
miRNA family.
The miRNA regulation data was taken from the TargetScan database.
(Only the conserved sites were used for the current analysis.)
Clicking on the miRNA names takes you to the TargetScan web site.
— Click on the Help button again to close this help window.
Help |
Hide |
Top
Help |
Show |
Top
Chromosome test for over-representation
HELP
List of all enriched Chromosomes, at the 0.05
p-value level.
The columns:
- ExpCount is the expected number of genes in the
module on the given chromosome, just by chance.
- Count
is the number of genes in the module on the given chromosome.
- Size is the total number of genes (in our universe)
on the given chromosome.
Clicking on Count shows the genes that drive the
enrichment. You can also click on the individual numbers in
the Count column, to show the driving genes for that individual
chromosome.
— Click on the Help button again to close this help window.
HELP
A list of all genes in the current module, in alphabetical order. The
size of the text corresponds to the gene scores.
Note that some gene symbols may show up more than once, if many
probes match the same Entrez gene.
Genes with no Entrez mapping are given separately, with their
Affymetrics probe ID.
— Click on the Help button again to close this help window.
Entrez genes
ABAT4-aminobutyrate aminotransferase (209459_s_at), score: 0.62
ABCB6ATP-binding cassette, sub-family B (MDR/TAP), member 6 (203192_at), score: -0.77
ACTR5ARP5 actin-related protein 5 homolog (yeast) (219623_at), score: -0.71
ALDH1A1aldehyde dehydrogenase 1 family, member A1 (212224_at), score: 0.69
ALDH7A1aldehyde dehydrogenase 7 family, member A1 (208951_at), score: 0.75
ASPNasporin (219087_at), score: 0.73
ATP2B4ATPase, Ca++ transporting, plasma membrane 4 (212135_s_at), score: 0.65
C10orf116chromosome 10 open reading frame 116 (203571_s_at), score: 0.68
C19orf40chromosome 19 open reading frame 40 (214816_x_at), score: -0.65
C7orf58chromosome 7 open reading frame 58 (220032_at), score: 0.77
CAPN1calpain 1, (mu/I) large subunit (200752_s_at), score: 0.62
CAPNS1calpain, small subunit 1 (200001_at), score: 0.69
CD248CD248 molecule, endosialin (219025_at), score: 0.74
CDKN1Ccyclin-dependent kinase inhibitor 1C (p57, Kip2) (213183_s_at), score: -0.7
CELSR3cadherin, EGF LAG seven-pass G-type receptor 3 (flamingo homolog, Drosophila) (40020_at), score: -0.71
CHN1chimerin (chimaerin) 1 (212624_s_at), score: 0.67
CITED2Cbp/p300-interacting transactivator, with Glu/Asp-rich carboxy-terminal domain, 2 (207980_s_at), score: 0.68
COL11A1collagen, type XI, alpha 1 (37892_at), score: 0.75
CTSScathepsin S (202901_x_at), score: -0.77
CYP1A2cytochrome P450, family 1, subfamily A, polypeptide 2 (207608_x_at), score: -0.71
DAB2disabled homolog 2, mitogen-responsive phosphoprotein (Drosophila) (201279_s_at), score: 0.73
DBTdihydrolipoamide branched chain transacylase E2 (205370_x_at), score: -0.65
DDAH1dimethylarginine dimethylaminohydrolase 1 (209094_at), score: 0.65
DGCR2DiGeorge syndrome critical region gene 2 (214198_s_at), score: -0.66
DGKAdiacylglycerol kinase, alpha 80kDa (203385_at), score: 0.65
DKFZp547G183hypothetical LOC55525 (220572_at), score: -0.65
DKFZP586I1420hypothetical protein DKFZp586I1420 (213546_at), score: -0.64
DKK1dickkopf homolog 1 (Xenopus laevis) (204602_at), score: 0.63
DNASE1L1deoxyribonuclease I-like 1 (203912_s_at), score: 0.63
DRAMdamage-regulated autophagy modulator (218627_at), score: 0.67
EVI2Aecotropic viral integration site 2A (204774_at), score: -0.65
F3coagulation factor III (thromboplastin, tissue factor) (204363_at), score: 0.7
FAM106Afamily with sequence similarity 106, member A (220575_at), score: -0.76
FAM46Cfamily with sequence similarity 46, member C (220306_at), score: 0.67
FAM65Bfamily with sequence similarity 65, member B (209829_at), score: 1
FGF2fibroblast growth factor 2 (basic) (204421_s_at), score: 0.75
GFRA1GDNF family receptor alpha 1 (205696_s_at), score: 0.8
GIPC2GIPC PDZ domain containing family, member 2 (219970_at), score: 0.62
GLSglutaminase (203159_at), score: 0.79
GLT8D2glycosyltransferase 8 domain containing 2 (221447_s_at), score: 0.64
GPC1glypican 1 (202756_s_at), score: 0.77
GRAMD3GRAM domain containing 3 (218706_s_at), score: 0.92
GREM1gremlin 1, cysteine knot superfamily, homolog (Xenopus laevis) (218469_at), score: 0.79
HERC4hect domain and RLD 4 (208055_s_at), score: 0.64
HEY1hairy/enhancer-of-split related with YRPW motif 1 (44783_s_at), score: -0.71
HOOK1hook homolog 1 (Drosophila) (219976_at), score: -0.69
HSPA2heat shock 70kDa protein 2 (211538_s_at), score: 0.69
IL1RAPL1interleukin 1 receptor accessory protein-like 1 (220663_at), score: -0.67
IL23Ainterleukin 23, alpha subunit p19 (211796_s_at), score: 0.77
INAinternexin neuronal intermediate filament protein, alpha (204465_s_at), score: 0.62
ITFG1integrin alpha FG-GAP repeat containing 1 (221449_s_at), score: 0.64
ITGA4integrin, alpha 4 (antigen CD49D, alpha 4 subunit of VLA-4 receptor) (213416_at), score: 0.8
KHDRBS3KH domain containing, RNA binding, signal transduction associated 3 (209781_s_at), score: 0.72
KIAA0894KIAA0894 protein (207436_x_at), score: -0.66
KIAA1305KIAA1305 (220911_s_at), score: 0.7
KRT34keratin 34 (206969_at), score: 0.66
KRTAP1-1keratin associated protein 1-1 (220976_s_at), score: 0.78
KYNUkynureninase (L-kynurenine hydrolase) (217388_s_at), score: -0.77
LIMA1LIM domain and actin binding 1 (217892_s_at), score: 0.62
LMO7LIM domain 7 (202674_s_at), score: 0.7
LOC100170939glucuronidase, beta pseudogene (214850_at), score: -0.7
LOC440354PI-3-kinase-related kinase SMG-1 pseudogene (210396_s_at), score: -0.69
LOC647070hypothetical LOC647070 (215467_x_at), score: -0.65
LRRC1leucine rich repeat containing 1 (218816_at), score: 0.77
LUMlumican (201744_s_at), score: 0.7
MADCAM1mucosal vascular addressin cell adhesion molecule 1 (208037_s_at), score: -0.7
MAP2K7mitogen-activated protein kinase kinase 7 (216206_x_at), score: -0.75
MEIS2Meis homeobox 2 (207480_s_at), score: 0.68
METTL7Amethyltransferase like 7A (211424_x_at), score: -0.68
MOGmyelin oligodendrocyte glycoprotein (214650_x_at), score: -0.66
MPPED2metallophosphoesterase domain containing 2 (205413_at), score: -0.8
MYL9myosin, light chain 9, regulatory (201058_s_at), score: 0.67
NEK7NIMA (never in mitosis gene a)-related kinase 7 (212530_at), score: 0.63
NLGN1neuroligin 1 (205893_at), score: 0.63
OXTRoxytocin receptor (206825_at), score: 0.86
PDE4Cphosphodiesterase 4C, cAMP-specific (phosphodiesterase E1 dunce homolog, Drosophila) (206792_x_at), score: -0.64
PDLIM1PDZ and LIM domain 1 (208690_s_at), score: 0.71
POLR1Bpolymerase (RNA) I polypeptide B, 128kDa (220113_x_at), score: -0.73
PSG5pregnancy specific beta-1-glycoprotein 5 (204830_x_at), score: 0.7
PSG9pregnancy specific beta-1-glycoprotein 9 (209594_x_at), score: 0.63
PTPLBprotein tyrosine phosphatase-like (proline instead of catalytic arginine), member b (212640_at), score: 0.64
RIPK4receptor-interacting serine-threonine kinase 4 (221215_s_at), score: -0.65
RPL21P68ribosomal protein L21 pseudogene 68 (217340_at), score: -0.78
RPL35Aribosomal protein L35a (215208_x_at), score: -0.64
SDC3syndecan 3 (202898_at), score: 0.77
SEPT2septin 2 (200778_s_at), score: 0.62
SERPINB7serpin peptidase inhibitor, clade B (ovalbumin), member 7 (206421_s_at), score: 0.88
SH2D3ASH2 domain containing 3A (222169_x_at), score: -0.67
SH3BGRL3SH3 domain binding glutamic acid-rich protein like 3 (221269_s_at), score: 0.64
SLC25A13solute carrier family 25, member 13 (citrin) (203775_at), score: -0.69
SLC38A4solute carrier family 38, member 4 (220786_s_at), score: 0.69
SLC48A1solute carrier family 48 (heme transporter), member 1 (218417_s_at), score: 0.64
SMA5glucuronidase, beta pseudogene (215043_s_at), score: -0.73
SPAM1sperm adhesion molecule 1 (PH-20 hyaluronidase, zona pellucida binding) (216989_at), score: -0.68
SPATA20spermatogenesis associated 20 (218164_at), score: 0.84
SPG21spastic paraplegia 21 (autosomal recessive, Mast syndrome) (215383_x_at), score: -0.64
SPINLW1serine peptidase inhibitor-like, with Kunitz and WAP domains 1 (eppin) (206318_at), score: -0.71
STMN2stathmin-like 2 (203000_at), score: 0.75
STSsteroid sulfatase (microsomal), isozyme S (203767_s_at), score: 0.65
SULF1sulfatase 1 (212353_at), score: 0.67
TAGLNtransgelin (205547_s_at), score: 0.67
THBS1thrombospondin 1 (201109_s_at), score: 0.64
TIGD1Ltigger transposable element derived 1-like (216459_x_at), score: -0.81
TLE4transducin-like enhancer of split 4 (E(sp1) homolog, Drosophila) (204872_at), score: 0.72
TMEM30Atransmembrane protein 30A (217743_s_at), score: 0.62
TP53I3tumor protein p53 inducible protein 3 (210609_s_at), score: 0.65
TSPYL5TSPY-like 5 (213122_at), score: 0.64
TUBB6tubulin, beta 6 (209191_at), score: 0.66
TWSG1twisted gastrulation homolog 1 (Drosophila) (219201_s_at), score: 0.64
UBQLN4ubiquilin 4 (222252_x_at), score: -0.67
UCP2uncoupling protein 2 (mitochondrial, proton carrier) (208998_at), score: 0.81
VEGFCvascular endothelial growth factor C (209946_at), score: 0.63
VEZTvezatin, adherens junctions transmembrane protein (207263_x_at), score: -0.7
VGLL3vestigial like 3 (Drosophila) (220327_at), score: 0.77
WFDC8WAP four-disulfide core domain 8 (215276_at), score: -0.74
XRCC2X-ray repair complementing defective repair in Chinese hamster cells 2 (207598_x_at), score: -0.74
ZC3H7Bzinc finger CCCH-type containing 7B (206169_x_at), score: -0.8
ZNF160zinc finger protein 160 (214715_x_at), score: -0.67
ZNF212zinc finger protein 212 (203985_at), score: -0.65
ZNF267zinc finger protein 267 (219540_at), score: -0.64
Non-Entrez genes
214198_s_atUnknown, score: -0.75
HELP
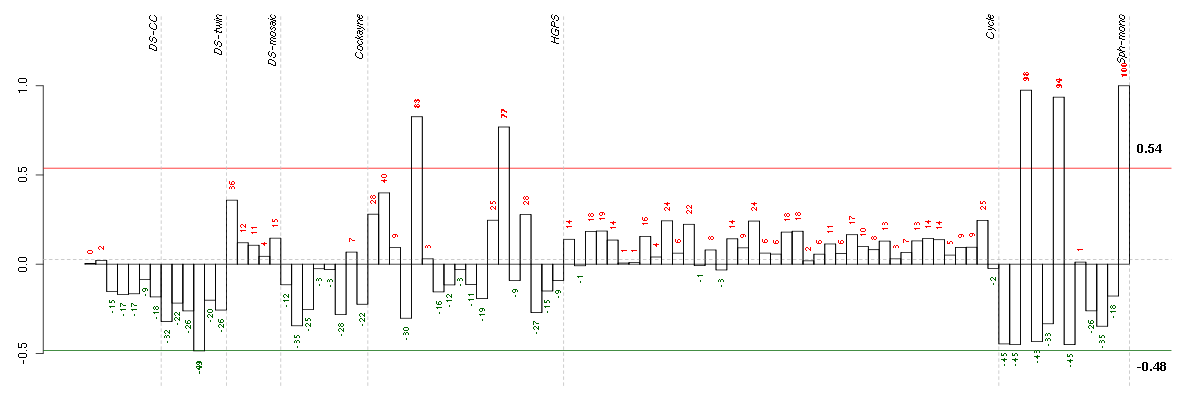
Conditions in the module, given in the same order as on the expression
plot above. Red color means over-expression, green under-expression in
the given condition.
The barplot below shows the condition (sample) scores. A separate bar
is shown for each sample, its height is the corresponding score of the
sample in the module. The red and green numbers on the bars are the
sample scores expressed in percents, i.e. 100% is 1.0.
The red and green lines show the module thresholds, samples above
the red line and below the green line are included in the module.
The different experiments that were part of the study, are separated
by dashed vertical lines.
— Click on the Help button again to close this help window.
| Id | sample | Experiment | ExpName | Array | Syndrome | Cell.line |
| 4Twin.CEL | 4 | 2 | DS-twin | hgu133plus2 | none | DS-twin 4 |
| E-GEOD-3860-raw-cel-1561690376.cel | 13 | 5 | HGPS | hgu133a | HGPS | AG11513 |
| E-GEOD-3860-raw-cel-1561690248.cel | 5 | 5 | HGPS | hgu133a | HGPS | AG11513 |
| E-GEOD-4219-raw-cel-1311956358.cel | 10 | 7 | Sph-mono | hgu133plus2 | none | Sph-mon 1 |
| E-GEOD-4219-raw-cel-1311956178.cel | 6 | 7 | Sph-mono | hgu133plus2 | none | Sph-mon 1 |
| E-GEOD-4219-raw-cel-1311956824.cel | 24 | 7 | Sph-mono | hgu133plus2 | none | Sph-mon 1 |


© 2008-2010 Computational Biology Group, Department of Medical Genetics,
University of Lausanne, Switzerland