
The image plot shows the color-coded level of gene expression, for the genes and conditions in a given transcription module. The genes are on the horizontal, the conditions on the vertical axis.
The genes are ordered according to their ISA gene scores, similarly the conditions are ordered according to their condition scores. The score of a gene means the «degree of inclusion» in the module: a high score gene is essential in the module.
Condition scores can also be negative, that means that the genes of the module are all down-regulated in the condition. Here the absolute value of the score gives the «degree of inclusion».
The plots above and beside the expression matrix show the gene scores and condition scores, respectively.
Note that the plot is interactive, you can see the name of the gene and condition under the mouse cursor.
The expression matrix was normalized to have mean zero and standard deviation one for every gene separately across all conditions (i.e. not just for the conditions in the module).
— Click on the Help button again to close this help window.
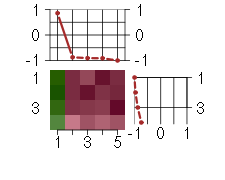

Under-expression is coded with green,
over-expression with red color.
This is one of three sections showing Gene Ontology enrichment of the current module: in this case for biological processes.
The graph shows the hierarchy of the GO categories, their enrichment for the current module is color coded, and the blue number beside the category is the minus log ten p-value of the enrichment. (Calculated using the standard hypergeometric test.) The color of the arrows code «is a» (cyan) and «part of» relationships.
The tree was built the following way. First all GO terms with more significant enrichment p-value than 0.05 were collected. Then all paths from these terms to the root node of the GO tree were included too. If a GO term is included more than once in the tree, then the green numbers show 1) the id of the node, this makes it easier to find other appereances of the term, and 2) the number of appearences.
Note that the same GO category might show up on the graph many times. This is because the GO was «straightened» for this graph, i.e. if there are more paths from a GO term to the root node of the tree, all of them are included. The green numbers
Move the mouse cursor over the terms to get their definition. Clicking on them takes you to the corresponding Gene Ontology web page.
If you cannot see a graph here at all, that means that there were no significantly enriched GO categories, at the 0.05 level.
— Click on the Help button again to close this help window.

This is one of three sections showing Gene Ontology enrichment of the current module: in this case for cellular components.
The graph shows the hierarchy of the GO categories, their enrichment for the current module is color coded, and the blue number beside the category is the minus log ten p-value of the enrichment. (Calculated using the standard hypergeometric test.) The color of the arrows code «is a» (cyan) and «part of» relationships.
The tree was built the following way. First all GO terms with more significant enrichment p-value than 0.05 were collected. Then all paths from these terms to the root node of the GO tree were included too. If a GO term is included more than once in the tree, then the green numbers show 1) the id of the node, this makes it easier to find other appereances of the term, and 2) the number of appearences.
Note that the same GO category might show up on the graph many times. This is because the GO was «straightened» for this graph, i.e. if there are more paths from a GO term to the root node of the tree, all of them are included. The green numbers
Move the mouse cursor over the terms to get their definition. Clicking on them takes you to the corresponding Gene Ontology web page.
If you cannot see a graph here at all, that means that there were no significantly enriched GO categories, at the 0.05 level.
— Click on the Help button again to close this help window.
This is one of three sections showing Gene Ontology enrichment of the current module: in this case for molecular function.
The graph shows the hierarchy of the GO categories, their enrichment for the current module is color coded, and the blue number beside the category is the minus log ten p-value of the enrichment. (Calculated using the standard hypergeometric test.) The color of the arrows code «is a» (cyan) and «part of» relationships.
The tree was built the following way. First all GO terms with more significant enrichment p-value than 0.05 were collected. Then all paths from these terms to the root node of the GO tree were included too. If a GO term is included more than once in the tree, then the green numbers show 1) the id of the node, this makes it easier to find other appereances of the term, and 2) the number of appearences.
Note that the same GO category might show up on the graph many times. This is because the GO was «straightened» for this graph, i.e. if there are more paths from a GO term to the root node of the tree, all of them are included. The green numbers
Move the mouse cursor over the terms to get their definition. Clicking on them takes you to the corresponding Gene Ontology web page.
If you cannot see a graph here at all, that means that there were no significantly enriched GO categories, at the 0.05 level.
— Click on the Help button again to close this help window.
List of all enriched GO categories (biological processes), at the 0.05 p-value level.
The columns:
Clicking on Count shows the genes that drive the enrichment. You can also click on the individual numbers in the Count column, to show the driving genes for that individual GO category.
Clicking on the GO identifiers takes you to the Gene Ontology web pages.
— Click on the Help button again to close this help window.
List of all enriched GO categories (cellular components), at the 0.05 p-value level.
The columns:
Clicking on Count shows the genes that drive the enrichment. You can also click on the individual numbers in the Count column, to show the driving genes for that individual GO category.
Clicking on the GO identifiers takes you to the Gene Ontology web pages.
— Click on the Help button again to close this help window.
| Id | Pvalue | ExpCount | Count | Size | Term |
|---|---|---|---|---|---|
| GO:0070195 | 1.747e-02 | 0.0006307 | 1 GHR | 1 | growth hormone receptor complex |
List of all enriched GO categories (molecular function), at the 0.05 p-value level.
The columns:
Clicking on Count shows the genes that drive the enrichment. You can also click on the individual numbers in the Count column, to show the driving genes for that individual GO category.
Clicking on the GO identifiers takes you to the Gene Ontology web pages.
— Click on the Help button again to close this help window.
List of all enriched KEGG pathways, at the 0.05 p-value level.
The columns:
Clicking on Count shows the genes that drive the enrichment. You can also click on the individual numbers in the Count column, to show the driving genes for that individual KEGG pathway.
Clicking on the KEGG identifiers takes you to the KEGG web site.
— Click on the Help button again to close this help window.
List of all enriched miRNA families, at the 0.05 p-value level.
The columns:
Clicking on Count shows the genes that drive the enrichment. You can also click on the individual numbers in the Count column, to show the driving genes for that individual miRNA family.
The miRNA regulation data was taken from the TargetScan database. (Only the conserved sites were used for the current analysis.) Clicking on the miRNA names takes you to the TargetScan web site.
— Click on the Help button again to close this help window.
List of all enriched Chromosomes, at the 0.05 p-value level.
The columns:
Clicking on Count shows the genes that drive the enrichment. You can also click on the individual numbers in the Count column, to show the driving genes for that individual chromosome.
— Click on the Help button again to close this help window.
A list of all genes in the current module, in alphabetical order. The size of the text corresponds to the gene scores.
Note that some gene symbols may show up more than once, if many probes match the same Entrez gene.
Genes with no Entrez mapping are given separately, with their Affymetrics probe ID.
— Click on the Help button again to close this help window.
CRTC3CREB regulated transcription coactivator 3 (218648_at), score: 0.86 EAF2ELL associated factor 2 (219551_at), score: -0.87 GHRgrowth hormone receptor (205498_at), score: -0.91 KAL1Kallmann syndrome 1 sequence (205206_at), score: -1 PCDH9protocadherin 9 (219737_s_at), score: -0.91
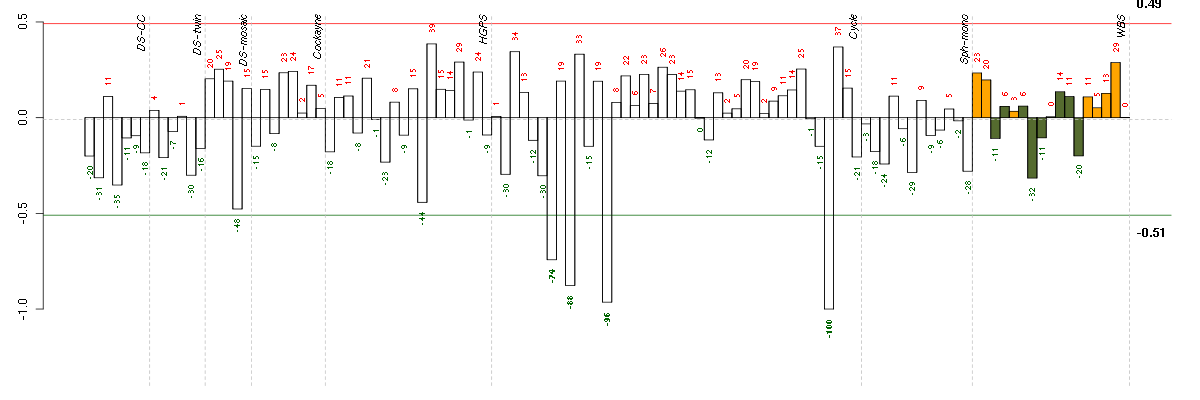
Conditions in the module, given in the same order as on the expression plot above. Red color means over-expression, green under-expression in the given condition.
The barplot below shows the condition (sample) scores. A separate bar is shown for each sample, its height is the corresponding score of the sample in the module. The red and green numbers on the bars are the sample scores expressed in percents, i.e. 100% is 1.0.
The red and green lines show the module thresholds, samples above the red line and below the green line are included in the module.
The different experiments that were part of the study, are separated by dashed vertical lines.
— Click on the Help button again to close this help window.
| Id | sample | Experiment | ExpName | Array | Syndrome | Cell.line |
|---|---|---|---|---|---|---|
| E-TABM-263-raw-cel-1515486371.cel | 37 | 6 | Cycle | hgu133a2 | none | Cycle 1 |
| E-TABM-263-raw-cel-1515485891.cel | 13 | 6 | Cycle | hgu133a2 | none | Cycle 1 |
| E-TABM-263-raw-cel-1515485811.cel | 9 | 6 | Cycle | hgu133a2 | none | Cycle 1 |
| E-TABM-263-raw-cel-1515485771.cel | 7 | 6 | Cycle | hgu133a2 | none | Cycle 1 |
![]()

