Previous module |
Next module
Module #413, TG: 3.2, TC: 2, 90 probes, 90 Entrez genes, 3 conditions


HELP
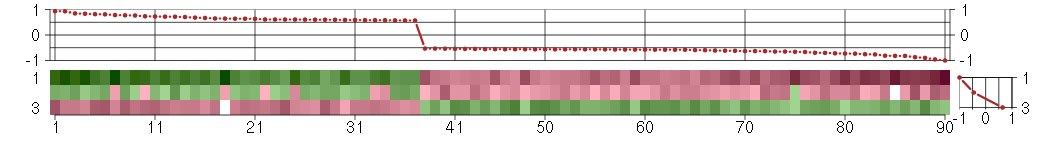
The image plot shows the color-coded level of gene expression, for the
genes and conditions in a given transcription module. The genes are on
the horizontal, the conditions on the vertical axis.
The genes are ordered according to their ISA gene scores, similarly
the conditions are ordered according to their condition scores. The
score of a gene means the «degree of inclusion» in
the module: a high score gene is essential in the module.
Condition scores can also be negative, that means that the genes of
the module are all down-regulated in the condition. Here the absolute
value of the score gives the «degree of inclusion».
The plots above and beside the expression matrix show the gene scores
and condition scores, respectively.
Note that the plot is interactive, you can see the name of the gene
and condition under the mouse cursor.
The expression matrix was normalized to have mean zero and standard
deviation one for every gene separately across all conditions
(i.e. not just for the conditions in the module).
— Click on the Help button again to close this help window.

Under-expression is coded with green,
over-expression with red color.
Help |
Hide |
Top
Help |
Show |
Top
The GO tree — Biological processes
HELP
This is one of three sections showing Gene Ontology enrichment of the
current module: in this case for biological processes.
The graph shows the hierarchy of the GO categories, their enrichment
for the current module is color coded, and the blue number beside the
category is the minus log ten p-value of the enrichment. (Calculated
using the standard hypergeometric test.) The color of the arrows code
«is a» (cyan) and «part of» relationships.
The tree was built the following way. First all GO terms with more
significant enrichment p-value than 0.05 were collected. Then all
paths from these terms to the root node of the GO tree were included
too. If a GO term is included more than once in the tree, then the
green numbers show 1) the id of the node, this makes it easier to find
other appereances of the term, and 2) the number of appearences.
Note that the same GO category might show up on the graph many
times. This is because the GO was «straightened» for this
graph, i.e. if there are more paths from a GO term to the root node of
the tree, all of them are included. The green numbers
Move the mouse cursor over the terms to get their definition. Clicking
on them takes you to the corresponding Gene Ontology web page.
If you cannot see a graph here at all, that means that there were no
significantly enriched GO categories, at the 0.05 level.
— Click on the Help button again to close this help window.

Help |
Hide |
Top
Help |
Show |
Top
The GO tree — Cellular Components
HELP
This is one of three sections showing Gene Ontology enrichment of the
current module: in this case for cellular components.
The graph shows the hierarchy of the GO categories, their enrichment
for the current module is color coded, and the blue number beside the
category is the minus log ten p-value of the enrichment. (Calculated
using the standard hypergeometric test.) The color of the arrows code
«is a» (cyan) and «part of» relationships.
The tree was built the following way. First all GO terms with more
significant enrichment p-value than 0.05 were collected. Then all
paths from these terms to the root node of the GO tree were included
too. If a GO term is included more than once in the tree, then the
green numbers show 1) the id of the node, this makes it easier to find
other appereances of the term, and 2) the number of appearences.
Note that the same GO category might show up on the graph many
times. This is because the GO was «straightened» for this
graph, i.e. if there are more paths from a GO term to the root node of
the tree, all of them are included. The green numbers
Move the mouse cursor over the terms to get their definition. Clicking
on them takes you to the corresponding Gene Ontology web page.
If you cannot see a graph here at all, that means that there were no
significantly enriched GO categories, at the 0.05 level.
— Click on the Help button again to close this help window.
extracellular region
The space external to the outermost structure of a cell. For cells without external protective or external encapsulating structures this refers to space outside of the plasma membrane. This term covers the host cell environment outside an intracellular parasite.
cellular_component
The part of a cell or its extracellular environment in which a gene product is located. A gene product may be located in one or more parts of a cell and its location may be as specific as a particular macromolecular complex, that is, a stable, persistent association of macromolecules that function together.
all
This term is the most general term possible
Help |
Hide |
Top
Help |
Show |
Top
The GO tree — Molecular Function
HELP
This is one of three sections showing Gene Ontology enrichment of the
current module: in this case for molecular function.
The graph shows the hierarchy of the GO categories, their enrichment
for the current module is color coded, and the blue number beside the
category is the minus log ten p-value of the enrichment. (Calculated
using the standard hypergeometric test.) The color of the arrows code
«is a» (cyan) and «part of» relationships.
The tree was built the following way. First all GO terms with more
significant enrichment p-value than 0.05 were collected. Then all
paths from these terms to the root node of the GO tree were included
too. If a GO term is included more than once in the tree, then the
green numbers show 1) the id of the node, this makes it easier to find
other appereances of the term, and 2) the number of appearences.
Note that the same GO category might show up on the graph many
times. This is because the GO was «straightened» for this
graph, i.e. if there are more paths from a GO term to the root node of
the tree, all of them are included. The green numbers
Move the mouse cursor over the terms to get their definition. Clicking
on them takes you to the corresponding Gene Ontology web page.
If you cannot see a graph here at all, that means that there were no
significantly enriched GO categories, at the 0.05 level.
— Click on the Help button again to close this help window.
Help |
Hide |
Top
Help |
Show |
Top
GO BP test for over-representation
HELP
List of all enriched GO categories (biological processes), at the 0.05
p-value level.
The columns:
- ExpCount is the expected count of genes in the
module annotated with the given GO term, just by chance.
- Count
is the number of genes in the module annotated with the given GO
term.
- Size is the total number of genes (in our universe)
annotated with the GO term.
Clicking on Count shows the genes that drive the
enrichment. You can also click on the individual numbers in
the Count column, to show the driving genes for that individual
GO category.
Clicking on the GO identifiers takes you to the Gene Ontology web
pages.
— Click on the Help button again to close this help window.
| Id | Pvalue | ExpCount | Count | Size | Term |
| GO:0006353 | 4.868e-02 | 0.05003 | 2
MAZ, PTRF | 5 | transcription termination |
Help |
Hide |
Top
Help |
Show |
Top
GO CC test for over-representation
HELP
List of all enriched GO categories (cellular components), at the 0.05
p-value level.
The columns:
- ExpCount is the expected count of genes in the
module annotated with the given GO term, just by chance.
- Count
is the number of genes in the module annotated with the given GO
term.
- Size is the total number of genes (in our universe)
annotated with the GO term.
Clicking on Count shows the genes that drive the
enrichment. You can also click on the individual numbers in
the Count column, to show the driving genes for that individual
GO category.
Clicking on the GO identifiers takes you to the Gene Ontology web
pages.
— Click on the Help button again to close this help window.
| Id | Pvalue | ExpCount | Count | Size | Term |
| GO:0005576 | 1.921e-03 | 7.064 | 19
ADAMTS12, BCHE, CA11, CFB, CFI, EDN1, EGF, FN1, GPC4, GPX3, HAPLN1, INHBE, MFAP4, OLR1, PAPPA2, PTGDS, SCG2, SERPINI1, SNCA | 700 | extracellular region |
Help |
Hide |
Top
Help |
Show |
Top
GO MF test for over-representation
HELP
List of all enriched GO categories (molecular function), at the 0.05
p-value level.
The columns:
- ExpCount is the expected count of genes in the
module annotated with the given GO term, just by chance.
- Count
is the number of genes in the module annotated with the given GO
term.
- Size is the total number of genes (in our universe)
annotated with the GO term.
Clicking on Count shows the genes that drive the
enrichment. You can also click on the individual numbers in
the Count column, to show the driving genes for that individual
GO category.
Clicking on the GO identifiers takes you to the Gene Ontology web
pages.
— Click on the Help button again to close this help window.
Help |
Hide |
Top
Help |
Show |
Top
KEGG Pathway test for over-representation
HELP
List of all enriched KEGG pathways, at the 0.05
p-value level.
The columns:
- ExpCount is the expected count of genes in the
module annotated with the given KEGG pathway, just by chance.
- Count
is the number of genes in the module annotated with the given KEGG
pathway.
- Size is the total number of genes (in our universe)
annotated with the KEGG pathway.
Clicking on Count shows the genes that drive the
enrichment. You can also click on the individual numbers in
the Count column, to show the driving genes for that individual
KEGG pathway.
Clicking on the KEGG identifiers takes you to the KEGG web site.
— Click on the Help button again to close this help window.
Help |
Hide |
Top
Help |
Show |
Top
miRNA test for over-representation
HELP
List of all enriched miRNA families, at the 0.05
p-value level.
The columns:
- ExpCount is the expected count of genes in the
module regulated by the given miRNA family, just by chance.
- Count
is the number of genes in the module regulated by the given miRNA
family.
- Size is the total number of genes (in our universe)
regulated with the given miRNA family.
Clicking on Count shows the genes that drive the
enrichment. You can also click on the individual numbers in
the Count column, to show the driving genes for that individual
miRNA family.
The miRNA regulation data was taken from the TargetScan database.
(Only the conserved sites were used for the current analysis.)
Clicking on the miRNA names takes you to the TargetScan web site.
— Click on the Help button again to close this help window.
Help |
Hide |
Top
Help |
Show |
Top
Chromosome test for over-representation
HELP
List of all enriched Chromosomes, at the 0.05
p-value level.
The columns:
- ExpCount is the expected number of genes in the
module on the given chromosome, just by chance.
- Count
is the number of genes in the module on the given chromosome.
- Size is the total number of genes (in our universe)
on the given chromosome.
Clicking on Count shows the genes that drive the
enrichment. You can also click on the individual numbers in
the Count column, to show the driving genes for that individual
chromosome.
— Click on the Help button again to close this help window.
HELP
A list of all genes in the current module, in alphabetical order. The
size of the text corresponds to the gene scores.
Note that some gene symbols may show up more than once, if many
probes match the same Entrez gene.
Genes with no Entrez mapping are given separately, with their
Affymetrics probe ID.
— Click on the Help button again to close this help window.
Entrez genes
ABHD2abhydrolase domain containing 2 (63825_at), score: -0.55
ADAMTS12ADAM metallopeptidase with thrombospondin type 1 motif, 12 (221421_s_at), score: -0.81
ARHGDIARho GDP dissociation inhibitor (GDI) alpha (213606_s_at), score: -0.56
B9D1B9 protein domain 1 (210534_s_at), score: 0.63
BAT2D1BAT2 domain containing 1 (211947_s_at), score: -0.58
BCHEbutyrylcholinesterase (205433_at), score: -0.87
BTRCbeta-transducin repeat containing (216091_s_at), score: -0.57
C10orf10chromosome 10 open reading frame 10 (209182_s_at), score: -0.65
C11orf41chromosome 11 open reading frame 41 (214772_at), score: -0.59
C1orf38chromosome 1 open reading frame 38 (207571_x_at), score: 0.6
C21orf7chromosome 21 open reading frame 7 (221211_s_at), score: -0.63
CA11carbonic anhydrase XI (209726_at), score: 0.61
CASP1caspase 1, apoptosis-related cysteine peptidase (interleukin 1, beta, convertase) (211368_s_at), score: 0.65
CFBcomplement factor B (202357_s_at), score: 0.64
CFIcomplement factor I (203854_at), score: 0.94
CMAHcytidine monophosphate-N-acetylneuraminic acid hydroxylase (CMP-N-acetylneuraminate monooxygenase) pseudogene (205518_s_at), score: -0.58
CYTH3cytohesin 3 (206523_at), score: -0.63
CYTIPcytohesin 1 interacting protein (209606_at), score: -0.96
DHX9DEAH (Asp-Glu-Ala-His) box polypeptide 9 (212105_s_at), score: -0.56
DKFZp434H1419hypothetical protein DKFZp434H1419 (214717_at), score: -0.56
DOPEY2dopey family member 2 (205248_at), score: -0.56
DSC2desmocollin 2 (204751_x_at), score: -0.7
ECHDC2enoyl Coenzyme A hydratase domain containing 2 (218552_at), score: 0.68
EDN1endothelin 1 (218995_s_at), score: -0.58
EGFepidermal growth factor (beta-urogastrone) (206254_at), score: 0.77
ELOVL2elongation of very long chain fatty acids (FEN1/Elo2, SUR4/Elo3, yeast)-like 2 (213712_at), score: 0.85
FAM155Afamily with sequence similarity 155, member A (214825_at), score: -0.56
FGFR3fibroblast growth factor receptor 3 (204379_s_at), score: 0.59
FN1fibronectin 1 (214701_s_at), score: -0.57
FOSv-fos FBJ murine osteosarcoma viral oncogene homolog (209189_at), score: 0.78
GABPAGA binding protein transcription factor, alpha subunit 60kDa (210188_at), score: -0.53
GCH1GTP cyclohydrolase 1 (204224_s_at), score: 0.72
GGT1gamma-glutamyltransferase 1 (209919_x_at), score: 0.61
GPC4glypican 4 (204983_s_at), score: 0.82
GPX3glutathione peroxidase 3 (plasma) (214091_s_at), score: -0.55
HAPLN1hyaluronan and proteoglycan link protein 1 (205523_at), score: -0.65
HHEXhematopoietically expressed homeobox (215933_s_at), score: 0.72
HOXB9homeobox B9 (216417_x_at), score: -1
INHBEinhibin, beta E (210587_at), score: 0.81
KCNN2potassium intermediate/small conductance calcium-activated channel, subfamily N, member 2 (220116_at), score: -0.75
KCTD20potassium channel tetramerisation domain containing 20 (214849_at), score: -0.56
LATS1LATS, large tumor suppressor, homolog 1 (Drosophila) (219813_at), score: -0.66
LOC730092RRN3 RNA polymerase I transcription factor homolog (S. cerevisiae) pseudogene (216908_x_at), score: -0.57
LRRN3leucine rich repeat neuronal 3 (209841_s_at), score: -0.62
MACROD1MACRO domain containing 1 (219188_s_at), score: 0.64
MALLmal, T-cell differentiation protein-like (209373_at), score: 0.57
MAXMYC associated factor X (210734_x_at), score: -0.57
MAZMYC-associated zinc finger protein (purine-binding transcription factor) (207824_s_at), score: -0.56
ME3malic enzyme 3, NADP(+)-dependent, mitochondrial (204663_at), score: 0.61
MFAP4microfibrillar-associated protein 4 (212713_at), score: 0.61
MFN2mitofusin 2 (216205_s_at), score: -0.63
MFSD6major facilitator superfamily domain containing 6 (219858_s_at), score: 0.6
MRPS6mitochondrial ribosomal protein S6 (213167_s_at), score: -0.73
MTMR1myotubularin related protein 1 (214975_s_at), score: -0.58
OLR1oxidized low density lipoprotein (lectin-like) receptor 1 (210004_at), score: -0.73
PACS1phosphofurin acidic cluster sorting protein 1 (220557_s_at), score: -0.55
PAPPA2pappalysin 2 (213332_at), score: 0.73
PDE1Cphosphodiesterase 1C, calmodulin-dependent 70kDa (207303_at), score: -0.76
PKP2plakophilin 2 (207717_s_at), score: 0.58
PPP2R5Dprotein phosphatase 2, regulatory subunit B', delta isoform (211159_s_at), score: -0.56
PSME4proteasome (prosome, macropain) activator subunit 4 (212220_at), score: -0.56
PTGDSprostaglandin D2 synthase 21kDa (brain) (212187_x_at), score: 0.73
PTGER4prostaglandin E receptor 4 (subtype EP4) (204897_at), score: 0.57
PTPRAprotein tyrosine phosphatase, receptor type, A (213799_s_at), score: -0.67
PTPREprotein tyrosine phosphatase, receptor type, E (221840_at), score: 0.7
PTRFpolymerase I and transcript release factor (208790_s_at), score: -0.56
RARRES3retinoic acid receptor responder (tazarotene induced) 3 (204070_at), score: 0.93
RASA3RAS p21 protein activator 3 (206220_s_at), score: -0.54
SCG2secretogranin II (chromogranin C) (204035_at), score: 0.64
SEC14L1SEC14-like 1 (S. cerevisiae) (202082_s_at), score: -0.61
SERPINI1serpin peptidase inhibitor, clade I (neuroserpin), member 1 (205352_at), score: -0.56
SLC26A6solute carrier family 26, member 6 (221572_s_at), score: 0.83
SLC29A1solute carrier family 29 (nucleoside transporters), member 1 (201801_s_at), score: -0.72
SNCAsynuclein, alpha (non A4 component of amyloid precursor) (204466_s_at), score: -0.7
SPPL2Bsignal peptide peptidase-like 2B (215833_s_at), score: -0.59
STAT2signal transducer and activator of transcription 2, 113kDa (205170_at), score: -0.9
SULT1A3sulfotransferase family, cytosolic, 1A, phenol-preferring, member 3 (210580_x_at), score: 0.67
SYT1synaptotagmin I (203999_at), score: 0.57
TANC2tetratricopeptide repeat, ankyrin repeat and coiled-coil containing 2 (208425_s_at), score: -0.82
TAPBPLTAP binding protein-like (218746_at), score: 0.76
TEKTEK tyrosine kinase, endothelial (206702_at), score: -0.53
TGFBR1transforming growth factor, beta receptor 1 (206943_at), score: -0.62
TNFRSF14tumor necrosis factor receptor superfamily, member 14 (herpesvirus entry mediator) (209354_at), score: 0.58
TOM1target of myb1 (chicken) (202807_s_at), score: 0.59
TOM1L2target of myb1-like 2 (chicken) (214840_at), score: -0.82
TOP3Atopoisomerase (DNA) III alpha (214300_s_at), score: -0.58
TRAF1TNF receptor-associated factor 1 (205599_at), score: -0.54
ZNF467zinc finger protein 467 (214746_s_at), score: 0.6
ZNF688zinc finger protein 688 (213527_s_at), score: 0.6
ZNF711zinc finger protein 711 (207781_s_at), score: 0.58
Non-Entrez genes
Unknown, score:
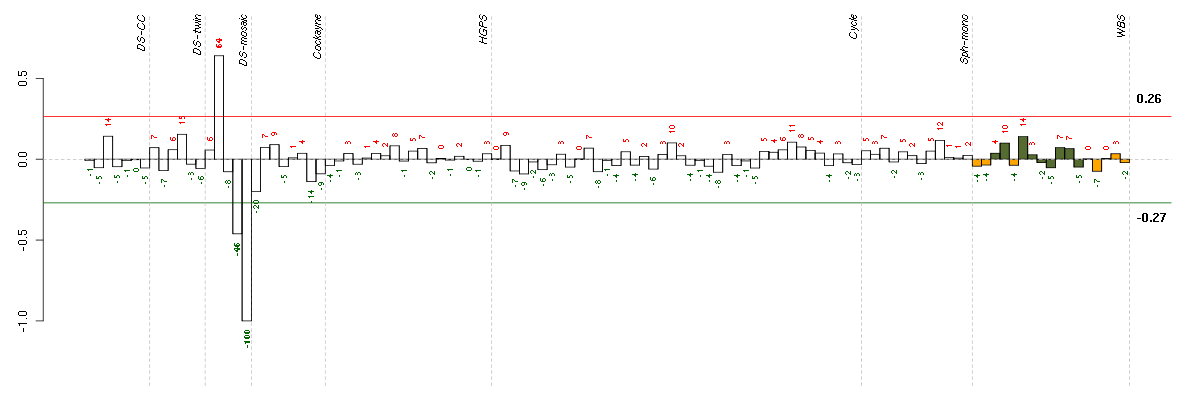
HELP
Conditions in the module, given in the same order as on the expression
plot above. Red color means over-expression, green under-expression in
the given condition.
The barplot below shows the condition (sample) scores. A separate bar
is shown for each sample, its height is the corresponding score of the
sample in the module. The red and green numbers on the bars are the
sample scores expressed in percents, i.e. 100% is 1.0.
The red and green lines show the module thresholds, samples above
the red line and below the green line are included in the module.
The different experiments that were part of the study, are separated
by dashed vertical lines.
— Click on the Help button again to close this help window.
| Id | sample | Experiment | ExpName | Array | Syndrome | Cell.line |
| 47C.CEL | 5 | 3 | DS-mosaic | hgu133plus2 | Down mosaic | DS-mosaic 5 |
| 47B.CEL | 4 | 3 | DS-mosaic | hgu133plus2 | Down mosaic | DS-mosaic 4 |
| 46B.CEL | 2 | 3 | DS-mosaic | hgu133plus2 | none | DS-mosaic 2 |


© 2008-2010 Computational Biology Group, Department of Medical Genetics,
University of Lausanne, Switzerland