Previous module |
Next module
Module #514, TG: 3, TC: 2, 65 probes, 65 Entrez genes, 3 conditions


HELP
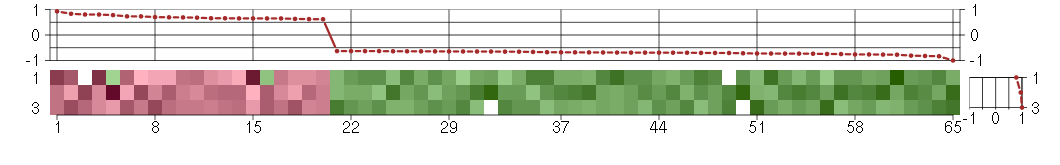
The image plot shows the color-coded level of gene expression, for the
genes and conditions in a given transcription module. The genes are on
the horizontal, the conditions on the vertical axis.
The genes are ordered according to their ISA gene scores, similarly
the conditions are ordered according to their condition scores. The
score of a gene means the «degree of inclusion» in
the module: a high score gene is essential in the module.
Condition scores can also be negative, that means that the genes of
the module are all down-regulated in the condition. Here the absolute
value of the score gives the «degree of inclusion».
The plots above and beside the expression matrix show the gene scores
and condition scores, respectively.
Note that the plot is interactive, you can see the name of the gene
and condition under the mouse cursor.
The expression matrix was normalized to have mean zero and standard
deviation one for every gene separately across all conditions
(i.e. not just for the conditions in the module).
— Click on the Help button again to close this help window.

Under-expression is coded with green,
over-expression with red color.
Help |
Hide |
Top
Help |
Show |
Top
The GO tree — Biological processes
HELP
This is one of three sections showing Gene Ontology enrichment of the
current module: in this case for biological processes.
The graph shows the hierarchy of the GO categories, their enrichment
for the current module is color coded, and the blue number beside the
category is the minus log ten p-value of the enrichment. (Calculated
using the standard hypergeometric test.) The color of the arrows code
«is a» (cyan) and «part of» relationships.
The tree was built the following way. First all GO terms with more
significant enrichment p-value than 0.05 were collected. Then all
paths from these terms to the root node of the GO tree were included
too. If a GO term is included more than once in the tree, then the
green numbers show 1) the id of the node, this makes it easier to find
other appereances of the term, and 2) the number of appearences.
Note that the same GO category might show up on the graph many
times. This is because the GO was «straightened» for this
graph, i.e. if there are more paths from a GO term to the root node of
the tree, all of them are included. The green numbers
Move the mouse cursor over the terms to get their definition. Clicking
on them takes you to the corresponding Gene Ontology web page.
If you cannot see a graph here at all, that means that there were no
significantly enriched GO categories, at the 0.05 level.
— Click on the Help button again to close this help window.

Help |
Hide |
Top
Help |
Show |
Top
The GO tree — Cellular Components
HELP
This is one of three sections showing Gene Ontology enrichment of the
current module: in this case for cellular components.
The graph shows the hierarchy of the GO categories, their enrichment
for the current module is color coded, and the blue number beside the
category is the minus log ten p-value of the enrichment. (Calculated
using the standard hypergeometric test.) The color of the arrows code
«is a» (cyan) and «part of» relationships.
The tree was built the following way. First all GO terms with more
significant enrichment p-value than 0.05 were collected. Then all
paths from these terms to the root node of the GO tree were included
too. If a GO term is included more than once in the tree, then the
green numbers show 1) the id of the node, this makes it easier to find
other appereances of the term, and 2) the number of appearences.
Note that the same GO category might show up on the graph many
times. This is because the GO was «straightened» for this
graph, i.e. if there are more paths from a GO term to the root node of
the tree, all of them are included. The green numbers
Move the mouse cursor over the terms to get their definition. Clicking
on them takes you to the corresponding Gene Ontology web page.
If you cannot see a graph here at all, that means that there were no
significantly enriched GO categories, at the 0.05 level.
— Click on the Help button again to close this help window.
plasma membrane
The membrane surrounding a cell that separates the cell from its external environment. It consists of a phospholipid bilayer and associated proteins.
membrane
Double layer of lipid molecules that encloses all cells, and, in eukaryotes, many organelles; may be a single or double lipid bilayer; also includes associated proteins.
cellular_component
The part of a cell or its extracellular environment in which a gene product is located. A gene product may be located in one or more parts of a cell and its location may be as specific as a particular macromolecular complex, that is, a stable, persistent association of macromolecules that function together.
cell
The basic structural and functional unit of all organisms. Includes the plasma membrane and any external encapsulating structures such as the cell wall and cell envelope.
membrane part
Any constituent part of a membrane, a double layer of lipid molecules that encloses all cells, and, in eukaryotes, many organelles; may be a single or double lipid bilayer; also includes associated proteins.
plasma membrane part
Any constituent part of the plasma membrane, the membrane surrounding a cell that separates the cell from its external environment. It consists of a phospholipid bilayer and associated proteins.
cell part
Any constituent part of a cell, the basic structural and functional unit of all organisms.
all
This term is the most general term possible
cell part
Any constituent part of a cell, the basic structural and functional unit of all organisms.
membrane part
Any constituent part of a membrane, a double layer of lipid molecules that encloses all cells, and, in eukaryotes, many organelles; may be a single or double lipid bilayer; also includes associated proteins.
plasma membrane part
Any constituent part of the plasma membrane, the membrane surrounding a cell that separates the cell from its external environment. It consists of a phospholipid bilayer and associated proteins.
Help |
Hide |
Top
Help |
Show |
Top
The GO tree — Molecular Function
HELP
This is one of three sections showing Gene Ontology enrichment of the
current module: in this case for molecular function.
The graph shows the hierarchy of the GO categories, their enrichment
for the current module is color coded, and the blue number beside the
category is the minus log ten p-value of the enrichment. (Calculated
using the standard hypergeometric test.) The color of the arrows code
«is a» (cyan) and «part of» relationships.
The tree was built the following way. First all GO terms with more
significant enrichment p-value than 0.05 were collected. Then all
paths from these terms to the root node of the GO tree were included
too. If a GO term is included more than once in the tree, then the
green numbers show 1) the id of the node, this makes it easier to find
other appereances of the term, and 2) the number of appearences.
Note that the same GO category might show up on the graph many
times. This is because the GO was «straightened» for this
graph, i.e. if there are more paths from a GO term to the root node of
the tree, all of them are included. The green numbers
Move the mouse cursor over the terms to get their definition. Clicking
on them takes you to the corresponding Gene Ontology web page.
If you cannot see a graph here at all, that means that there were no
significantly enriched GO categories, at the 0.05 level.
— Click on the Help button again to close this help window.
Help |
Hide |
Top
Help |
Show |
Top
GO BP test for over-representation
HELP
List of all enriched GO categories (biological processes), at the 0.05
p-value level.
The columns:
- ExpCount is the expected count of genes in the
module annotated with the given GO term, just by chance.
- Count
is the number of genes in the module annotated with the given GO
term.
- Size is the total number of genes (in our universe)
annotated with the GO term.
Clicking on Count shows the genes that drive the
enrichment. You can also click on the individual numbers in
the Count column, to show the driving genes for that individual
GO category.
Clicking on the GO identifiers takes you to the Gene Ontology web
pages.
— Click on the Help button again to close this help window.
| Id | Pvalue | ExpCount | Count | Size | Term |
| GO:0042535 | 2.158e-02 | 0.02851 | 2
TLR1, TNFRSF8 | 4 | positive regulation of tumor necrosis factor biosynthetic process |
| GO:0045321 | 2.658e-02 | 0.9764 | 6
CLCF1, CLEC7A, JAG2, PLCG2, TLR1, ZNF3 | 137 | leukocyte activation |
| GO:0042533 | 3.105e-02 | 0.03564 | 2
TLR1, TNFRSF8 | 5 | tumor necrosis factor biosynthetic process |
| GO:0042534 | 3.105e-02 | 0.03564 | 2
TLR1, TNFRSF8 | 5 | regulation of tumor necrosis factor biosynthetic process |
| GO:0001775 | 3.897e-02 | 1.083 | 6
CLCF1, CLEC7A, JAG2, PLCG2, TLR1, ZNF3 | 152 | cell activation |
Help |
Hide |
Top
Help |
Show |
Top
GO CC test for over-representation
HELP
List of all enriched GO categories (cellular components), at the 0.05
p-value level.
The columns:
- ExpCount is the expected count of genes in the
module annotated with the given GO term, just by chance.
- Count
is the number of genes in the module annotated with the given GO
term.
- Size is the total number of genes (in our universe)
annotated with the GO term.
Clicking on Count shows the genes that drive the
enrichment. You can also click on the individual numbers in
the Count column, to show the driving genes for that individual
GO category.
Clicking on the GO identifiers takes you to the Gene Ontology web
pages.
— Click on the Help button again to close this help window.
| Id | Pvalue | ExpCount | Count | Size | Term |
| GO:0005886 | 3.205e-03 | 9.829 | 22
ACTN3, ALPPL2, CDK5R1, HLA-DQB1, JAG2, LY75, OLR1, PLCG2, PTP4A3, PXN, RIMS2, SEPT5, SLC15A1, SLC29A1, SLC2A8, SLC6A11, SORBS1, SYN2, TLR1, TNFRSF8, TYRO3, VAMP1 | 1443 | plasma membrane |
| GO:0044459 | 5.178e-03 | 5.96 | 16
ACTN3, HLA-DQB1, JAG2, LY75, OLR1, PXN, RIMS2, SLC15A1, SLC29A1, SLC2A8, SLC6A11, SORBS1, SYN2, TLR1, TYRO3, VAMP1 | 875 | plasma membrane part |
| GO:0016020 | 3.187e-02 | 21.57 | 33
ACTN3, ALPPL2, CDK5R1, CLEC7A, DHODH, DYM, HLA-DQB1, INPP5B, JAG2, LY75, MGC5590, OLR1, PIP5K1B, PLCG2, PTP4A3, PXN, RAG1AP1, RIMS2, SARM1, SEPT5, SLC15A1, SLC22A17, SLC25A28, SLC29A1, SLC2A8, SLC6A11, SORBS1, SYN2, TLR1, TNFRSF8, TYRO3, VAMP1, VPS33B | 3167 | membrane |
Help |
Hide |
Top
Help |
Show |
Top
GO MF test for over-representation
HELP
List of all enriched GO categories (molecular function), at the 0.05
p-value level.
The columns:
- ExpCount is the expected count of genes in the
module annotated with the given GO term, just by chance.
- Count
is the number of genes in the module annotated with the given GO
term.
- Size is the total number of genes (in our universe)
annotated with the GO term.
Clicking on Count shows the genes that drive the
enrichment. You can also click on the individual numbers in
the Count column, to show the driving genes for that individual
GO category.
Clicking on the GO identifiers takes you to the Gene Ontology web
pages.
— Click on the Help button again to close this help window.
| Id | Pvalue | ExpCount | Count | Size | Term |
| GO:0005529 | 1.053e-02 | 0.454 | 5
CLEC7A, CRYBG3, LY75, OLR1, SLC2A8 | 65 | sugar binding |
Help |
Hide |
Top
Help |
Show |
Top
KEGG Pathway test for over-representation
HELP
List of all enriched KEGG pathways, at the 0.05
p-value level.
The columns:
- ExpCount is the expected count of genes in the
module annotated with the given KEGG pathway, just by chance.
- Count
is the number of genes in the module annotated with the given KEGG
pathway.
- Size is the total number of genes (in our universe)
annotated with the KEGG pathway.
Clicking on Count shows the genes that drive the
enrichment. You can also click on the individual numbers in
the Count column, to show the driving genes for that individual
KEGG pathway.
Clicking on the KEGG identifiers takes you to the KEGG web site.
— Click on the Help button again to close this help window.
Help |
Hide |
Top
Help |
Show |
Top
miRNA test for over-representation
HELP
List of all enriched miRNA families, at the 0.05
p-value level.
The columns:
- ExpCount is the expected count of genes in the
module regulated by the given miRNA family, just by chance.
- Count
is the number of genes in the module regulated by the given miRNA
family.
- Size is the total number of genes (in our universe)
regulated with the given miRNA family.
Clicking on Count shows the genes that drive the
enrichment. You can also click on the individual numbers in
the Count column, to show the driving genes for that individual
miRNA family.
The miRNA regulation data was taken from the TargetScan database.
(Only the conserved sites were used for the current analysis.)
Clicking on the miRNA names takes you to the TargetScan web site.
— Click on the Help button again to close this help window.
Help |
Hide |
Top
Help |
Show |
Top
Chromosome test for over-representation
HELP
List of all enriched Chromosomes, at the 0.05
p-value level.
The columns:
- ExpCount is the expected number of genes in the
module on the given chromosome, just by chance.
- Count
is the number of genes in the module on the given chromosome.
- Size is the total number of genes (in our universe)
on the given chromosome.
Clicking on Count shows the genes that drive the
enrichment. You can also click on the individual numbers in
the Count column, to show the driving genes for that individual
chromosome.
— Click on the Help button again to close this help window.
HELP
A list of all genes in the current module, in alphabetical order. The
size of the text corresponds to the gene scores.
Note that some gene symbols may show up more than once, if many
probes match the same Entrez gene.
Genes with no Entrez mapping are given separately, with their
Affymetrics probe ID.
— Click on the Help button again to close this help window.
Entrez genes
ACTN3actinin, alpha 3 (206891_at), score: -0.74
ALPPL2alkaline phosphatase, placental-like 2 (216377_x_at), score: -0.67
AOC2amine oxidase, copper containing 2 (retina-specific) (207064_s_at), score: -1
CCDC41coiled-coil domain containing 41 (219644_at), score: -0.73
CDK5R1cyclin-dependent kinase 5, regulatory subunit 1 (p35) (204995_at), score: 0.73
CLCF1cardiotrophin-like cytokine factor 1 (219500_at), score: 0.65
CLEC7AC-type lectin domain family 7, member A (221698_s_at), score: 0.69
CRYBG3beta-gamma crystallin domain containing 3 (214030_at), score: -0.64
CTSL2cathepsin L2 (210074_at), score: 0.68
DHODHdihydroorotate dehydrogenase (213631_x_at), score: -0.64
DHRS12dehydrogenase/reductase (SDR family) member 12 (204800_s_at), score: -0.71
DKFZp547G183hypothetical LOC55525 (220572_at), score: -0.72
DYMdymeclin (220774_at), score: -0.64
E2F1E2F transcription factor 1 (204947_at), score: 0.65
FBXO17F-box protein 17 (220233_at), score: 0.66
HAND1heart and neural crest derivatives expressed 1 (220138_at), score: -0.63
HERC3hect domain and RLD 3 (206183_s_at), score: 0.83
HINFPhistone H4 transcription factor (206495_s_at), score: -0.82
HIST1H2ALhistone cluster 1, H2al (214554_at), score: 0.78
HLA-DQB1major histocompatibility complex, class II, DQ beta 1 (211654_x_at), score: -0.64
HOXD4homeobox D4 (205522_at), score: -0.68
INPP5Binositol polyphosphate-5-phosphatase, 75kDa (213804_at), score: -0.7
JAG2jagged 2 (32137_at), score: -0.76
LDB3LIM domain binding 3 (213371_at), score: 0.63
LY6G5Clymphocyte antigen 6 complex, locus G5C (219860_at), score: 0.7
LY75lymphocyte antigen 75 (205668_at), score: 0.8
MEG3maternally expressed 3 (non-protein coding) (210794_s_at), score: -0.65
MGAMAX gene associated (212945_s_at), score: -0.64
MGC5590hypothetical protein MGC5590 (220931_at), score: -0.72
MYO15Amyosin XVA (220288_at), score: -0.83
NCRNA00092non-protein coding RNA 92 (215861_at), score: -0.77
OLR1oxidized low density lipoprotein (lectin-like) receptor 1 (210004_at), score: -0.65
PDK3pyruvate dehydrogenase kinase, isozyme 3 (221957_at), score: 0.65
PIP5K1Bphosphatidylinositol-4-phosphate 5-kinase, type I, beta (217477_at), score: -0.75
PKNOX2PBX/knotted 1 homeobox 2 (63305_at), score: 0.73
PLCG2phospholipase C, gamma 2 (phosphatidylinositol-specific) (204613_at), score: 0.66
PTP4A3protein tyrosine phosphatase type IVA, member 3 (209695_at), score: -0.69
PXNpaxillin (211823_s_at), score: 0.62
RAG1AP1recombination activating gene 1 activating protein 1 (219125_s_at), score: -0.73
RIMS2regulating synaptic membrane exocytosis 2 (215478_at), score: -0.68
RSBN1round spermatid basic protein 1 (213694_at), score: -0.77
SARM1sterile alpha and TIR motif containing 1 (213259_s_at), score: -0.65
SEPT5septin 5 (209767_s_at), score: -0.66
SLC15A1solute carrier family 15 (oligopeptide transporter), member 1 (211349_at), score: -0.69
SLC22A17solute carrier family 22, member 17 (218675_at), score: -0.68
SLC25A28solute carrier family 25, member 28 (221432_s_at), score: 0.8
SLC29A1solute carrier family 29 (nucleoside transporters), member 1 (201801_s_at), score: 0.62
SLC2A8solute carrier family 2 (facilitated glucose transporter), member 8 (218985_at), score: 0.93
SLC6A11solute carrier family 6 (neurotransmitter transporter, GABA), member 11 (207048_at), score: -0.81
SORBS1sorbin and SH3 domain containing 1 (218087_s_at), score: -0.7
SYN2synapsin II (210247_at), score: -0.69
TLR1toll-like receptor 1 (210176_at), score: -0.63
TMSB4Ythymosin beta 4, Y-linked (206769_at), score: -0.69
TNFRSF8tumor necrosis factor receptor superfamily, member 8 (206729_at), score: -0.65
TRIM45tripartite motif-containing 45 (219923_at), score: -0.69
TXNL4Bthioredoxin-like 4B (218794_s_at), score: -0.73
TYRO3TYRO3 protein tyrosine kinase (211432_s_at), score: 0.69
VAMP1vesicle-associated membrane protein 1 (synaptobrevin 1) (213326_at), score: -0.67
VCPIP1valosin containing protein (p97)/p47 complex interacting protein 1 (219810_at), score: -0.63
VPS33Bvacuolar protein sorting 33 homolog B (yeast) (44111_at), score: -0.63
ZCCHC4zinc finger, CCHC domain containing 4 (220473_s_at), score: 0.65
ZCCHC6zinc finger, CCHC domain containing 6 (220933_s_at), score: -0.73
ZNF167zinc finger protein 167 (206314_at), score: -0.69
ZNF3zinc finger protein 3 (212684_at), score: -0.7
ZNF394zinc finger protein 394 (214714_at), score: -0.76
Non-Entrez genes
Unknown, score:
HELP
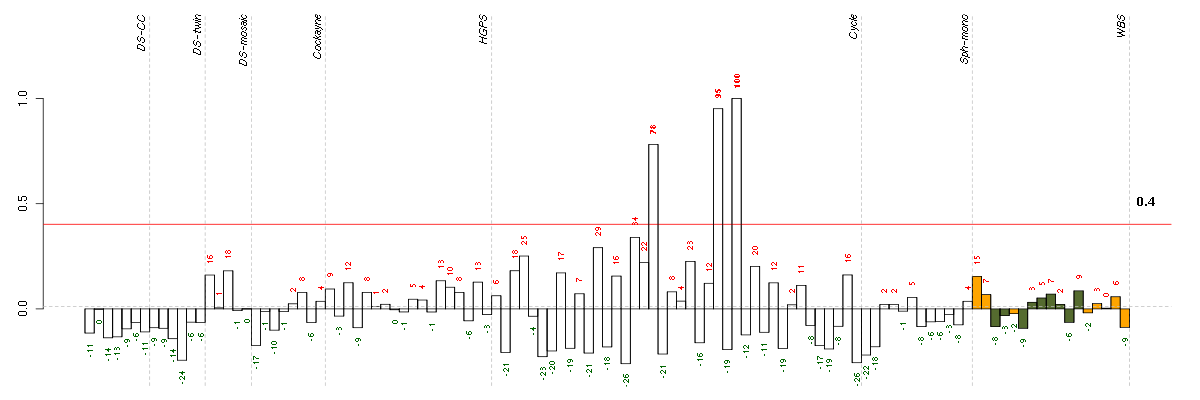
Conditions in the module, given in the same order as on the expression
plot above. Red color means over-expression, green under-expression in
the given condition.
The barplot below shows the condition (sample) scores. A separate bar
is shown for each sample, its height is the corresponding score of the
sample in the module. The red and green numbers on the bars are the
sample scores expressed in percents, i.e. 100% is 1.0.
The red and green lines show the module thresholds, samples above
the red line and below the green line are included in the module.
The different experiments that were part of the study, are separated
by dashed vertical lines.
— Click on the Help button again to close this help window.
| Id | sample | Experiment | ExpName | Array | Syndrome | Cell.line |
| E-TABM-263-raw-cel-1515485991.cel | 18 | 6 | Cycle | hgu133a2 | none | Cycle 1 |
| E-TABM-263-raw-cel-1515486131.cel | 25 | 6 | Cycle | hgu133a2 | none | Cycle 1 |
| E-TABM-263-raw-cel-1515486171.cel | 27 | 6 | Cycle | hgu133a2 | none | Cycle 1 |


© 2008-2010 Computational Biology Group, Department of Medical Genetics,
University of Lausanne, Switzerland