Previous module |
Next module
Module #533, TG: 3, TC: 1.8, 88 probes, 88 Entrez genes, 7 conditions


HELP
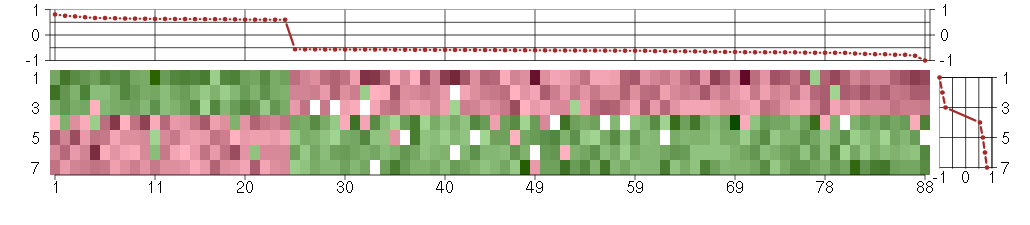
The image plot shows the color-coded level of gene expression, for the
genes and conditions in a given transcription module. The genes are on
the horizontal, the conditions on the vertical axis.
The genes are ordered according to their ISA gene scores, similarly
the conditions are ordered according to their condition scores. The
score of a gene means the «degree of inclusion» in
the module: a high score gene is essential in the module.
Condition scores can also be negative, that means that the genes of
the module are all down-regulated in the condition. Here the absolute
value of the score gives the «degree of inclusion».
The plots above and beside the expression matrix show the gene scores
and condition scores, respectively.
Note that the plot is interactive, you can see the name of the gene
and condition under the mouse cursor.
The expression matrix was normalized to have mean zero and standard
deviation one for every gene separately across all conditions
(i.e. not just for the conditions in the module).
— Click on the Help button again to close this help window.

Under-expression is coded with green,
over-expression with red color.
Help |
Hide |
Top
Help |
Show |
Top
The GO tree — Biological processes
HELP
This is one of three sections showing Gene Ontology enrichment of the
current module: in this case for biological processes.
The graph shows the hierarchy of the GO categories, their enrichment
for the current module is color coded, and the blue number beside the
category is the minus log ten p-value of the enrichment. (Calculated
using the standard hypergeometric test.) The color of the arrows code
«is a» (cyan) and «part of» relationships.
The tree was built the following way. First all GO terms with more
significant enrichment p-value than 0.05 were collected. Then all
paths from these terms to the root node of the GO tree were included
too. If a GO term is included more than once in the tree, then the
green numbers show 1) the id of the node, this makes it easier to find
other appereances of the term, and 2) the number of appearences.
Note that the same GO category might show up on the graph many
times. This is because the GO was «straightened» for this
graph, i.e. if there are more paths from a GO term to the root node of
the tree, all of them are included. The green numbers
Move the mouse cursor over the terms to get their definition. Clicking
on them takes you to the corresponding Gene Ontology web page.
If you cannot see a graph here at all, that means that there were no
significantly enriched GO categories, at the 0.05 level.
— Click on the Help button again to close this help window.

Help |
Hide |
Top
Help |
Show |
Top
The GO tree — Cellular Components
HELP
This is one of three sections showing Gene Ontology enrichment of the
current module: in this case for cellular components.
The graph shows the hierarchy of the GO categories, their enrichment
for the current module is color coded, and the blue number beside the
category is the minus log ten p-value of the enrichment. (Calculated
using the standard hypergeometric test.) The color of the arrows code
«is a» (cyan) and «part of» relationships.
The tree was built the following way. First all GO terms with more
significant enrichment p-value than 0.05 were collected. Then all
paths from these terms to the root node of the GO tree were included
too. If a GO term is included more than once in the tree, then the
green numbers show 1) the id of the node, this makes it easier to find
other appereances of the term, and 2) the number of appearences.
Note that the same GO category might show up on the graph many
times. This is because the GO was «straightened» for this
graph, i.e. if there are more paths from a GO term to the root node of
the tree, all of them are included. The green numbers
Move the mouse cursor over the terms to get their definition. Clicking
on them takes you to the corresponding Gene Ontology web page.
If you cannot see a graph here at all, that means that there were no
significantly enriched GO categories, at the 0.05 level.
— Click on the Help button again to close this help window.
extracellular region
The space external to the outermost structure of a cell. For cells without external protective or external encapsulating structures this refers to space outside of the plasma membrane. This term covers the host cell environment outside an intracellular parasite.
cellular_component
The part of a cell or its extracellular environment in which a gene product is located. A gene product may be located in one or more parts of a cell and its location may be as specific as a particular macromolecular complex, that is, a stable, persistent association of macromolecules that function together.
all
This term is the most general term possible
Help |
Hide |
Top
Help |
Show |
Top
The GO tree — Molecular Function
HELP
This is one of three sections showing Gene Ontology enrichment of the
current module: in this case for molecular function.
The graph shows the hierarchy of the GO categories, their enrichment
for the current module is color coded, and the blue number beside the
category is the minus log ten p-value of the enrichment. (Calculated
using the standard hypergeometric test.) The color of the arrows code
«is a» (cyan) and «part of» relationships.
The tree was built the following way. First all GO terms with more
significant enrichment p-value than 0.05 were collected. Then all
paths from these terms to the root node of the GO tree were included
too. If a GO term is included more than once in the tree, then the
green numbers show 1) the id of the node, this makes it easier to find
other appereances of the term, and 2) the number of appearences.
Note that the same GO category might show up on the graph many
times. This is because the GO was «straightened» for this
graph, i.e. if there are more paths from a GO term to the root node of
the tree, all of them are included. The green numbers
Move the mouse cursor over the terms to get their definition. Clicking
on them takes you to the corresponding Gene Ontology web page.
If you cannot see a graph here at all, that means that there were no
significantly enriched GO categories, at the 0.05 level.
— Click on the Help button again to close this help window.
Help |
Hide |
Top
Help |
Show |
Top
GO BP test for over-representation
HELP
List of all enriched GO categories (biological processes), at the 0.05
p-value level.
The columns:
- ExpCount is the expected count of genes in the
module annotated with the given GO term, just by chance.
- Count
is the number of genes in the module annotated with the given GO
term.
- Size is the total number of genes (in our universe)
annotated with the GO term.
Clicking on Count shows the genes that drive the
enrichment. You can also click on the individual numbers in
the Count column, to show the driving genes for that individual
GO category.
Clicking on the GO identifiers takes you to the Gene Ontology web
pages.
— Click on the Help button again to close this help window.
Help |
Hide |
Top
Help |
Show |
Top
GO CC test for over-representation
HELP
List of all enriched GO categories (cellular components), at the 0.05
p-value level.
The columns:
- ExpCount is the expected count of genes in the
module annotated with the given GO term, just by chance.
- Count
is the number of genes in the module annotated with the given GO
term.
- Size is the total number of genes (in our universe)
annotated with the GO term.
Clicking on Count shows the genes that drive the
enrichment. You can also click on the individual numbers in
the Count column, to show the driving genes for that individual
GO category.
Clicking on the GO identifiers takes you to the Gene Ontology web
pages.
— Click on the Help button again to close this help window.
| Id | Pvalue | ExpCount | Count | Size | Term |
| GO:0005576 | 4.469e-03 | 6.357 | 17
ADAMTS7, APOC4, APP, COL11A2, DMBT1, DSPP, EMCN, F11, GDF9, IL23A, LILRA5, MFNG, MUC5AC, PRLH, SAA4, SIGLEC1, WFDC8 | 700 | extracellular region |
| GO:0031301 | 1.591e-02 | 0.6811 | 5
ASPHD1, MFNG, MUL1, ST8SIA3, STIM1 | 75 | integral to organelle membrane |
| GO:0031300 | 3.288e-02 | 0.8264 | 5
ASPHD1, MFNG, MUL1, ST8SIA3, STIM1 | 91 | intrinsic to organelle membrane |
Help |
Hide |
Top
Help |
Show |
Top
GO MF test for over-representation
HELP
List of all enriched GO categories (molecular function), at the 0.05
p-value level.
The columns:
- ExpCount is the expected count of genes in the
module annotated with the given GO term, just by chance.
- Count
is the number of genes in the module annotated with the given GO
term.
- Size is the total number of genes (in our universe)
annotated with the GO term.
Clicking on Count shows the genes that drive the
enrichment. You can also click on the individual numbers in
the Count column, to show the driving genes for that individual
GO category.
Clicking on the GO identifiers takes you to the Gene Ontology web
pages.
— Click on the Help button again to close this help window.
Help |
Hide |
Top
Help |
Show |
Top
KEGG Pathway test for over-representation
HELP
List of all enriched KEGG pathways, at the 0.05
p-value level.
The columns:
- ExpCount is the expected count of genes in the
module annotated with the given KEGG pathway, just by chance.
- Count
is the number of genes in the module annotated with the given KEGG
pathway.
- Size is the total number of genes (in our universe)
annotated with the KEGG pathway.
Clicking on Count shows the genes that drive the
enrichment. You can also click on the individual numbers in
the Count column, to show the driving genes for that individual
KEGG pathway.
Clicking on the KEGG identifiers takes you to the KEGG web site.
— Click on the Help button again to close this help window.
Help |
Hide |
Top
Help |
Show |
Top
miRNA test for over-representation
HELP
List of all enriched miRNA families, at the 0.05
p-value level.
The columns:
- ExpCount is the expected count of genes in the
module regulated by the given miRNA family, just by chance.
- Count
is the number of genes in the module regulated by the given miRNA
family.
- Size is the total number of genes (in our universe)
regulated with the given miRNA family.
Clicking on Count shows the genes that drive the
enrichment. You can also click on the individual numbers in
the Count column, to show the driving genes for that individual
miRNA family.
The miRNA regulation data was taken from the TargetScan database.
(Only the conserved sites were used for the current analysis.)
Clicking on the miRNA names takes you to the TargetScan web site.
— Click on the Help button again to close this help window.
Help |
Hide |
Top
Help |
Show |
Top
Chromosome test for over-representation
HELP
List of all enriched Chromosomes, at the 0.05
p-value level.
The columns:
- ExpCount is the expected number of genes in the
module on the given chromosome, just by chance.
- Count
is the number of genes in the module on the given chromosome.
- Size is the total number of genes (in our universe)
on the given chromosome.
Clicking on Count shows the genes that drive the
enrichment. You can also click on the individual numbers in
the Count column, to show the driving genes for that individual
chromosome.
— Click on the Help button again to close this help window.
HELP
A list of all genes in the current module, in alphabetical order. The
size of the text corresponds to the gene scores.
Note that some gene symbols may show up more than once, if many
probes match the same Entrez gene.
Genes with no Entrez mapping are given separately, with their
Affymetrics probe ID.
— Click on the Help button again to close this help window.
Entrez genes
ABCA7ATP-binding cassette, sub-family A (ABC1), member 7 (219577_s_at), score: -0.67
ADAMTS7ADAM metallopeptidase with thrombospondin type 1 motif, 7 (220705_s_at), score: -0.59
ADORA1adenosine A1 receptor (216220_s_at), score: -0.68
APOC4apolipoprotein C-IV (206738_at), score: -0.56
APPamyloid beta (A4) precursor protein (214953_s_at), score: -0.7
ASPHD1aspartate beta-hydroxylase domain containing 1 (214993_at), score: -0.59
ATMataxia telangiectasia mutated (210858_x_at), score: -0.57
BCAMbasal cell adhesion molecule (Lutheran blood group) (40093_at), score: -0.58
BRAFv-raf murine sarcoma viral oncogene homolog B1 (206044_s_at), score: 0.6
C2orf37chromosome 2 open reading frame 37 (220172_at), score: 0.61
CCDC40coiled-coil domain containing 40 (220592_at), score: -0.7
CD79BCD79b molecule, immunoglobulin-associated beta (205297_s_at), score: -1
CHRNB2cholinergic receptor, nicotinic, beta 2 (neuronal) (206635_at), score: -0.68
CNNM3cyclin M3 (220739_s_at), score: 0.7
COL11A2collagen, type XI, alpha 2 (216993_s_at), score: -0.61
CYTH4cytohesin 4 (219183_s_at), score: -0.57
DLSTPdihydrolipoamide S-succinyltransferase pseudogene (E2 component of 2-oxo-glutarate complex) (215210_s_at), score: -0.59
DMBT1deleted in malignant brain tumors 1 (208250_s_at), score: -0.7
DSPPdentin sialophosphoprotein (221681_s_at), score: -0.65
DUSP9dual specificity phosphatase 9 (205777_at), score: -0.68
EMCNendomucin (219436_s_at), score: 0.67
EPS8L1EPS8-like 1 (218778_x_at), score: -0.68
F11coagulation factor XI (206610_s_at), score: -0.58
FBP1fructose-1,6-bisphosphatase 1 (209696_at), score: -0.6
FKBP10FK506 binding protein 10, 65 kDa (219249_s_at), score: -0.82
FOXK2forkhead box K2 (203064_s_at), score: 0.6
FUT2fucosyltransferase 2 (secretor status included) (210608_s_at), score: -0.61
GANgigaxonin (220124_at), score: 0.6
GDF9growth differentiation factor 9 (221314_at), score: -0.57
GGA3golgi associated, gamma adaptin ear containing, ARF binding protein 3 (209411_s_at), score: 0.62
GGTLC1gamma-glutamyltransferase light chain 1 (211416_x_at), score: -0.59
GRM1glutamate receptor, metabotropic 1 (210939_s_at), score: -0.61
HAB1B1 for mucin (215778_x_at), score: -0.75
HIST1H4Ghistone cluster 1, H4g (208551_at), score: -0.57
HPNhepsin (204934_s_at), score: -0.61
IDUAiduronidase, alpha-L- (205059_s_at), score: 0.6
IL23Ainterleukin 23, alpha subunit p19 (211796_s_at), score: -0.57
ITGALintegrin, alpha L (antigen CD11A (p180), lymphocyte function-associated antigen 1; alpha polypeptide) (213475_s_at), score: -0.75
KIAA1305KIAA1305 (220911_s_at), score: 0.73
KRT8P12keratin 8 pseudogene 12 (222060_at), score: -0.6
LILRA5leukocyte immunoglobulin-like receptor, subfamily A (with TM domain), member 5 (215838_at), score: -0.74
LLGL2lethal giant larvae homolog 2 (Drosophila) (203713_s_at), score: -0.7
LOC100133105hypothetical protein LOC100133105 (214237_x_at), score: -0.6
LOC149501similar to keratin 8 (216821_at), score: -0.59
LOC80054hypothetical LOC80054 (220465_at), score: -0.66
LRRN2leucine rich repeat neuronal 2 (216164_at), score: -0.66
MAFKv-maf musculoaponeurotic fibrosarcoma oncogene homolog K (avian) (206750_at), score: -0.64
MDM2Mdm2 p53 binding protein homolog (mouse) (205386_s_at), score: 0.75
MFNGMFNG O-fucosylpeptide 3-beta-N-acetylglucosaminyltransferase (204153_s_at), score: -0.69
MOCS1molybdenum cofactor synthesis 1 (211673_s_at), score: -0.63
MUC5ACmucin 5AC, oligomeric mucus/gel-forming (217182_at), score: -0.68
MUL1mitochondrial E3 ubiquitin ligase 1 (218246_at), score: 0.64
MYH15myosin, heavy chain 15 (215331_at), score: -0.58
MYL4myosin, light chain 4, alkali; atrial, embryonic (210088_x_at), score: -0.61
NEO1neogenin homolog 1 (chicken) (204321_at), score: 0.63
NFYCnuclear transcription factor Y, gamma (202215_s_at), score: 0.67
NXPH3neurexophilin 3 (221991_at), score: -0.57
PHF2PHD finger protein 2 (212726_at), score: 0.63
PMS2L2postmeiotic segregation increased 2-like 2 pseudogene (215410_at), score: -0.64
POM121L2POM121 membrane glycoprotein-like 2 (rat) (216582_at), score: -0.78
PRLHprolactin releasing hormone (221443_x_at), score: -0.61
PTPN6protein tyrosine phosphatase, non-receptor type 6 (206687_s_at), score: -0.73
RANBP10RAN binding protein 10 (221809_at), score: 0.66
RBM12BRNA binding motif protein 12B (51228_at), score: 0.65
RBM38RNA binding motif protein 38 (212430_at), score: -0.78
RPL18AP6ribosomal protein L18a pseudogene 6 (216383_at), score: -0.56
RSAD1radical S-adenosyl methionine domain containing 1 (218307_at), score: 0.63
S100A14S100 calcium binding protein A14 (218677_at), score: -0.59
SAA4serum amyloid A4, constitutive (207096_at), score: -0.61
SCAMP4secretory carrier membrane protein 4 (213244_at), score: 0.62
SH2D3ASH2 domain containing 3A (222169_x_at), score: -0.59
SIGLEC1sialic acid binding Ig-like lectin 1, sialoadhesin (44673_at), score: -0.63
SIN3BSIN3 homolog B, transcription regulator (yeast) (209352_s_at), score: 0.64
SMG7Smg-7 homolog, nonsense mediated mRNA decay factor (C. elegans) (201794_s_at), score: 0.62
ST8SIA3ST8 alpha-N-acetyl-neuraminide alpha-2,8-sialyltransferase 3 (208064_s_at), score: -0.57
STIM1stromal interaction molecule 1 (202764_at), score: 0.81
STXBP2syntaxin binding protein 2 (209367_at), score: -0.59
TAF15TAF15 RNA polymerase II, TATA box binding protein (TBP)-associated factor, 68kDa (202840_at), score: -0.62
TMPRSS6transmembrane protease, serine 6 (214955_at), score: -0.66
TMSB4Ythymosin beta 4, Y-linked (206769_at), score: -0.64
TNFRSF8tumor necrosis factor receptor superfamily, member 8 (206729_at), score: -0.62
TNK1tyrosine kinase, non-receptor, 1 (217149_x_at), score: -0.6
TULP2tubby like protein 2 (206733_at), score: -0.58
UBTD1ubiquitin domain containing 1 (219172_at), score: 0.62
ULK1unc-51-like kinase 1 (C. elegans) (209333_at), score: 0.63
VPS37Bvacuolar protein sorting 37 homolog B (S. cerevisiae) (221704_s_at), score: 0.6
WFDC8WAP four-disulfide core domain 8 (215276_at), score: -0.62
ZNF224zinc finger protein 224 (216983_s_at), score: -0.56
Non-Entrez genes
Unknown, score:
HELP
Conditions in the module, given in the same order as on the expression
plot above. Red color means over-expression, green under-expression in
the given condition.
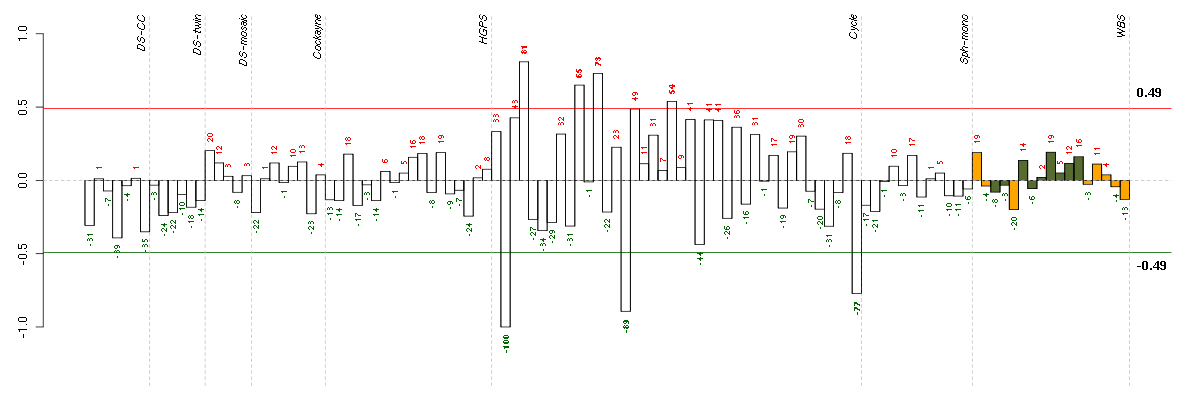
The barplot below shows the condition (sample) scores. A separate bar
is shown for each sample, its height is the corresponding score of the
sample in the module. The red and green numbers on the bars are the
sample scores expressed in percents, i.e. 100% is 1.0.
The red and green lines show the module thresholds, samples above
the red line and below the green line are included in the module.
The different experiments that were part of the study, are separated
by dashed vertical lines.
— Click on the Help button again to close this help window.
| Id | sample | Experiment | ExpName | Array | Syndrome | Cell.line |
| E-TABM-263-raw-cel-1515485671.cel | 2 | 6 | Cycle | hgu133a2 | none | Cycle 1 |
| E-TABM-263-raw-cel-1515485931.cel | 15 | 6 | Cycle | hgu133a2 | none | Cycle 1 |
| E-TABM-263-raw-cel-1515486431.cel | 40 | 6 | Cycle | hgu133a2 | none | Cycle 1 |
| E-TABM-263-raw-cel-1515486031.cel | 20 | 6 | Cycle | hgu133a2 | none | Cycle 1 |
| E-TABM-263-raw-cel-1515485831.cel | 10 | 6 | Cycle | hgu133a2 | none | Cycle 1 |
| E-TABM-263-raw-cel-1515485871.cel | 12 | 6 | Cycle | hgu133a2 | none | Cycle 1 |
| E-TABM-263-raw-cel-1515485711.cel | 4 | 6 | Cycle | hgu133a2 | none | Cycle 1 |


© 2008-2010 Computational Biology Group, Department of Medical Genetics,
University of Lausanne, Switzerland