Previous module |
Next module
Module #607, TG: 2.8, TC: 2, 103 probes, 103 Entrez genes, 6 conditions


HELP
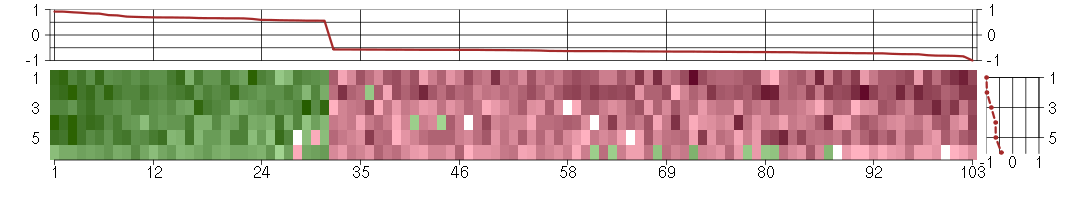
The image plot shows the color-coded level of gene expression, for the
genes and conditions in a given transcription module. The genes are on
the horizontal, the conditions on the vertical axis.
The genes are ordered according to their ISA gene scores, similarly
the conditions are ordered according to their condition scores. The
score of a gene means the «degree of inclusion» in
the module: a high score gene is essential in the module.
Condition scores can also be negative, that means that the genes of
the module are all down-regulated in the condition. Here the absolute
value of the score gives the «degree of inclusion».
The plots above and beside the expression matrix show the gene scores
and condition scores, respectively.
Note that the plot is interactive, you can see the name of the gene
and condition under the mouse cursor.
The expression matrix was normalized to have mean zero and standard
deviation one for every gene separately across all conditions
(i.e. not just for the conditions in the module).
— Click on the Help button again to close this help window.

Under-expression is coded with green,
over-expression with red color.
Help |
Hide |
Top
Help |
Show |
Top
The GO tree — Biological processes
HELP
This is one of three sections showing Gene Ontology enrichment of the
current module: in this case for biological processes.
The graph shows the hierarchy of the GO categories, their enrichment
for the current module is color coded, and the blue number beside the
category is the minus log ten p-value of the enrichment. (Calculated
using the standard hypergeometric test.) The color of the arrows code
«is a» (cyan) and «part of» relationships.
The tree was built the following way. First all GO terms with more
significant enrichment p-value than 0.05 were collected. Then all
paths from these terms to the root node of the GO tree were included
too. If a GO term is included more than once in the tree, then the
green numbers show 1) the id of the node, this makes it easier to find
other appereances of the term, and 2) the number of appearences.
Note that the same GO category might show up on the graph many
times. This is because the GO was «straightened» for this
graph, i.e. if there are more paths from a GO term to the root node of
the tree, all of them are included. The green numbers
Move the mouse cursor over the terms to get their definition. Clicking
on them takes you to the corresponding Gene Ontology web page.
If you cannot see a graph here at all, that means that there were no
significantly enriched GO categories, at the 0.05 level.
— Click on the Help button again to close this help window.

Help |
Hide |
Top
Help |
Show |
Top
The GO tree — Cellular Components
HELP
This is one of three sections showing Gene Ontology enrichment of the
current module: in this case for cellular components.
The graph shows the hierarchy of the GO categories, their enrichment
for the current module is color coded, and the blue number beside the
category is the minus log ten p-value of the enrichment. (Calculated
using the standard hypergeometric test.) The color of the arrows code
«is a» (cyan) and «part of» relationships.
The tree was built the following way. First all GO terms with more
significant enrichment p-value than 0.05 were collected. Then all
paths from these terms to the root node of the GO tree were included
too. If a GO term is included more than once in the tree, then the
green numbers show 1) the id of the node, this makes it easier to find
other appereances of the term, and 2) the number of appearences.
Note that the same GO category might show up on the graph many
times. This is because the GO was «straightened» for this
graph, i.e. if there are more paths from a GO term to the root node of
the tree, all of them are included. The green numbers
Move the mouse cursor over the terms to get their definition. Clicking
on them takes you to the corresponding Gene Ontology web page.
If you cannot see a graph here at all, that means that there were no
significantly enriched GO categories, at the 0.05 level.
— Click on the Help button again to close this help window.
extracellular region
The space external to the outermost structure of a cell. For cells without external protective or external encapsulating structures this refers to space outside of the plasma membrane. This term covers the host cell environment outside an intracellular parasite.
cellular_component
The part of a cell or its extracellular environment in which a gene product is located. A gene product may be located in one or more parts of a cell and its location may be as specific as a particular macromolecular complex, that is, a stable, persistent association of macromolecules that function together.
all
This term is the most general term possible
Help |
Hide |
Top
Help |
Show |
Top
The GO tree — Molecular Function
HELP
This is one of three sections showing Gene Ontology enrichment of the
current module: in this case for molecular function.
The graph shows the hierarchy of the GO categories, their enrichment
for the current module is color coded, and the blue number beside the
category is the minus log ten p-value of the enrichment. (Calculated
using the standard hypergeometric test.) The color of the arrows code
«is a» (cyan) and «part of» relationships.
The tree was built the following way. First all GO terms with more
significant enrichment p-value than 0.05 were collected. Then all
paths from these terms to the root node of the GO tree were included
too. If a GO term is included more than once in the tree, then the
green numbers show 1) the id of the node, this makes it easier to find
other appereances of the term, and 2) the number of appearences.
Note that the same GO category might show up on the graph many
times. This is because the GO was «straightened» for this
graph, i.e. if there are more paths from a GO term to the root node of
the tree, all of them are included. The green numbers
Move the mouse cursor over the terms to get their definition. Clicking
on them takes you to the corresponding Gene Ontology web page.
If you cannot see a graph here at all, that means that there were no
significantly enriched GO categories, at the 0.05 level.
— Click on the Help button again to close this help window.
Help |
Hide |
Top
Help |
Show |
Top
GO BP test for over-representation
HELP
List of all enriched GO categories (biological processes), at the 0.05
p-value level.
The columns:
- ExpCount is the expected count of genes in the
module annotated with the given GO term, just by chance.
- Count
is the number of genes in the module annotated with the given GO
term.
- Size is the total number of genes (in our universe)
annotated with the GO term.
Clicking on Count shows the genes that drive the
enrichment. You can also click on the individual numbers in
the Count column, to show the driving genes for that individual
GO category.
Clicking on the GO identifiers takes you to the Gene Ontology web
pages.
— Click on the Help button again to close this help window.
| Id | Pvalue | ExpCount | Count | Size | Term |
| GO:0042573 | 2.366e-02 | 0.03207 | 2
ALDH1A3, CYP26B1 | 3 | retinoic acid metabolic process |
| GO:0009887 | 2.867e-02 | 3.336 | 11
ALDH1A3, FGF9, HOXA7, ID1, IGF1, KLF5, LEPR, PDGFC, TBX1, TMEM176B, VDR | 312 | organ morphogenesis |
Help |
Hide |
Top
Help |
Show |
Top
GO CC test for over-representation
HELP
List of all enriched GO categories (cellular components), at the 0.05
p-value level.
The columns:
- ExpCount is the expected count of genes in the
module annotated with the given GO term, just by chance.
- Count
is the number of genes in the module annotated with the given GO
term.
- Size is the total number of genes (in our universe)
annotated with the GO term.
Clicking on Count shows the genes that drive the
enrichment. You can also click on the individual numbers in
the Count column, to show the driving genes for that individual
GO category.
Clicking on the GO identifiers takes you to the Gene Ontology web
pages.
— Click on the Help button again to close this help window.
| Id | Pvalue | ExpCount | Count | Size | Term |
| GO:0005576 | 7.122e-03 | 7.858 | 19
BTD, EGFL6, ENDOD1, F10, FGF9, IGF1, ITIH5, LEPR, MATN2, MR1, PAPPA2, PCYOX1L, PDGFC, PRELP, PYCARD, SCG5, SPINT2, SPON1, VCAM1 | 700 | extracellular region |
| GO:0016021 | 1.747e-02 | 22.7 | 37
ABHD14A, ACCN2, AKAP6, B3GALT4, B3GNT1, BTN3A1, BTN3A2, C1orf115, C9orf127, CDH8, CHST7, DNAJC4, GABRE, GCNT1, GDPD5, GLRB, GOLSYN, IL27RA, KCTD15, LEPR, LETMD1, LMF1, LPCAT4, MR1, NOTCH3, NRCAM, SLC27A3, SLC46A3, SLC6A9, SPINT2, TAP1, TAPBP, TMEM176B, TMEM187, UCP2, VAMP1, VCAM1 | 2022 | integral to membrane |
| GO:0031224 | 2.231e-02 | 23.02 | 37
ABHD14A, ACCN2, AKAP6, B3GALT4, B3GNT1, BTN3A1, BTN3A2, C1orf115, C9orf127, CDH8, CHST7, DNAJC4, GABRE, GCNT1, GDPD5, GLRB, GOLSYN, IL27RA, KCTD15, LEPR, LETMD1, LMF1, LPCAT4, MR1, NOTCH3, NRCAM, SLC27A3, SLC46A3, SLC6A9, SPINT2, TAP1, TAPBP, TMEM176B, TMEM187, UCP2, VAMP1, VCAM1 | 2051 | intrinsic to membrane |
| GO:0042824 | 4.140e-02 | 0.06736 | 2
TAP1, TAPBP | 6 | MHC class I peptide loading complex |
Help |
Hide |
Top
Help |
Show |
Top
GO MF test for over-representation
HELP
List of all enriched GO categories (molecular function), at the 0.05
p-value level.
The columns:
- ExpCount is the expected count of genes in the
module annotated with the given GO term, just by chance.
- Count
is the number of genes in the module annotated with the given GO
term.
- Size is the total number of genes (in our universe)
annotated with the GO term.
Clicking on Count shows the genes that drive the
enrichment. You can also click on the individual numbers in
the Count column, to show the driving genes for that individual
GO category.
Clicking on the GO identifiers takes you to the Gene Ontology web
pages.
— Click on the Help button again to close this help window.
| Id | Pvalue | ExpCount | Count | Size | Term |
| GO:0046978 | 1.356e-02 | 0.02173 | 2
TAP1, TAPBP | 2 | TAP1 binding |
| GO:0046977 | 3.005e-02 | 0.03259 | 2
TAP1, TAPBP | 3 | TAP binding |
| GO:0046979 | 3.005e-02 | 0.03259 | 2
TAP1, TAPBP | 3 | TAP2 binding |
Help |
Hide |
Top
Help |
Show |
Top
KEGG Pathway test for over-representation
HELP
List of all enriched KEGG pathways, at the 0.05
p-value level.
The columns:
- ExpCount is the expected count of genes in the
module annotated with the given KEGG pathway, just by chance.
- Count
is the number of genes in the module annotated with the given KEGG
pathway.
- Size is the total number of genes (in our universe)
annotated with the KEGG pathway.
Clicking on Count shows the genes that drive the
enrichment. You can also click on the individual numbers in
the Count column, to show the driving genes for that individual
KEGG pathway.
Clicking on the KEGG identifiers takes you to the KEGG web site.
— Click on the Help button again to close this help window.
Help |
Hide |
Top
Help |
Show |
Top
miRNA test for over-representation
HELP
List of all enriched miRNA families, at the 0.05
p-value level.
The columns:
- ExpCount is the expected count of genes in the
module regulated by the given miRNA family, just by chance.
- Count
is the number of genes in the module regulated by the given miRNA
family.
- Size is the total number of genes (in our universe)
regulated with the given miRNA family.
Clicking on Count shows the genes that drive the
enrichment. You can also click on the individual numbers in
the Count column, to show the driving genes for that individual
miRNA family.
The miRNA regulation data was taken from the TargetScan database.
(Only the conserved sites were used for the current analysis.)
Clicking on the miRNA names takes you to the TargetScan web site.
— Click on the Help button again to close this help window.
Help |
Hide |
Top
Help |
Show |
Top
Chromosome test for over-representation
HELP
List of all enriched Chromosomes, at the 0.05
p-value level.
The columns:
- ExpCount is the expected number of genes in the
module on the given chromosome, just by chance.
- Count
is the number of genes in the module on the given chromosome.
- Size is the total number of genes (in our universe)
on the given chromosome.
Clicking on Count shows the genes that drive the
enrichment. You can also click on the individual numbers in
the Count column, to show the driving genes for that individual
chromosome.
— Click on the Help button again to close this help window.
HELP
A list of all genes in the current module, in alphabetical order. The
size of the text corresponds to the gene scores.
Note that some gene symbols may show up more than once, if many
probes match the same Entrez gene.
Genes with no Entrez mapping are given separately, with their
Affymetrics probe ID.
— Click on the Help button again to close this help window.
Entrez genes
ABHD14Aabhydrolase domain containing 14A (210006_at), score: -0.57
ACCN2amiloride-sensitive cation channel 2, neuronal (205156_s_at), score: -0.59
AGBL5ATP/GTP binding protein-like 5 (218480_at), score: -0.81
AKAP6A kinase (PRKA) anchor protein 6 (205359_at), score: -0.7
ALDH1A3aldehyde dehydrogenase 1 family, member A3 (203180_at), score: 0.65
ARNT2aryl-hydrocarbon receptor nuclear translocator 2 (202986_at), score: -0.57
B3GALT4UDP-Gal:betaGlcNAc beta 1,3-galactosyltransferase, polypeptide 4 (210205_at), score: -0.57
B3GNT1UDP-GlcNAc:betaGal beta-1,3-N-acetylglucosaminyltransferase 1 (203188_at), score: -0.72
BTDbiotinidase (204167_at), score: -0.72
BTN3A1butyrophilin, subfamily 3, member A1 (209770_at), score: -0.6
BTN3A2butyrophilin, subfamily 3, member A2 (209846_s_at), score: -0.71
C10orf116chromosome 10 open reading frame 116 (203571_s_at), score: -0.58
C14orf94chromosome 14 open reading frame 94 (218383_at), score: -0.61
C15orf5chromosome 15 open reading frame 5 (208109_s_at), score: 0.65
C1orf115chromosome 1 open reading frame 115 (218546_at), score: 0.65
C4orf30chromosome 4 open reading frame 30 (219717_at), score: -0.58
C7orf58chromosome 7 open reading frame 58 (220032_at), score: -0.64
C9orf127chromosome 9 open reading frame 127 (207839_s_at), score: -1
CDH8cadherin 8, type 2 (217574_at), score: -0.76
CHAC1ChaC, cation transport regulator homolog 1 (E. coli) (219270_at), score: 0.56
CHST7carbohydrate (N-acetylglucosamine 6-O) sulfotransferase 7 (206756_at), score: -0.69
CRYL1crystallin, lambda 1 (220753_s_at), score: -0.75
CYP26B1cytochrome P450, family 26, subfamily B, polypeptide 1 (219825_at), score: 0.69
DBC1deleted in bladder cancer 1 (205818_at), score: 0.84
DDIT3DNA-damage-inducible transcript 3 (209383_at), score: 0.66
DNAJC4DnaJ (Hsp40) homolog, subfamily C, member 4 (206782_s_at), score: -0.63
DPYSL4dihydropyrimidinase-like 4 (205493_s_at), score: 0.57
EGFL6EGF-like-domain, multiple 6 (219454_at), score: 0.87
EIF4Heukaryotic translation initiation factor 4H (206621_s_at), score: 0.56
ENDOD1endonuclease domain containing 1 (212573_at), score: -0.68
F10coagulation factor X (205620_at), score: -0.71
FAM13Bfamily with sequence similarity 13, member B (218518_at), score: 0.71
FGD6FYVE, RhoGEF and PH domain containing 6 (219901_at), score: -0.59
FGF9fibroblast growth factor 9 (glia-activating factor) (206404_at), score: 0.89
FLGfilaggrin (215704_at), score: 0.66
GABREgamma-aminobutyric acid (GABA) A receptor, epsilon (204537_s_at), score: 0.68
GBP2guanylate binding protein 2, interferon-inducible (202748_at), score: -0.58
GCNT1glucosaminyl (N-acetyl) transferase 1, core 2 (beta-1,6-N-acetylglucosaminyltransferase) (205505_at), score: -0.6
GDPD5glycerophosphodiester phosphodiesterase domain containing 5 (32502_at), score: -0.63
GLRBglycine receptor, beta (205280_at), score: -0.63
GOLSYNGolgi-localized protein (218692_at), score: 0.84
GOT1glutamic-oxaloacetic transaminase 1, soluble (aspartate aminotransferase 1) (208813_at), score: 0.56
GSTT2glutathione S-transferase theta 2 (205439_at), score: -0.67
GTPBP2GTP binding protein 2 (221050_s_at), score: 0.59
HHLA3HERV-H LTR-associating 3 (220387_s_at), score: -0.62
HOXA7homeobox A7 (206848_at), score: 0.66
HSPB3heat shock 27kDa protein 3 (206375_s_at), score: -0.74
ID1inhibitor of DNA binding 1, dominant negative helix-loop-helix protein (208937_s_at), score: 0.7
IGF1insulin-like growth factor 1 (somatomedin C) (209541_at), score: 0.77
IL27RAinterleukin 27 receptor, alpha (205926_at), score: -0.82
ITIH5inter-alpha (globulin) inhibitor H5 (219064_at), score: 0.78
KCTD15potassium channel tetramerisation domain containing 15 (218553_s_at), score: 0.69
KLF5Kruppel-like factor 5 (intestinal) (209212_s_at), score: -0.75
LEPRleptin receptor (209894_at), score: -0.63
LEPREL2leprecan-like 2 (204854_at), score: -0.66
LETMD1LETM1 domain containing 1 (207170_s_at), score: -0.58
LHPPphospholysine phosphohistidine inorganic pyrophosphate phosphatase (218523_at), score: -0.65
LMF1lipase maturation factor 1 (219135_s_at), score: -0.66
LMOD1leiomodin 1 (smooth muscle) (203766_s_at), score: -0.67
LPCAT4lysophosphatidylcholine acyltransferase 4 (40472_at), score: -0.63
LUZP1leucine zipper protein 1 (221832_s_at), score: -0.57
MATN2matrilin 2 (202350_s_at), score: -0.58
MR1major histocompatibility complex, class I-related (207565_s_at), score: -0.65
NDUFA2NADH dehydrogenase (ubiquinone) 1 alpha subcomplex, 2, 8kDa (213550_s_at), score: -0.65
NME3non-metastatic cells 3, protein expressed in (204862_s_at), score: -0.79
NOTCH3Notch homolog 3 (Drosophila) (203238_s_at), score: -0.58
NRCAMneuronal cell adhesion molecule (204105_s_at), score: 0.92
OBFC1oligonucleotide/oligosaccharide-binding fold containing 1 (219100_at), score: -0.64
OCEL1occludin/ELL domain containing 1 (205441_at), score: -0.69
PALLDpalladin, cytoskeletal associated protein (200906_s_at), score: -0.58
PAPPA2pappalysin 2 (213332_at), score: 0.68
PCCApropionyl Coenzyme A carboxylase, alpha polypeptide (203860_at), score: -0.57
PCYOX1Lprenylcysteine oxidase 1 like (218953_s_at), score: -0.64
PDGFCplatelet derived growth factor C (218718_at), score: -0.63
PEX6peroxisomal biogenesis factor 6 (204545_at), score: -0.68
PLGLB2plasminogen-like B2 (205871_at), score: 0.72
PRELPproline/arginine-rich end leucine-rich repeat protein (204223_at), score: -0.7
PSMB9proteasome (prosome, macropain) subunit, beta type, 9 (large multifunctional peptidase 2) (204279_at), score: -0.66
PTERphosphotriesterase related (218967_s_at), score: 0.57
PYCARDPYD and CARD domain containing (221666_s_at), score: -0.57
RAGErenal tumor antigen (205130_at), score: -0.58
RALGPS2Ral GEF with PH domain and SH3 binding motif 2 (220338_at), score: 0.69
SCG5secretogranin V (7B2 protein) (203889_at), score: -0.6
SLC27A3solute carrier family 27 (fatty acid transporter), member 3 (222217_s_at), score: -0.57
SLC46A3solute carrier family 46, member 3 (214719_at), score: -0.65
SLC6A9solute carrier family 6 (neurotransmitter transporter, glycine), member 9 (207043_s_at), score: 0.63
SPINT2serine peptidase inhibitor, Kunitz type, 2 (210715_s_at), score: -0.63
SPON1spondin 1, extracellular matrix protein (209436_at), score: 0.92
STARD5StAR-related lipid transfer (START) domain containing 5 (213820_s_at), score: -0.84
STAT4signal transducer and activator of transcription 4 (206118_at), score: -0.65
TAP1transporter 1, ATP-binding cassette, sub-family B (MDR/TAP) (202307_s_at), score: -0.63
TAPBPTAP binding protein (tapasin) (208829_at), score: -0.59
TBX1T-box 1 (211273_s_at), score: -0.68
THYN1thymocyte nuclear protein 1 (218491_s_at), score: -0.58
TMEM176Btransmembrane protein 176B (220532_s_at), score: 0.59
TMEM187transmembrane protein 187 (204340_at), score: -0.66
TRAPPC6Atrafficking protein particle complex 6A (204985_s_at), score: -0.71
UBA7ubiquitin-like modifier activating enzyme 7 (203281_s_at), score: -0.67
UCP2uncoupling protein 2 (mitochondrial, proton carrier) (208998_at), score: -0.67
VAMP1vesicle-associated membrane protein 1 (synaptobrevin 1) (213326_at), score: -0.81
VCAM1vascular cell adhesion molecule 1 (203868_s_at), score: -0.67
VDRvitamin D (1,25- dihydroxyvitamin D3) receptor (204255_s_at), score: 0.58
WWC1WW and C2 domain containing 1 (213085_s_at), score: -0.57
Non-Entrez genes
Unknown, score:
HELP
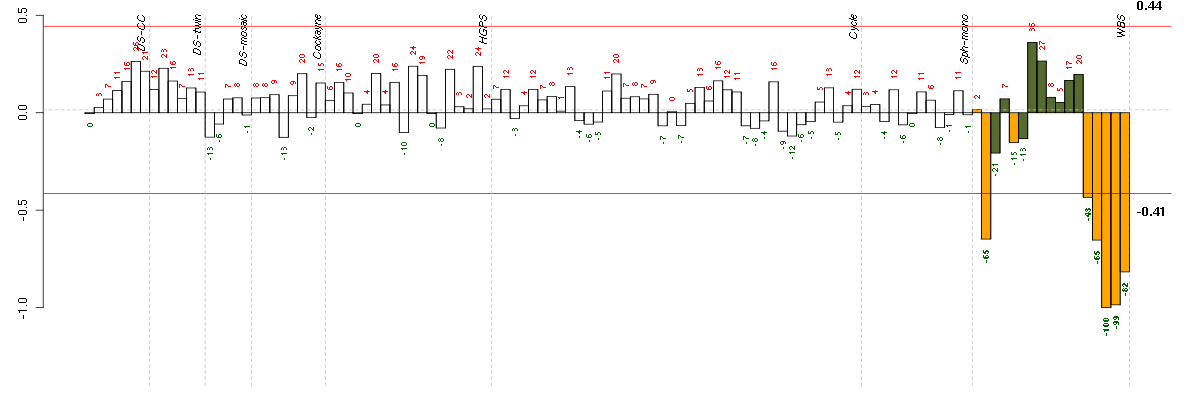
Conditions in the module, given in the same order as on the expression
plot above. Red color means over-expression, green under-expression in
the given condition.
The barplot below shows the condition (sample) scores. A separate bar
is shown for each sample, its height is the corresponding score of the
sample in the module. The red and green numbers on the bars are the
sample scores expressed in percents, i.e. 100% is 1.0.
The red and green lines show the module thresholds, samples above
the red line and below the green line are included in the module.
The different experiments that were part of the study, are separated
by dashed vertical lines.
— Click on the Help button again to close this help window.
| Id | sample | Experiment | ExpName | Array | Syndrome | Cell.line |
| F223_WBS.CEL | 15 | 8 | WBS | hgu133plus2 | WBS | WBS 1 |
| F348_WBS.CEL | 16 | 8 | WBS | hgu133plus2 | WBS | WBS 1 |
| H652_WBS.CEL | 17 | 8 | WBS | hgu133plus2 | WBS | WBS 1 |
| F055_WBS.CEL | 14 | 8 | WBS | hgu133plus2 | WBS | WBS 1 |
| 10590_WBS.CEL | 2 | 8 | WBS | hgu133plus2 | WBS | WBS 1 |
| D890_WBS.CEL | 13 | 8 | WBS | hgu133plus2 | WBS | WBS 1 |


© 2008-2010 Computational Biology Group, Department of Medical Genetics,
University of Lausanne, Switzerland