Previous module |
Next module
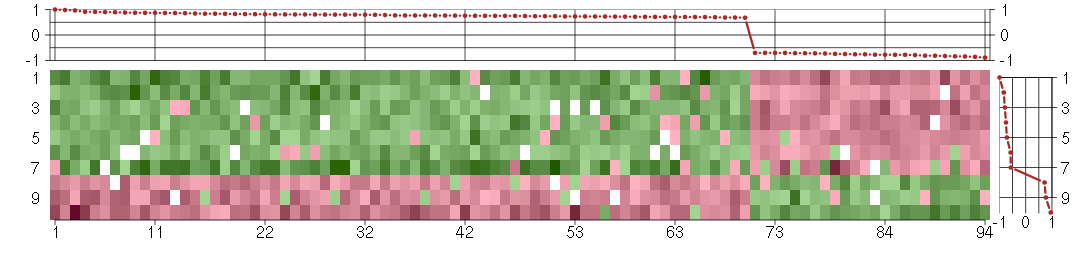
Module #657, TG: 2.8, TC: 1.6, 94 probes, 94 Entrez genes, 10 conditions


HELP
The image plot shows the color-coded level of gene expression, for the
genes and conditions in a given transcription module. The genes are on
the horizontal, the conditions on the vertical axis.
The genes are ordered according to their ISA gene scores, similarly
the conditions are ordered according to their condition scores. The
score of a gene means the «degree of inclusion» in
the module: a high score gene is essential in the module.
Condition scores can also be negative, that means that the genes of
the module are all down-regulated in the condition. Here the absolute
value of the score gives the «degree of inclusion».
The plots above and beside the expression matrix show the gene scores
and condition scores, respectively.
Note that the plot is interactive, you can see the name of the gene
and condition under the mouse cursor.
The expression matrix was normalized to have mean zero and standard
deviation one for every gene separately across all conditions
(i.e. not just for the conditions in the module).
— Click on the Help button again to close this help window.

Under-expression is coded with green,
over-expression with red color.
Help |
Hide |
Top
Help |
Show |
Top
The GO tree — Biological processes
HELP
This is one of three sections showing Gene Ontology enrichment of the
current module: in this case for biological processes.
The graph shows the hierarchy of the GO categories, their enrichment
for the current module is color coded, and the blue number beside the
category is the minus log ten p-value of the enrichment. (Calculated
using the standard hypergeometric test.) The color of the arrows code
«is a» (cyan) and «part of» relationships.
The tree was built the following way. First all GO terms with more
significant enrichment p-value than 0.05 were collected. Then all
paths from these terms to the root node of the GO tree were included
too. If a GO term is included more than once in the tree, then the
green numbers show 1) the id of the node, this makes it easier to find
other appereances of the term, and 2) the number of appearences.
Note that the same GO category might show up on the graph many
times. This is because the GO was «straightened» for this
graph, i.e. if there are more paths from a GO term to the root node of
the tree, all of them are included. The green numbers
Move the mouse cursor over the terms to get their definition. Clicking
on them takes you to the corresponding Gene Ontology web page.
If you cannot see a graph here at all, that means that there were no
significantly enriched GO categories, at the 0.05 level.
— Click on the Help button again to close this help window.

Help |
Hide |
Top
Help |
Show |
Top
The GO tree — Cellular Components
HELP
This is one of three sections showing Gene Ontology enrichment of the
current module: in this case for cellular components.
The graph shows the hierarchy of the GO categories, their enrichment
for the current module is color coded, and the blue number beside the
category is the minus log ten p-value of the enrichment. (Calculated
using the standard hypergeometric test.) The color of the arrows code
«is a» (cyan) and «part of» relationships.
The tree was built the following way. First all GO terms with more
significant enrichment p-value than 0.05 were collected. Then all
paths from these terms to the root node of the GO tree were included
too. If a GO term is included more than once in the tree, then the
green numbers show 1) the id of the node, this makes it easier to find
other appereances of the term, and 2) the number of appearences.
Note that the same GO category might show up on the graph many
times. This is because the GO was «straightened» for this
graph, i.e. if there are more paths from a GO term to the root node of
the tree, all of them are included. The green numbers
Move the mouse cursor over the terms to get their definition. Clicking
on them takes you to the corresponding Gene Ontology web page.
If you cannot see a graph here at all, that means that there were no
significantly enriched GO categories, at the 0.05 level.
— Click on the Help button again to close this help window.
Help |
Hide |
Top
Help |
Show |
Top
The GO tree — Molecular Function
HELP
This is one of three sections showing Gene Ontology enrichment of the
current module: in this case for molecular function.
The graph shows the hierarchy of the GO categories, their enrichment
for the current module is color coded, and the blue number beside the
category is the minus log ten p-value of the enrichment. (Calculated
using the standard hypergeometric test.) The color of the arrows code
«is a» (cyan) and «part of» relationships.
The tree was built the following way. First all GO terms with more
significant enrichment p-value than 0.05 were collected. Then all
paths from these terms to the root node of the GO tree were included
too. If a GO term is included more than once in the tree, then the
green numbers show 1) the id of the node, this makes it easier to find
other appereances of the term, and 2) the number of appearences.
Note that the same GO category might show up on the graph many
times. This is because the GO was «straightened» for this
graph, i.e. if there are more paths from a GO term to the root node of
the tree, all of them are included. The green numbers
Move the mouse cursor over the terms to get their definition. Clicking
on them takes you to the corresponding Gene Ontology web page.
If you cannot see a graph here at all, that means that there were no
significantly enriched GO categories, at the 0.05 level.
— Click on the Help button again to close this help window.
Help |
Hide |
Top
Help |
Show |
Top
GO BP test for over-representation
HELP
List of all enriched GO categories (biological processes), at the 0.05
p-value level.
The columns:
- ExpCount is the expected count of genes in the
module annotated with the given GO term, just by chance.
- Count
is the number of genes in the module annotated with the given GO
term.
- Size is the total number of genes (in our universe)
annotated with the GO term.
Clicking on Count shows the genes that drive the
enrichment. You can also click on the individual numbers in
the Count column, to show the driving genes for that individual
GO category.
Clicking on the GO identifiers takes you to the Gene Ontology web
pages.
— Click on the Help button again to close this help window.
Help |
Hide |
Top
Help |
Show |
Top
GO CC test for over-representation
HELP
List of all enriched GO categories (cellular components), at the 0.05
p-value level.
The columns:
- ExpCount is the expected count of genes in the
module annotated with the given GO term, just by chance.
- Count
is the number of genes in the module annotated with the given GO
term.
- Size is the total number of genes (in our universe)
annotated with the GO term.
Clicking on Count shows the genes that drive the
enrichment. You can also click on the individual numbers in
the Count column, to show the driving genes for that individual
GO category.
Clicking on the GO identifiers takes you to the Gene Ontology web
pages.
— Click on the Help button again to close this help window.
| Id | Pvalue | ExpCount | Count | Size | Term |
| GO:0005886 | 4.030e-02 | 14.74 | 26
ABCA7, ACTN3, ADORA1, ALPPL2, APP, BCAM, CD79B, CHRNB2, CNNM1, EPM2A, FLRT3, GPR144, ITGAL, JUP, KCTD15, LILRB3, PARD6A, PXN, RASGRP3, SIGLEC1, SLC5A5, SLC6A11, SLCO2A1, STIM1, TMPRSS6, TNFRSF8 | 1443 | plasma membrane |
Help |
Hide |
Top
Help |
Show |
Top
GO MF test for over-representation
HELP
List of all enriched GO categories (molecular function), at the 0.05
p-value level.
The columns:
- ExpCount is the expected count of genes in the
module annotated with the given GO term, just by chance.
- Count
is the number of genes in the module annotated with the given GO
term.
- Size is the total number of genes (in our universe)
annotated with the GO term.
Clicking on Count shows the genes that drive the
enrichment. You can also click on the individual numbers in
the Count column, to show the driving genes for that individual
GO category.
Clicking on the GO identifiers takes you to the Gene Ontology web
pages.
— Click on the Help button again to close this help window.
Help |
Hide |
Top
Help |
Show |
Top
KEGG Pathway test for over-representation
HELP
List of all enriched KEGG pathways, at the 0.05
p-value level.
The columns:
- ExpCount is the expected count of genes in the
module annotated with the given KEGG pathway, just by chance.
- Count
is the number of genes in the module annotated with the given KEGG
pathway.
- Size is the total number of genes (in our universe)
annotated with the KEGG pathway.
Clicking on Count shows the genes that drive the
enrichment. You can also click on the individual numbers in
the Count column, to show the driving genes for that individual
KEGG pathway.
Clicking on the KEGG identifiers takes you to the KEGG web site.
— Click on the Help button again to close this help window.
Help |
Hide |
Top
Help |
Show |
Top
miRNA test for over-representation
HELP
List of all enriched miRNA families, at the 0.05
p-value level.
The columns:
- ExpCount is the expected count of genes in the
module regulated by the given miRNA family, just by chance.
- Count
is the number of genes in the module regulated by the given miRNA
family.
- Size is the total number of genes (in our universe)
regulated with the given miRNA family.
Clicking on Count shows the genes that drive the
enrichment. You can also click on the individual numbers in
the Count column, to show the driving genes for that individual
miRNA family.
The miRNA regulation data was taken from the TargetScan database.
(Only the conserved sites were used for the current analysis.)
Clicking on the miRNA names takes you to the TargetScan web site.
— Click on the Help button again to close this help window.
Help |
Hide |
Top
Help |
Show |
Top
Chromosome test for over-representation
HELP
List of all enriched Chromosomes, at the 0.05
p-value level.
The columns:
- ExpCount is the expected number of genes in the
module on the given chromosome, just by chance.
- Count
is the number of genes in the module on the given chromosome.
- Size is the total number of genes (in our universe)
on the given chromosome.
Clicking on Count shows the genes that drive the
enrichment. You can also click on the individual numbers in
the Count column, to show the driving genes for that individual
chromosome.
— Click on the Help button again to close this help window.
HELP
A list of all genes in the current module, in alphabetical order. The
size of the text corresponds to the gene scores.
Note that some gene symbols may show up more than once, if many
probes match the same Entrez gene.
Genes with no Entrez mapping are given separately, with their
Affymetrics probe ID.
— Click on the Help button again to close this help window.
Entrez genes
ABCA7ATP-binding cassette, sub-family A (ABC1), member 7 (219577_s_at), score: 0.96
ACTN3actinin, alpha 3 (206891_at), score: 0.75
ADAMTS7ADAM metallopeptidase with thrombospondin type 1 motif, 7 (220705_s_at), score: 0.76
ADORA1adenosine A1 receptor (216220_s_at), score: 0.77
ALDH1L1aldehyde dehydrogenase 1 family, member L1 (215798_at), score: 0.69
ALPPL2alkaline phosphatase, placental-like 2 (216377_x_at), score: 0.8
APPamyloid beta (A4) precursor protein (214953_s_at), score: 0.69
ASPHD1aspartate beta-hydroxylase domain containing 1 (214993_at), score: 0.73
ATMataxia telangiectasia mutated (210858_x_at), score: 0.82
BAT2HLA-B associated transcript 2 (212081_x_at), score: -0.7
BCAMbasal cell adhesion molecule (Lutheran blood group) (40093_at), score: 0.74
BCL2L1BCL2-like 1 (215037_s_at), score: -0.71
C2orf37chromosome 2 open reading frame 37 (220172_at), score: -0.84
C7orf58chromosome 7 open reading frame 58 (220032_at), score: -0.78
CCDC40coiled-coil domain containing 40 (220592_at), score: 0.88
CD79BCD79b molecule, immunoglobulin-associated beta (205297_s_at), score: 1
CHRNB2cholinergic receptor, nicotinic, beta 2 (neuronal) (206635_at), score: 0.84
CNNM1cyclin M1 (220166_at), score: 0.74
CNOT3CCR4-NOT transcription complex, subunit 3 (203239_s_at), score: -0.7
COX6A2cytochrome c oxidase subunit VIa polypeptide 2 (206353_at), score: 0.71
CPNE3copine III (202118_s_at), score: -0.72
CYTH4cytohesin 4 (219183_s_at), score: 0.68
DMBT1deleted in malignant brain tumors 1 (208250_s_at), score: 0.81
DSCR6Down syndrome critical region gene 6 (207267_s_at), score: -0.74
DSPPdentin sialophosphoprotein (221681_s_at), score: 0.86
EPM2Aepilepsy, progressive myoclonus type 2A, Lafora disease (laforin) (205231_s_at), score: 0.81
FBP1fructose-1,6-bisphosphatase 1 (209696_at), score: 0.7
FGL1fibrinogen-like 1 (205305_at), score: 0.76
FKBP10FK506 binding protein 10, 65 kDa (219249_s_at), score: 0.91
FKRPfukutin related protein (219853_at), score: -0.7
FLRT3fibronectin leucine rich transmembrane protein 3 (219250_s_at), score: -0.73
FOXK2forkhead box K2 (203064_s_at), score: -0.75
GABARAPL3GABA(A) receptors associated protein like 3 (pseudogene) (211458_s_at), score: 0.73
GBA3glucosidase, beta, acid 3 (cytosolic) (219954_s_at), score: 0.75
GDF9growth differentiation factor 9 (221314_at), score: 0.77
GNL3LPguanine nucleotide binding protein-like 3 (nucleolar)-like pseudogene (220716_at), score: 0.81
GPR144G protein-coupled receptor 144 (216289_at), score: 0.87
HAB1B1 for mucin (215778_x_at), score: 0.98
HAMPhepcidin antimicrobial peptide (220491_at), score: 0.86
HAND1heart and neural crest derivatives expressed 1 (220138_at), score: 0.72
HMGA1high mobility group AT-hook 1 (210457_x_at), score: -0.76
IFT140intraflagellar transport 140 homolog (Chlamydomonas) (204792_s_at), score: 0.74
INAinternexin neuronal intermediate filament protein, alpha (204465_s_at), score: -0.86
INE1inactivation escape 1 (non-protein coding) (207252_at), score: 0.75
ITGALintegrin, alpha L (antigen CD11A (p180), lymphocyte function-associated antigen 1; alpha polypeptide) (213475_s_at), score: 0.81
JUPjunction plakoglobin (201015_s_at), score: -0.79
KCTD15potassium channel tetramerisation domain containing 15 (218553_s_at), score: 0.76
KIF26Bkinesin family member 26B (220002_at), score: 0.8
LILRB3leukocyte immunoglobulin-like receptor, subfamily B (with TM and ITIM domains), member 3 (211133_x_at), score: 0.91
LOC100129500hypothetical protein LOC100129500 (212884_x_at), score: 0.75
LOC100133748similar to GTF2IRD2 protein (215569_at), score: 0.77
LOC149501similar to keratin 8 (216821_at), score: 0.87
MDM2Mdm2 p53 binding protein homolog (mouse) (205386_s_at), score: -0.81
MOCS1molybdenum cofactor synthesis 1 (211673_s_at), score: 0.8
MRPS6mitochondrial ribosomal protein S6 (213167_s_at), score: -0.89
MUC5ACmucin 5AC, oligomeric mucus/gel-forming (217182_at), score: 0.77
NDPNorrie disease (pseudoglioma) (206022_at), score: -0.82
NOVA2neuro-oncological ventral antigen 2 (206477_s_at), score: 0.82
NXPH3neurexophilin 3 (221991_at), score: 0.79
OAS32'-5'-oligoadenylate synthetase 3, 100kDa (218400_at), score: -0.76
OLFML2Bolfactomedin-like 2B (213125_at), score: -0.81
PARD6Apar-6 partitioning defective 6 homolog alpha (C. elegans) (205245_at), score: 0.75
PDE5Aphosphodiesterase 5A, cGMP-specific (206757_at), score: -0.77
PKLRpyruvate kinase, liver and RBC (222078_at), score: 0.86
PMS2L2postmeiotic segregation increased 2-like 2 pseudogene (215410_at), score: 0.8
PPP1R13Bprotein phosphatase 1, regulatory (inhibitor) subunit 13B (216347_s_at), score: 0.83
PTPN6protein tyrosine phosphatase, non-receptor type 6 (206687_s_at), score: 0.87
PXNpaxillin (211823_s_at), score: -0.84
RASGRP3RAS guanyl releasing protein 3 (calcium and DAG-regulated) (205801_s_at), score: -0.77
RBM38RNA binding motif protein 38 (212430_at), score: 0.82
REG3Aregenerating islet-derived 3 alpha (205815_at), score: 0.72
RNF121ring finger protein 121 (219021_at), score: 0.73
RPL18AP6ribosomal protein L18a pseudogene 6 (216383_at), score: 0.72
SAA4serum amyloid A4, constitutive (207096_at), score: 0.83
SDPRserum deprivation response (phosphatidylserine binding protein) (218711_s_at), score: -0.7
SH2D3ASH2 domain containing 3A (222169_x_at), score: 0.71
SIGLEC1sialic acid binding Ig-like lectin 1, sialoadhesin (44673_at), score: 0.8
SIRT6sirtuin (silent mating type information regulation 2 homolog) 6 (S. cerevisiae) (219613_s_at), score: -0.78
SLC5A5solute carrier family 5 (sodium iodide symporter), member 5 (211123_at), score: 0.78
SLC6A11solute carrier family 6 (neurotransmitter transporter, GABA), member 11 (207048_at), score: 0.9
SLCO2A1solute carrier organic anion transporter family, member 2A1 (204368_at), score: 0.71
SSX3synovial sarcoma, X breakpoint 3 (211731_x_at), score: 0.8
ST8SIA3ST8 alpha-N-acetyl-neuraminide alpha-2,8-sialyltransferase 3 (208064_s_at), score: 0.89
STIM1stromal interaction molecule 1 (202764_at), score: -0.71
TAF15TAF15 RNA polymerase II, TATA box binding protein (TBP)-associated factor, 68kDa (202840_at), score: 0.74
TMPRSS6transmembrane protease, serine 6 (214955_at), score: 0.77
TMSB4Ythymosin beta 4, Y-linked (206769_at), score: 0.73
TNFRSF8tumor necrosis factor receptor superfamily, member 8 (206729_at), score: 0.71
TNK1tyrosine kinase, non-receptor, 1 (217149_x_at), score: 0.79
TP53TG1TP53 target 1 (non-protein coding) (210241_s_at), score: 0.7
TULP2tubby like protein 2 (206733_at), score: 0.83
WFDC8WAP four-disulfide core domain 8 (215276_at), score: 0.71
YPEL1yippee-like 1 (Drosophila) (206063_x_at), score: 0.71
ZNF783zinc finger family member 783 (221876_at), score: 0.71
Non-Entrez genes
Unknown, score:
HELP
Conditions in the module, given in the same order as on the expression
plot above. Red color means over-expression, green under-expression in
the given condition.
The barplot below shows the condition (sample) scores. A separate bar
is shown for each sample, its height is the corresponding score of the
sample in the module. The red and green numbers on the bars are the
sample scores expressed in percents, i.e. 100% is 1.0.
The red and green lines show the module thresholds, samples above
the red line and below the green line are included in the module.
The different experiments that were part of the study, are separated
by dashed vertical lines.
— Click on the Help button again to close this help window.
| Id | sample | Experiment | ExpName | Array | Syndrome | Cell.line |
| E-TABM-263-raw-cel-1515485711.cel | 4 | 6 | Cycle | hgu133a2 | none | Cycle 1 |
| E-TABM-263-raw-cel-1515485951.cel | 16 | 6 | Cycle | hgu133a2 | none | Cycle 1 |
| E-TABM-263-raw-cel-1515485871.cel | 12 | 6 | Cycle | hgu133a2 | none | Cycle 1 |
| E-TABM-263-raw-cel-1515485691.cel | 3 | 6 | Cycle | hgu133a2 | none | Cycle 1 |
| E-TABM-263-raw-cel-1515486171.cel | 27 | 6 | Cycle | hgu133a2 | none | Cycle 1 |
| E-TABM-263-raw-cel-1515485791.cel | 8 | 6 | Cycle | hgu133a2 | none | Cycle 1 |
| E-TABM-263-raw-cel-1515485911.cel | 14 | 6 | Cycle | hgu133a2 | none | Cycle 1 |
| E-TABM-263-raw-cel-1515486431.cel | 40 | 6 | Cycle | hgu133a2 | none | Cycle 1 |
| E-TABM-263-raw-cel-1515485931.cel | 15 | 6 | Cycle | hgu133a2 | none | Cycle 1 |
| E-TABM-263-raw-cel-1515485671.cel | 2 | 6 | Cycle | hgu133a2 | none | Cycle 1 |


© 2008-2010 Computational Biology Group, Department of Medical Genetics,
University of Lausanne, Switzerland