Previous module |
Next module
Module #665, TG: 2.8, TC: 1.6, 64 probes, 64 Entrez genes, 14 conditions


HELP
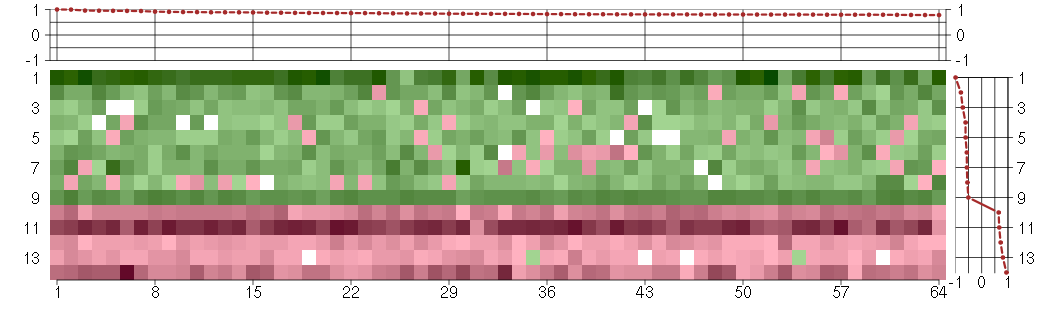
The image plot shows the color-coded level of gene expression, for the
genes and conditions in a given transcription module. The genes are on
the horizontal, the conditions on the vertical axis.
The genes are ordered according to their ISA gene scores, similarly
the conditions are ordered according to their condition scores. The
score of a gene means the «degree of inclusion» in
the module: a high score gene is essential in the module.
Condition scores can also be negative, that means that the genes of
the module are all down-regulated in the condition. Here the absolute
value of the score gives the «degree of inclusion».
The plots above and beside the expression matrix show the gene scores
and condition scores, respectively.
Note that the plot is interactive, you can see the name of the gene
and condition under the mouse cursor.
The expression matrix was normalized to have mean zero and standard
deviation one for every gene separately across all conditions
(i.e. not just for the conditions in the module).
— Click on the Help button again to close this help window.

Under-expression is coded with green,
over-expression with red color.
Help |
Hide |
Top
Help |
Show |
Top
The GO tree — Biological processes
HELP
This is one of three sections showing Gene Ontology enrichment of the
current module: in this case for biological processes.
The graph shows the hierarchy of the GO categories, their enrichment
for the current module is color coded, and the blue number beside the
category is the minus log ten p-value of the enrichment. (Calculated
using the standard hypergeometric test.) The color of the arrows code
«is a» (cyan) and «part of» relationships.
The tree was built the following way. First all GO terms with more
significant enrichment p-value than 0.05 were collected. Then all
paths from these terms to the root node of the GO tree were included
too. If a GO term is included more than once in the tree, then the
green numbers show 1) the id of the node, this makes it easier to find
other appereances of the term, and 2) the number of appearences.
Note that the same GO category might show up on the graph many
times. This is because the GO was «straightened» for this
graph, i.e. if there are more paths from a GO term to the root node of
the tree, all of them are included. The green numbers
Move the mouse cursor over the terms to get their definition. Clicking
on them takes you to the corresponding Gene Ontology web page.
If you cannot see a graph here at all, that means that there were no
significantly enriched GO categories, at the 0.05 level.
— Click on the Help button again to close this help window.

Help |
Hide |
Top
Help |
Show |
Top
The GO tree — Cellular Components
HELP
This is one of three sections showing Gene Ontology enrichment of the
current module: in this case for cellular components.
The graph shows the hierarchy of the GO categories, their enrichment
for the current module is color coded, and the blue number beside the
category is the minus log ten p-value of the enrichment. (Calculated
using the standard hypergeometric test.) The color of the arrows code
«is a» (cyan) and «part of» relationships.
The tree was built the following way. First all GO terms with more
significant enrichment p-value than 0.05 were collected. Then all
paths from these terms to the root node of the GO tree were included
too. If a GO term is included more than once in the tree, then the
green numbers show 1) the id of the node, this makes it easier to find
other appereances of the term, and 2) the number of appearences.
Note that the same GO category might show up on the graph many
times. This is because the GO was «straightened» for this
graph, i.e. if there are more paths from a GO term to the root node of
the tree, all of them are included. The green numbers
Move the mouse cursor over the terms to get their definition. Clicking
on them takes you to the corresponding Gene Ontology web page.
If you cannot see a graph here at all, that means that there were no
significantly enriched GO categories, at the 0.05 level.
— Click on the Help button again to close this help window.
Help |
Hide |
Top
Help |
Show |
Top
The GO tree — Molecular Function
HELP
This is one of three sections showing Gene Ontology enrichment of the
current module: in this case for molecular function.
The graph shows the hierarchy of the GO categories, their enrichment
for the current module is color coded, and the blue number beside the
category is the minus log ten p-value of the enrichment. (Calculated
using the standard hypergeometric test.) The color of the arrows code
«is a» (cyan) and «part of» relationships.
The tree was built the following way. First all GO terms with more
significant enrichment p-value than 0.05 were collected. Then all
paths from these terms to the root node of the GO tree were included
too. If a GO term is included more than once in the tree, then the
green numbers show 1) the id of the node, this makes it easier to find
other appereances of the term, and 2) the number of appearences.
Note that the same GO category might show up on the graph many
times. This is because the GO was «straightened» for this
graph, i.e. if there are more paths from a GO term to the root node of
the tree, all of them are included. The green numbers
Move the mouse cursor over the terms to get their definition. Clicking
on them takes you to the corresponding Gene Ontology web page.
If you cannot see a graph here at all, that means that there were no
significantly enriched GO categories, at the 0.05 level.
— Click on the Help button again to close this help window.
Help |
Hide |
Top
Help |
Show |
Top
GO BP test for over-representation
HELP
List of all enriched GO categories (biological processes), at the 0.05
p-value level.
The columns:
- ExpCount is the expected count of genes in the
module annotated with the given GO term, just by chance.
- Count
is the number of genes in the module annotated with the given GO
term.
- Size is the total number of genes (in our universe)
annotated with the GO term.
Clicking on Count shows the genes that drive the
enrichment. You can also click on the individual numbers in
the Count column, to show the driving genes for that individual
GO category.
Clicking on the GO identifiers takes you to the Gene Ontology web
pages.
— Click on the Help button again to close this help window.
| Id | Pvalue | ExpCount | Count | Size | Term |
| GO:0001754 | 2.695e-02 | 0.03221 | 2
NTRK2, RPGRIP1 | 5 | eye photoreceptor cell differentiation |
| GO:0042462 | 2.695e-02 | 0.03221 | 2
NTRK2, RPGRIP1 | 5 | eye photoreceptor cell development |
| GO:0003008 | 3.246e-02 | 2.938 | 10
AIPL1, BMP10, COL11A2, DRD5, KCNQ3, MAL, MYL4, NTRK2, OR7E24, RPGRIP1 | 456 | system process |
| GO:0042461 | 3.570e-02 | 0.03865 | 2
NTRK2, RPGRIP1 | 6 | photoreceptor cell development |
| GO:0032501 | 3.677e-02 | 10.62 | 21
AIPL1, BMP10, COL11A2, CTSE, DRD5, EDAR, KCNQ3, KLF1, KRT2, LHX3, MAL, MFNG, MOBP, MYL4, NTRK2, OR7E24, PGC, RET, RPGRIP1, TBX21, VGF | 1648 | multicellular organismal process |
| GO:0046530 | 4.426e-02 | 0.04509 | 2
NTRK2, RPGRIP1 | 7 | photoreceptor cell differentiation |
Help |
Hide |
Top
Help |
Show |
Top
GO CC test for over-representation
HELP
List of all enriched GO categories (cellular components), at the 0.05
p-value level.
The columns:
- ExpCount is the expected count of genes in the
module annotated with the given GO term, just by chance.
- Count
is the number of genes in the module annotated with the given GO
term.
- Size is the total number of genes (in our universe)
annotated with the GO term.
Clicking on Count shows the genes that drive the
enrichment. You can also click on the individual numbers in
the Count column, to show the driving genes for that individual
GO category.
Clicking on the GO identifiers takes you to the Gene Ontology web
pages.
— Click on the Help button again to close this help window.
Help |
Hide |
Top
Help |
Show |
Top
GO MF test for over-representation
HELP
List of all enriched GO categories (molecular function), at the 0.05
p-value level.
The columns:
- ExpCount is the expected count of genes in the
module annotated with the given GO term, just by chance.
- Count
is the number of genes in the module annotated with the given GO
term.
- Size is the total number of genes (in our universe)
annotated with the GO term.
Clicking on Count shows the genes that drive the
enrichment. You can also click on the individual numbers in
the Count column, to show the driving genes for that individual
GO category.
Clicking on the GO identifiers takes you to the Gene Ontology web
pages.
— Click on the Help button again to close this help window.
| Id | Pvalue | ExpCount | Count | Size | Term |
| GO:0019911 | 2.209e-02 | 0.02483 | 2
MAL, MOBP | 4 | structural constituent of myelin sheath |
| GO:0008146 | 3.108e-02 | 0.1428 | 3
CHST4, HS3ST2, SULT1B1 | 23 | sulfotransferase activity |
| GO:0016712 | 4.149e-02 | 0.03725 | 2
CYP2A6, CYP3A4 | 6 | oxidoreductase activity, acting on paired donors, with incorporation or reduction of molecular oxygen, reduced flavin or flavoprotein as one donor, and incorporation of one atom of oxygen |
| GO:0016782 | 4.633e-02 | 0.1738 | 3
CHST4, HS3ST2, SULT1B1 | 28 | transferase activity, transferring sulfur-containing groups |
Help |
Hide |
Top
Help |
Show |
Top
KEGG Pathway test for over-representation
HELP
List of all enriched KEGG pathways, at the 0.05
p-value level.
The columns:
- ExpCount is the expected count of genes in the
module annotated with the given KEGG pathway, just by chance.
- Count
is the number of genes in the module annotated with the given KEGG
pathway.
- Size is the total number of genes (in our universe)
annotated with the KEGG pathway.
Clicking on Count shows the genes that drive the
enrichment. You can also click on the individual numbers in
the Count column, to show the driving genes for that individual
KEGG pathway.
Clicking on the KEGG identifiers takes you to the KEGG web site.
— Click on the Help button again to close this help window.
| Id | Pvalue | ExpCount | Count | Size | Term |
| 00830 | 3.025e-02 | 0.1603 | 3
CYP2A6, CYP3A4, DHRS9 | 23 | Retinol metabolism |
Help |
Hide |
Top
Help |
Show |
Top
miRNA test for over-representation
HELP
List of all enriched miRNA families, at the 0.05
p-value level.
The columns:
- ExpCount is the expected count of genes in the
module regulated by the given miRNA family, just by chance.
- Count
is the number of genes in the module regulated by the given miRNA
family.
- Size is the total number of genes (in our universe)
regulated with the given miRNA family.
Clicking on Count shows the genes that drive the
enrichment. You can also click on the individual numbers in
the Count column, to show the driving genes for that individual
miRNA family.
The miRNA regulation data was taken from the TargetScan database.
(Only the conserved sites were used for the current analysis.)
Clicking on the miRNA names takes you to the TargetScan web site.
— Click on the Help button again to close this help window.
Help |
Hide |
Top
Help |
Show |
Top
Chromosome test for over-representation
HELP
List of all enriched Chromosomes, at the 0.05
p-value level.
The columns:
- ExpCount is the expected number of genes in the
module on the given chromosome, just by chance.
- Count
is the number of genes in the module on the given chromosome.
- Size is the total number of genes (in our universe)
on the given chromosome.
Clicking on Count shows the genes that drive the
enrichment. You can also click on the individual numbers in
the Count column, to show the driving genes for that individual
chromosome.
— Click on the Help button again to close this help window.
HELP
A list of all genes in the current module, in alphabetical order. The
size of the text corresponds to the gene scores.
Note that some gene symbols may show up more than once, if many
probes match the same Entrez gene.
Genes with no Entrez mapping are given separately, with their
Affymetrics probe ID.
— Click on the Help button again to close this help window.
Entrez genes
A1CFAPOBEC1 complementation factor (220951_s_at), score: 0.95
AIPL1aryl hydrocarbon receptor interacting protein-like 1 (219977_at), score: 0.86
BMP10bone morphogenetic protein 10 (208292_at), score: 0.81
BTNL3butyrophilin-like 3 (217207_s_at), score: 1
C1orf61chromosome 1 open reading frame 61 (205103_at), score: 0.86
C7orf28Achromosome 7 open reading frame 28A (201974_s_at), score: 0.8
C8orf17chromosome 8 open reading frame 17 (208266_at), score: 0.84
C8orf60chromosome 8 open reading frame 60 (220712_at), score: 0.89
CD53CD53 molecule (203416_at), score: 0.8
CEACAM6carcinoembryonic antigen-related cell adhesion molecule 6 (non-specific cross reacting antigen) (211657_at), score: 0.82
CHST4carbohydrate (N-acetylglucosamine 6-O) sulfotransferase 4 (220446_s_at), score: 0.87
CLDN10claudin 10 (205328_at), score: 0.84
COL11A2collagen, type XI, alpha 2 (216993_s_at), score: 0.9
CTSEcathepsin E (205927_s_at), score: 0.83
CYP2A6cytochrome P450, family 2, subfamily A, polypeptide 6 (211295_x_at), score: 0.8
CYP3A4cytochrome P450, family 3, subfamily A, polypeptide 4 (205998_x_at), score: 0.78
DHRS9dehydrogenase/reductase (SDR family) member 9 (219799_s_at), score: 0.79
DMBT1deleted in malignant brain tumors 1 (208250_s_at), score: 0.8
DNASE1L3deoxyribonuclease I-like 3 (205554_s_at), score: 0.91
DRD5dopamine receptor D5 (208486_at), score: 0.88
EDARectodysplasin A receptor (220048_at), score: 0.85
FAM38Bfamily with sequence similarity 38, member B (219602_s_at), score: 0.8
FGL1fibrinogen-like 1 (205305_at), score: 0.83
FOLH1folate hydrolase (prostate-specific membrane antigen) 1 (217487_x_at), score: 0.81
GPATCH4G patch domain containing 4 (220596_at), score: 0.79
HAB1B1 for mucin (215778_x_at), score: 0.85
HAO2hydroxyacid oxidase 2 (long chain) (220801_s_at), score: 0.8
HIST1H4Dhistone cluster 1, H4d (208076_at), score: 0.79
HS3ST2heparan sulfate (glucosamine) 3-O-sulfotransferase 2 (219697_at), score: 0.8
KCNQ3potassium voltage-gated channel, KQT-like subfamily, member 3 (206573_at), score: 0.83
KIR3DX1killer cell immunoglobulin-like receptor, three domains, X1 (216428_x_at), score: 0.8
KLF1Kruppel-like factor 1 (erythroid) (210504_at), score: 0.82
KMOkynurenine 3-monooxygenase (kynurenine 3-hydroxylase) (205307_s_at), score: 0.86
KRT2keratin 2 (207908_at), score: 0.79
LHX3LIM homeobox 3 (221670_s_at), score: 0.94
LOC100188945cell division cycle associated 4 pseudogene (215109_at), score: 0.81
LRRN2leucine rich repeat neuronal 2 (216164_at), score: 0.83
MALmal, T-cell differentiation protein (204777_s_at), score: 0.81
MFNGMFNG O-fucosylpeptide 3-beta-N-acetylglucosaminyltransferase (204153_s_at), score: 0.85
MOBPmyelin-associated oligodendrocyte basic protein (210193_at), score: 0.96
MYL4myosin, light chain 4, alkali; atrial, embryonic (210088_x_at), score: 0.86
MYO5Cmyosin VC (218966_at), score: 0.79
N4BP3Nedd4 binding protein 3 (214775_at), score: 0.86
NCRNA00092non-protein coding RNA 92 (215861_at), score: 0.8
NTRK2neurotrophic tyrosine kinase, receptor, type 2 (207152_at), score: 0.82
OR7E24olfactory receptor, family 7, subfamily E, member 24 (215463_at), score: 0.9
PECAM1platelet/endothelial cell adhesion molecule (208982_at), score: 1
PGCprogastricsin (pepsinogen C) (205261_at), score: 0.81
PGK2phosphoglycerate kinase 2 (217009_at), score: 0.82
PRB3proline-rich protein BstNI subfamily 3 (206998_x_at), score: 0.81
PRSS7protease, serine, 7 (enterokinase) (217269_s_at), score: 0.83
PYHIN1pyrin and HIN domain family, member 1 (216748_at), score: 0.83
RETret proto-oncogene (205879_x_at), score: 0.92
RICH2Rho-type GTPase-activating protein RICH2 (215232_at), score: 0.78
RP3-377H14.5hypothetical LOC285830 (222279_at), score: 0.8
RPGRIP1retinitis pigmentosa GTPase regulator interacting protein 1 (206608_s_at), score: 0.88
S100A14S100 calcium binding protein A14 (218677_at), score: 0.89
SLC10A1solute carrier family 10 (sodium/bile acid cotransporter family), member 1 (207185_at), score: 0.81
SLC1A7solute carrier family 1 (glutamate transporter), member 7 (210923_at), score: 0.81
SLC26A10solute carrier family 26, member 10 (214951_at), score: 0.89
SULT1B1sulfotransferase family, cytosolic, 1B, member 1 (207601_at), score: 0.79
TBX21T-box 21 (220684_at), score: 0.95
TMSB4Ythymosin beta 4, Y-linked (206769_at), score: 0.87
VGFVGF nerve growth factor inducible (205586_x_at), score: 0.94
Non-Entrez genes
Unknown, score:
HELP
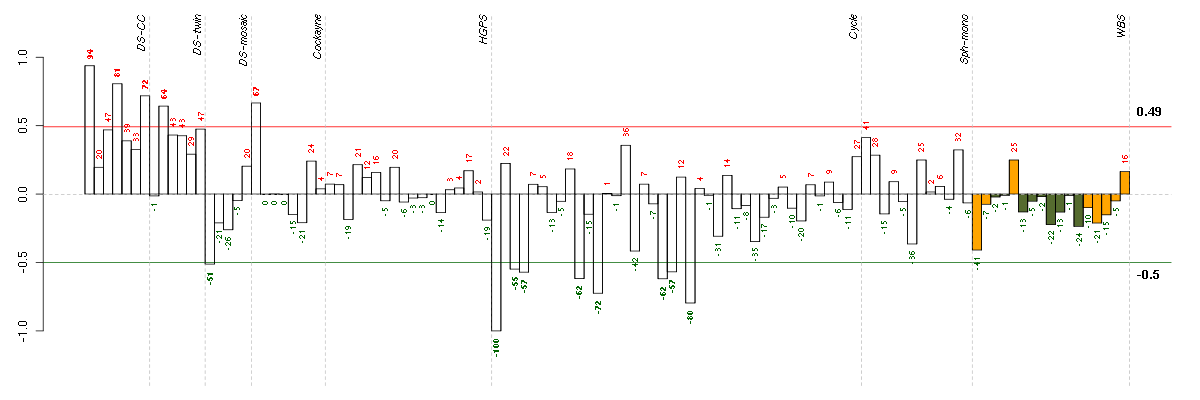
Conditions in the module, given in the same order as on the expression
plot above. Red color means over-expression, green under-expression in
the given condition.
The barplot below shows the condition (sample) scores. A separate bar
is shown for each sample, its height is the corresponding score of the
sample in the module. The red and green numbers on the bars are the
sample scores expressed in percents, i.e. 100% is 1.0.
The red and green lines show the module thresholds, samples above
the red line and below the green line are included in the module.
The different experiments that were part of the study, are separated
by dashed vertical lines.
— Click on the Help button again to close this help window.
| Id | sample | Experiment | ExpName | Array | Syndrome | Cell.line |
| E-TABM-263-raw-cel-1515485651.cel | 1 | 6 | Cycle | hgu133a2 | none | Cycle 1 |
| E-TABM-263-raw-cel-1515486071.cel | 22 | 6 | Cycle | hgu133a2 | none | Cycle 1 |
| E-TABM-263-raw-cel-1515485871.cel | 12 | 6 | Cycle | hgu133a2 | none | Cycle 1 |
| E-TABM-263-raw-cel-1515486011.cel | 19 | 6 | Cycle | hgu133a2 | none | Cycle 1 |
| E-TABM-263-raw-cel-1515485831.cel | 10 | 6 | Cycle | hgu133a2 | none | Cycle 1 |
| E-TABM-263-raw-cel-1515485711.cel | 4 | 6 | Cycle | hgu133a2 | none | Cycle 1 |
| E-TABM-263-raw-cel-1515486031.cel | 20 | 6 | Cycle | hgu133a2 | none | Cycle 1 |
| E-TABM-263-raw-cel-1515485691.cel | 3 | 6 | Cycle | hgu133a2 | none | Cycle 1 |
| 46A.CEL | 1 | 3 | DS-mosaic | hgu133plus2 | none | DS-mosaic 1 |
| 2Twin.CEL | 2 | 2 | DS-twin | hgu133plus2 | none | DS-twin 2 |
| E-GEOD-3407-raw-cel-1437949557.cel | 1 | 4 | Cockayne | hgu133a | CS | eGFP |
| t21d 08-03.CEL | 7 | 1 | DS-CC | hgu133a | Down | DS-CC 7 |
| t21a 08-03.CEL | 4 | 1 | DS-CC | hgu133a | Down | DS-CC 4 |
| ctrl a 08-03.CEL | 1 | 1 | DS-CC | hgu133a | none | DS-CC 1 |


© 2008-2010 Computational Biology Group, Department of Medical Genetics,
University of Lausanne, Switzerland