Previous module |
Next module
Module #745, TG: 2.6, TC: 1.6, 98 probes, 98 Entrez genes, 15 conditions


HELP
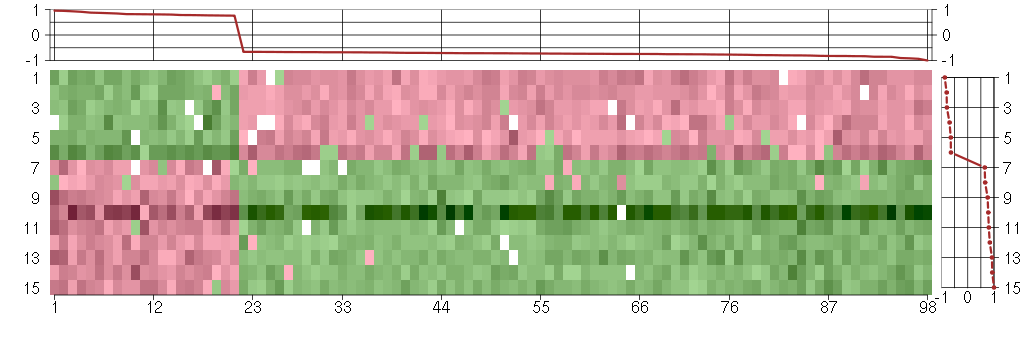
The image plot shows the color-coded level of gene expression, for the
genes and conditions in a given transcription module. The genes are on
the horizontal, the conditions on the vertical axis.
The genes are ordered according to their ISA gene scores, similarly
the conditions are ordered according to their condition scores. The
score of a gene means the «degree of inclusion» in
the module: a high score gene is essential in the module.
Condition scores can also be negative, that means that the genes of
the module are all down-regulated in the condition. Here the absolute
value of the score gives the «degree of inclusion».
The plots above and beside the expression matrix show the gene scores
and condition scores, respectively.
Note that the plot is interactive, you can see the name of the gene
and condition under the mouse cursor.
The expression matrix was normalized to have mean zero and standard
deviation one for every gene separately across all conditions
(i.e. not just for the conditions in the module).
— Click on the Help button again to close this help window.

Under-expression is coded with green,
over-expression with red color.
Help |
Hide |
Top
Help |
Show |
Top
The GO tree — Biological processes
HELP
This is one of three sections showing Gene Ontology enrichment of the
current module: in this case for biological processes.
The graph shows the hierarchy of the GO categories, their enrichment
for the current module is color coded, and the blue number beside the
category is the minus log ten p-value of the enrichment. (Calculated
using the standard hypergeometric test.) The color of the arrows code
«is a» (cyan) and «part of» relationships.
The tree was built the following way. First all GO terms with more
significant enrichment p-value than 0.05 were collected. Then all
paths from these terms to the root node of the GO tree were included
too. If a GO term is included more than once in the tree, then the
green numbers show 1) the id of the node, this makes it easier to find
other appereances of the term, and 2) the number of appearences.
Note that the same GO category might show up on the graph many
times. This is because the GO was «straightened» for this
graph, i.e. if there are more paths from a GO term to the root node of
the tree, all of them are included. The green numbers
Move the mouse cursor over the terms to get their definition. Clicking
on them takes you to the corresponding Gene Ontology web page.
If you cannot see a graph here at all, that means that there were no
significantly enriched GO categories, at the 0.05 level.
— Click on the Help button again to close this help window.

Help |
Hide |
Top
Help |
Show |
Top
The GO tree — Cellular Components
HELP
This is one of three sections showing Gene Ontology enrichment of the
current module: in this case for cellular components.
The graph shows the hierarchy of the GO categories, their enrichment
for the current module is color coded, and the blue number beside the
category is the minus log ten p-value of the enrichment. (Calculated
using the standard hypergeometric test.) The color of the arrows code
«is a» (cyan) and «part of» relationships.
The tree was built the following way. First all GO terms with more
significant enrichment p-value than 0.05 were collected. Then all
paths from these terms to the root node of the GO tree were included
too. If a GO term is included more than once in the tree, then the
green numbers show 1) the id of the node, this makes it easier to find
other appereances of the term, and 2) the number of appearences.
Note that the same GO category might show up on the graph many
times. This is because the GO was «straightened» for this
graph, i.e. if there are more paths from a GO term to the root node of
the tree, all of them are included. The green numbers
Move the mouse cursor over the terms to get their definition. Clicking
on them takes you to the corresponding Gene Ontology web page.
If you cannot see a graph here at all, that means that there were no
significantly enriched GO categories, at the 0.05 level.
— Click on the Help button again to close this help window.
Help |
Hide |
Top
Help |
Show |
Top
The GO tree — Molecular Function
HELP
This is one of three sections showing Gene Ontology enrichment of the
current module: in this case for molecular function.
The graph shows the hierarchy of the GO categories, their enrichment
for the current module is color coded, and the blue number beside the
category is the minus log ten p-value of the enrichment. (Calculated
using the standard hypergeometric test.) The color of the arrows code
«is a» (cyan) and «part of» relationships.
The tree was built the following way. First all GO terms with more
significant enrichment p-value than 0.05 were collected. Then all
paths from these terms to the root node of the GO tree were included
too. If a GO term is included more than once in the tree, then the
green numbers show 1) the id of the node, this makes it easier to find
other appereances of the term, and 2) the number of appearences.
Note that the same GO category might show up on the graph many
times. This is because the GO was «straightened» for this
graph, i.e. if there are more paths from a GO term to the root node of
the tree, all of them are included. The green numbers
Move the mouse cursor over the terms to get their definition. Clicking
on them takes you to the corresponding Gene Ontology web page.
If you cannot see a graph here at all, that means that there were no
significantly enriched GO categories, at the 0.05 level.
— Click on the Help button again to close this help window.
Help |
Hide |
Top
Help |
Show |
Top
GO BP test for over-representation
HELP
List of all enriched GO categories (biological processes), at the 0.05
p-value level.
The columns:
- ExpCount is the expected count of genes in the
module annotated with the given GO term, just by chance.
- Count
is the number of genes in the module annotated with the given GO
term.
- Size is the total number of genes (in our universe)
annotated with the GO term.
Clicking on Count shows the genes that drive the
enrichment. You can also click on the individual numbers in
the Count column, to show the driving genes for that individual
GO category.
Clicking on the GO identifiers takes you to the Gene Ontology web
pages.
— Click on the Help button again to close this help window.
| Id | Pvalue | ExpCount | Count | Size | Term |
| GO:0000902 | 1.316e-02 | 3.476 | 12
CDC42BPB, CDC42EP1, CDC42EP4, FOXF1, IDUA, KAL1, MAP1S, NEFM, PIP5K1C, SMAD3, TP53, VEGFB | 317 | cell morphogenesis |
| GO:0032989 | 1.316e-02 | 3.476 | 12
CDC42BPB, CDC42EP1, CDC42EP4, FOXF1, IDUA, KAL1, MAP1S, NEFM, PIP5K1C, SMAD3, TP53, VEGFB | 317 | cellular structure morphogenesis |
Help |
Hide |
Top
Help |
Show |
Top
GO CC test for over-representation
HELP
List of all enriched GO categories (cellular components), at the 0.05
p-value level.
The columns:
- ExpCount is the expected count of genes in the
module annotated with the given GO term, just by chance.
- Count
is the number of genes in the module annotated with the given GO
term.
- Size is the total number of genes (in our universe)
annotated with the GO term.
Clicking on Count shows the genes that drive the
enrichment. You can also click on the individual numbers in
the Count column, to show the driving genes for that individual
GO category.
Clicking on the GO identifiers takes you to the Gene Ontology web
pages.
— Click on the Help button again to close this help window.
Help |
Hide |
Top
Help |
Show |
Top
GO MF test for over-representation
HELP
List of all enriched GO categories (molecular function), at the 0.05
p-value level.
The columns:
- ExpCount is the expected count of genes in the
module annotated with the given GO term, just by chance.
- Count
is the number of genes in the module annotated with the given GO
term.
- Size is the total number of genes (in our universe)
annotated with the GO term.
Clicking on Count shows the genes that drive the
enrichment. You can also click on the individual numbers in
the Count column, to show the driving genes for that individual
GO category.
Clicking on the GO identifiers takes you to the Gene Ontology web
pages.
— Click on the Help button again to close this help window.
| Id | Pvalue | ExpCount | Count | Size | Term |
| GO:0043565 | 1.193e-02 | 2.802 | 11
FOXC2, FOXF1, FOXK2, HMGA1, HSF1, JUND, RERE, SMAD3, SMG6, TERF2, ZFHX3 | 261 | sequence-specific DNA binding |
Help |
Hide |
Top
Help |
Show |
Top
KEGG Pathway test for over-representation
HELP
List of all enriched KEGG pathways, at the 0.05
p-value level.
The columns:
- ExpCount is the expected count of genes in the
module annotated with the given KEGG pathway, just by chance.
- Count
is the number of genes in the module annotated with the given KEGG
pathway.
- Size is the total number of genes (in our universe)
annotated with the KEGG pathway.
Clicking on Count shows the genes that drive the
enrichment. You can also click on the individual numbers in
the Count column, to show the driving genes for that individual
KEGG pathway.
Clicking on the KEGG identifiers takes you to the KEGG web site.
— Click on the Help button again to close this help window.
Help |
Hide |
Top
Help |
Show |
Top
miRNA test for over-representation
HELP
List of all enriched miRNA families, at the 0.05
p-value level.
The columns:
- ExpCount is the expected count of genes in the
module regulated by the given miRNA family, just by chance.
- Count
is the number of genes in the module regulated by the given miRNA
family.
- Size is the total number of genes (in our universe)
regulated with the given miRNA family.
Clicking on Count shows the genes that drive the
enrichment. You can also click on the individual numbers in
the Count column, to show the driving genes for that individual
miRNA family.
The miRNA regulation data was taken from the TargetScan database.
(Only the conserved sites were used for the current analysis.)
Clicking on the miRNA names takes you to the TargetScan web site.
— Click on the Help button again to close this help window.
Help |
Hide |
Top
Help |
Show |
Top
Chromosome test for over-representation
HELP
List of all enriched Chromosomes, at the 0.05
p-value level.
The columns:
- ExpCount is the expected number of genes in the
module on the given chromosome, just by chance.
- Count
is the number of genes in the module on the given chromosome.
- Size is the total number of genes (in our universe)
on the given chromosome.
Clicking on Count shows the genes that drive the
enrichment. You can also click on the individual numbers in
the Count column, to show the driving genes for that individual
chromosome.
— Click on the Help button again to close this help window.
HELP
A list of all genes in the current module, in alphabetical order. The
size of the text corresponds to the gene scores.
Note that some gene symbols may show up more than once, if many
probes match the same Entrez gene.
Genes with no Entrez mapping are given separately, with their
Affymetrics probe ID.
— Click on the Help button again to close this help window.
Entrez genes
ABCD1ATP-binding cassette, sub-family D (ALD), member 1 (205142_x_at), score: -0.75
AGPAT11-acylglycerol-3-phosphate O-acyltransferase 1 (lysophosphatidic acid acyltransferase, alpha) (215535_s_at), score: -0.7
AGRNagrin (217419_x_at), score: -0.71
ALDH1L1aldehyde dehydrogenase 1 family, member L1 (215798_at), score: 0.93
ARSAarylsulfatase A (204443_at), score: -0.67
ATN1atrophin 1 (40489_at), score: -0.7
BAP1BRCA1 associated protein-1 (ubiquitin carboxy-terminal hydrolase) (201419_at), score: -0.78
BAT2HLA-B associated transcript 2 (212081_x_at), score: -0.85
BAT2LHLA-B associated transcript 2-like (212068_s_at), score: -0.82
CALB2calbindin 2 (205428_s_at), score: 0.91
CDC42BPBCDC42 binding protein kinase beta (DMPK-like) (217849_s_at), score: -0.79
CDC42EP1CDC42 effector protein (Rho GTPase binding) 1 (204693_at), score: -0.69
CDC42EP4CDC42 effector protein (Rho GTPase binding) 4 (214721_x_at), score: -0.73
CICcapicua homolog (Drosophila) (212784_at), score: -0.73
CIZ1CDKN1A interacting zinc finger protein 1 (205516_x_at), score: -0.74
CLIP3CAP-GLY domain containing linker protein 3 (212358_at), score: -0.66
COL18A1collagen, type XVIII, alpha 1 (209081_s_at), score: -0.68
CRTC3CREB regulated transcription coactivator 3 (218648_at), score: -0.8
CScitrate synthase (208660_at), score: -0.68
DMBT1deleted in malignant brain tumors 1 (208250_s_at), score: 0.77
DMPKdystrophia myotonica-protein kinase (37996_s_at), score: -0.85
EPHA4EPH receptor A4 (206114_at), score: 0.81
FBXL14F-box and leucine-rich repeat protein 14 (213145_at), score: -0.82
FBXO17F-box protein 17 (220233_at), score: -0.68
FHOD1formin homology 2 domain containing 1 (218530_at), score: -0.66
FOXC2forkhead box C2 (MFH-1, mesenchyme forkhead 1) (214520_at), score: -0.79
FOXF1forkhead box F1 (205935_at), score: -0.74
FOXK2forkhead box K2 (203064_s_at), score: -0.92
GMPRguanosine monophosphate reductase (204187_at), score: -0.83
HAB1B1 for mucin (215778_x_at), score: 0.86
HECTD3HECT domain containing 3 (218632_at), score: -0.72
HMGA1high mobility group AT-hook 1 (210457_x_at), score: -0.72
HSD17B6hydroxysteroid (17-beta) dehydrogenase 6 homolog (mouse) (37512_at), score: 0.87
HSF1heat shock transcription factor 1 (202344_at), score: -0.71
IDUAiduronidase, alpha-L- (205059_s_at), score: -0.71
JUNDjun D proto-oncogene (203751_x_at), score: -0.77
JUPjunction plakoglobin (201015_s_at), score: -0.93
KAL1Kallmann syndrome 1 sequence (205206_at), score: 0.95
KIAA1305KIAA1305 (220911_s_at), score: -0.82
KLHL23kelch-like 23 (Drosophila) (213610_s_at), score: 0.78
LEPREL2leprecan-like 2 (204854_at), score: -0.72
LOC440434hypothetical protein FLJ11822 (215090_x_at), score: -0.71
LRP8low density lipoprotein receptor-related protein 8, apolipoprotein e receptor (205282_at), score: 0.78
MAP1Smicrotubule-associated protein 1S (218522_s_at), score: -0.79
MAP3K6mitogen-activated protein kinase kinase kinase 6 (219278_at), score: -0.76
MPP1membrane protein, palmitoylated 1, 55kDa (202974_at), score: -0.67
MYL4myosin, light chain 4, alkali; atrial, embryonic (210088_x_at), score: 0.82
NCKAP1NCK-associated protein 1 (217465_at), score: 0.82
NEFMneurofilament, medium polypeptide (205113_at), score: 0.95
NINJ1ninjurin 1 (203045_at), score: -0.7
PARVBparvin, beta (204629_at), score: -0.72
PCDH9protocadherin 9 (219737_s_at), score: 0.81
PCDHG@protocadherin gamma cluster (215836_s_at), score: -0.69
PDE5Aphosphodiesterase 5A, cGMP-specific (206757_at), score: -0.74
PHF7PHD finger protein 7 (215622_x_at), score: 0.77
PIP5K1Cphosphatidylinositol-4-phosphate 5-kinase, type I, gamma (212518_at), score: -0.85
PKN1protein kinase N1 (202161_at), score: -0.75
PLAUplasminogen activator, urokinase (211668_s_at), score: -0.73
POLR2Apolymerase (RNA) II (DNA directed) polypeptide A, 220kDa (202725_at), score: -0.74
PTPROprotein tyrosine phosphatase, receptor type, O (211600_at), score: -0.77
PXNpaxillin (211823_s_at), score: -0.68
REREarginine-glutamic acid dipeptide (RE) repeats (200940_s_at), score: -0.82
RP5-1000E10.4suppressor of IKK epsilon (221705_s_at), score: 0.76
RPL18AP6ribosomal protein L18a pseudogene 6 (216383_at), score: 0.88
RPS17P5ribosomal protein S17 pseudogene 5 (216348_at), score: 0.78
SAV1salvador homolog 1 (Drosophila) (218276_s_at), score: -0.81
SBNO2strawberry notch homolog 2 (Drosophila) (204166_at), score: -0.74
SCAMP4secretory carrier membrane protein 4 (213244_at), score: -1
SDAD1SDA1 domain containing 1 (218607_s_at), score: -0.7
SF1splicing factor 1 (208313_s_at), score: -0.73
SH3GLB2SH3-domain GRB2-like endophilin B2 (218813_s_at), score: -0.67
SIGIRRsingle immunoglobulin and toll-interleukin 1 receptor (TIR) domain (52940_at), score: -0.74
SIGLEC6sialic acid binding Ig-like lectin 6 (210796_x_at), score: 0.76
SIN3BSIN3 homolog B, transcription regulator (yeast) (209352_s_at), score: -0.7
SLC5A5solute carrier family 5 (sodium iodide symporter), member 5 (211123_at), score: 0.8
SMAD3SMAD family member 3 (218284_at), score: -0.71
SMG6Smg-6 homolog, nonsense mediated mRNA decay factor (C. elegans) (214940_s_at), score: -0.74
SOLHsmall optic lobes homolog (Drosophila) (204275_at), score: -0.72
SPG7spastic paraplegia 7 (pure and complicated autosomal recessive) (202104_s_at), score: -0.68
SSBP3single stranded DNA binding protein 3 (217991_x_at), score: -0.72
ST5suppression of tumorigenicity 5 (202440_s_at), score: -0.66
SULT1B1sulfotransferase family, cytosolic, 1B, member 1 (207601_at), score: 0.81
TAPBPTAP binding protein (tapasin) (208829_at), score: -0.75
TBC1D2BTBC1 domain family, member 2B (212796_s_at), score: -0.67
TERF2telomeric repeat binding factor 2 (203611_at), score: -0.73
TIAF1TGFB1-induced anti-apoptotic factor 1 (202039_at), score: -0.75
TLE3transducin-like enhancer of split 3 (E(sp1) homolog, Drosophila) (206472_s_at), score: -0.68
TP53tumor protein p53 (201746_at), score: -0.76
TSC2tuberous sclerosis 2 (215735_s_at), score: -0.74
TSKUtsukushin (218245_at), score: -0.8
TUBA4Btubulin, alpha 4b (pseudogene) (207490_at), score: 0.84
TXLNAtaxilin alpha (212300_at), score: -0.66
UBTD1ubiquitin domain containing 1 (219172_at), score: -0.76
VEGFBvascular endothelial growth factor B (203683_s_at), score: -0.83
VPS37Bvacuolar protein sorting 37 homolog B (S. cerevisiae) (221704_s_at), score: -0.8
WDR42AWD repeat domain 42A (202249_s_at), score: -0.77
WDR6WD repeat domain 6 (217734_s_at), score: -0.9
ZFHX3zinc finger homeobox 3 (208033_s_at), score: -0.67
Non-Entrez genes
Unknown, score:
HELP
Conditions in the module, given in the same order as on the expression
plot above. Red color means over-expression, green under-expression in
the given condition.
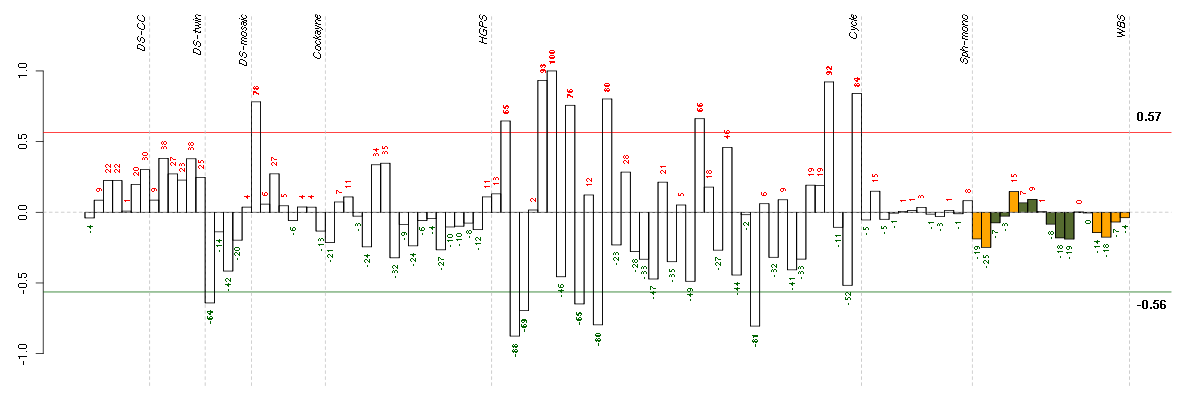
The barplot below shows the condition (sample) scores. A separate bar
is shown for each sample, its height is the corresponding score of the
sample in the module. The red and green numbers on the bars are the
sample scores expressed in percents, i.e. 100% is 1.0.
The red and green lines show the module thresholds, samples above
the red line and below the green line are included in the module.
The different experiments that were part of the study, are separated
by dashed vertical lines.
— Click on the Help button again to close this help window.
| Id | sample | Experiment | ExpName | Array | Syndrome | Cell.line |
| E-TABM-263-raw-cel-1515485691.cel | 3 | 6 | Cycle | hgu133a2 | none | Cycle 1 |
| E-TABM-263-raw-cel-1515486211.cel | 29 | 6 | Cycle | hgu133a2 | none | Cycle 1 |
| E-TABM-263-raw-cel-1515485871.cel | 12 | 6 | Cycle | hgu133a2 | none | Cycle 1 |
| E-TABM-263-raw-cel-1515485711.cel | 4 | 6 | Cycle | hgu133a2 | none | Cycle 1 |
| E-TABM-263-raw-cel-1515485831.cel | 10 | 6 | Cycle | hgu133a2 | none | Cycle 1 |
| 46A.CEL | 1 | 3 | DS-mosaic | hgu133plus2 | none | DS-mosaic 1 |
| E-TABM-263-raw-cel-1515485671.cel | 2 | 6 | Cycle | hgu133a2 | none | Cycle 1 |
| E-TABM-263-raw-cel-1515486091.cel | 23 | 6 | Cycle | hgu133a2 | none | Cycle 1 |
| E-TABM-263-raw-cel-1515485811.cel | 9 | 6 | Cycle | hgu133a2 | none | Cycle 1 |
| E-GEOD-3407-raw-cel-1437949557.cel | 1 | 4 | Cockayne | hgu133a | CS | eGFP |
| E-TABM-263-raw-cel-1515485891.cel | 13 | 6 | Cycle | hgu133a2 | none | Cycle 1 |
| E-TABM-263-raw-cel-1515486431.cel | 40 | 6 | Cycle | hgu133a2 | none | Cycle 1 |
| E-TABM-263-raw-cel-1515486371.cel | 37 | 6 | Cycle | hgu133a2 | none | Cycle 1 |
| E-TABM-263-raw-cel-1515485751.cel | 6 | 6 | Cycle | hgu133a2 | none | Cycle 1 |
| E-TABM-263-raw-cel-1515485771.cel | 7 | 6 | Cycle | hgu133a2 | none | Cycle 1 |


© 2008-2010 Computational Biology Group, Department of Medical Genetics,
University of Lausanne, Switzerland