Previous module |
Next module
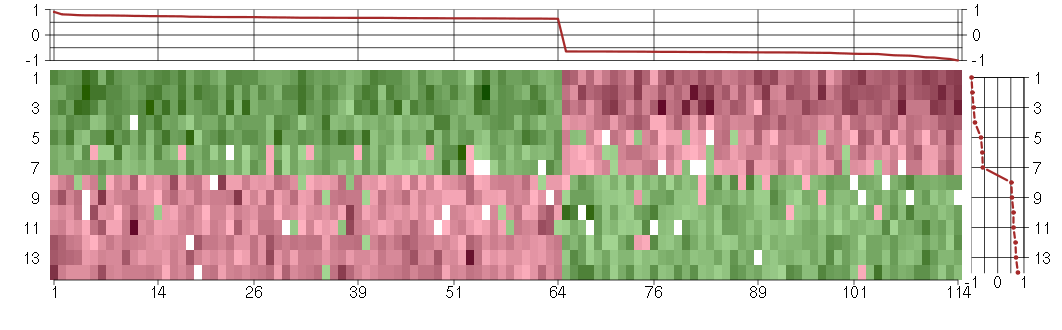
Module #751, TG: 2.6, TC: 1.6, 114 probes, 114 Entrez genes, 14 conditions


HELP
The image plot shows the color-coded level of gene expression, for the
genes and conditions in a given transcription module. The genes are on
the horizontal, the conditions on the vertical axis.
The genes are ordered according to their ISA gene scores, similarly
the conditions are ordered according to their condition scores. The
score of a gene means the «degree of inclusion» in
the module: a high score gene is essential in the module.
Condition scores can also be negative, that means that the genes of
the module are all down-regulated in the condition. Here the absolute
value of the score gives the «degree of inclusion».
The plots above and beside the expression matrix show the gene scores
and condition scores, respectively.
Note that the plot is interactive, you can see the name of the gene
and condition under the mouse cursor.
The expression matrix was normalized to have mean zero and standard
deviation one for every gene separately across all conditions
(i.e. not just for the conditions in the module).
— Click on the Help button again to close this help window.

Under-expression is coded with green,
over-expression with red color.
Help |
Hide |
Top
Help |
Show |
Top
The GO tree — Biological processes
HELP
This is one of three sections showing Gene Ontology enrichment of the
current module: in this case for biological processes.
The graph shows the hierarchy of the GO categories, their enrichment
for the current module is color coded, and the blue number beside the
category is the minus log ten p-value of the enrichment. (Calculated
using the standard hypergeometric test.) The color of the arrows code
«is a» (cyan) and «part of» relationships.
The tree was built the following way. First all GO terms with more
significant enrichment p-value than 0.05 were collected. Then all
paths from these terms to the root node of the GO tree were included
too. If a GO term is included more than once in the tree, then the
green numbers show 1) the id of the node, this makes it easier to find
other appereances of the term, and 2) the number of appearences.
Note that the same GO category might show up on the graph many
times. This is because the GO was «straightened» for this
graph, i.e. if there are more paths from a GO term to the root node of
the tree, all of them are included. The green numbers
Move the mouse cursor over the terms to get their definition. Clicking
on them takes you to the corresponding Gene Ontology web page.
If you cannot see a graph here at all, that means that there were no
significantly enriched GO categories, at the 0.05 level.
— Click on the Help button again to close this help window.

biological_process
Any process specifically pertinent to the functioning of integrated living units: cells, tissues, organs, and organisms. A process is a collection of molecular events with a defined beginning and end.
multicellular organismal process
Any biological process, occurring at the level of a multicellular organism, pertinent to its function.
regulation of biological process
Any process that modulates the frequency, rate or extent of a biological process. Biological processes are regulated by many means; examples include the control of gene expression, protein modification or interaction with a protein or substrate molecule.
regulation of multicellular organismal process
Any process that modulates the frequency, rate or extent of a multicellular organismal process, the processes pertinent to the function of a multicellular organism above the cellular level; includes the integrated processes of tissues and organs.
biological regulation
Any process that modulates the frequency, rate or extent of any biological process, quality or function.
all
This term is the most general term possible
regulation of multicellular organismal process
Any process that modulates the frequency, rate or extent of a multicellular organismal process, the processes pertinent to the function of a multicellular organism above the cellular level; includes the integrated processes of tissues and organs.
regulation of biological process
Any process that modulates the frequency, rate or extent of a biological process. Biological processes are regulated by many means; examples include the control of gene expression, protein modification or interaction with a protein or substrate molecule.
Help |
Hide |
Top
Help |
Show |
Top
The GO tree — Cellular Components
HELP
This is one of three sections showing Gene Ontology enrichment of the
current module: in this case for cellular components.
The graph shows the hierarchy of the GO categories, their enrichment
for the current module is color coded, and the blue number beside the
category is the minus log ten p-value of the enrichment. (Calculated
using the standard hypergeometric test.) The color of the arrows code
«is a» (cyan) and «part of» relationships.
The tree was built the following way. First all GO terms with more
significant enrichment p-value than 0.05 were collected. Then all
paths from these terms to the root node of the GO tree were included
too. If a GO term is included more than once in the tree, then the
green numbers show 1) the id of the node, this makes it easier to find
other appereances of the term, and 2) the number of appearences.
Note that the same GO category might show up on the graph many
times. This is because the GO was «straightened» for this
graph, i.e. if there are more paths from a GO term to the root node of
the tree, all of them are included. The green numbers
Move the mouse cursor over the terms to get their definition. Clicking
on them takes you to the corresponding Gene Ontology web page.
If you cannot see a graph here at all, that means that there were no
significantly enriched GO categories, at the 0.05 level.
— Click on the Help button again to close this help window.
Help |
Hide |
Top
Help |
Show |
Top
The GO tree — Molecular Function
HELP
This is one of three sections showing Gene Ontology enrichment of the
current module: in this case for molecular function.
The graph shows the hierarchy of the GO categories, their enrichment
for the current module is color coded, and the blue number beside the
category is the minus log ten p-value of the enrichment. (Calculated
using the standard hypergeometric test.) The color of the arrows code
«is a» (cyan) and «part of» relationships.
The tree was built the following way. First all GO terms with more
significant enrichment p-value than 0.05 were collected. Then all
paths from these terms to the root node of the GO tree were included
too. If a GO term is included more than once in the tree, then the
green numbers show 1) the id of the node, this makes it easier to find
other appereances of the term, and 2) the number of appearences.
Note that the same GO category might show up on the graph many
times. This is because the GO was «straightened» for this
graph, i.e. if there are more paths from a GO term to the root node of
the tree, all of them are included. The green numbers
Move the mouse cursor over the terms to get their definition. Clicking
on them takes you to the corresponding Gene Ontology web page.
If you cannot see a graph here at all, that means that there were no
significantly enriched GO categories, at the 0.05 level.
— Click on the Help button again to close this help window.
Help |
Hide |
Top
Help |
Show |
Top
GO BP test for over-representation
HELP
List of all enriched GO categories (biological processes), at the 0.05
p-value level.
The columns:
- ExpCount is the expected count of genes in the
module annotated with the given GO term, just by chance.
- Count
is the number of genes in the module annotated with the given GO
term.
- Size is the total number of genes (in our universe)
annotated with the GO term.
Clicking on Count shows the genes that drive the
enrichment. You can also click on the individual numbers in
the Count column, to show the driving genes for that individual
GO category.
Clicking on the GO identifiers takes you to the Gene Ontology web
pages.
— Click on the Help button again to close this help window.
| Id | Pvalue | ExpCount | Count | Size | Term |
| GO:0051239 | 2.160e-03 | 3.728 | 14
ADORA2B, BMP6, DMPK, EGF, IRF1, MYL4, NEFM, NF1, NFKBIA, PLAU, PPARG, SMAD3, TICAM2, TP53 | 320 | regulation of multicellular organismal process |
| GO:0045110 | 2.689e-02 | 0.03495 | 2
NEFL, NEFM | 3 | intermediate filament bundle assembly |
| GO:0042990 | 2.695e-02 | 0.1515 | 3
NF1, NFKBIA, SMAD3 | 13 | regulation of transcription factor import into nucleus |
| GO:0042991 | 2.695e-02 | 0.1515 | 3
NF1, NFKBIA, SMAD3 | 13 | transcription factor import into nucleus |
| GO:0010552 | 3.683e-02 | 0.1748 | 3
NFKBIA, PPARG, TP53 | 15 | positive regulation of specific transcription from RNA polymerase II promoter |
| GO:0043525 | 4.324e-02 | 0.0466 | 2
NF1, TP53 | 4 | positive regulation of neuron apoptosis |
| GO:0060052 | 4.324e-02 | 0.0466 | 2
NEFL, NEFM | 4 | neurofilament cytoskeleton organization |
Help |
Hide |
Top
Help |
Show |
Top
GO CC test for over-representation
HELP
List of all enriched GO categories (cellular components), at the 0.05
p-value level.
The columns:
- ExpCount is the expected count of genes in the
module annotated with the given GO term, just by chance.
- Count
is the number of genes in the module annotated with the given GO
term.
- Size is the total number of genes (in our universe)
annotated with the GO term.
Clicking on Count shows the genes that drive the
enrichment. You can also click on the individual numbers in
the Count column, to show the driving genes for that individual
GO category.
Clicking on the GO identifiers takes you to the Gene Ontology web
pages.
— Click on the Help button again to close this help window.
| Id | Pvalue | ExpCount | Count | Size | Term |
| GO:0005883 | 1.283e-02 | 0.03671 | 2
NEFL, NEFM | 3 | neurofilament |
| GO:0005626 | 1.687e-02 | 4.588 | 13
ACSL4, HSD17B6, JUP, LRP2, MDM2, MPP1, OAS2, OAS3, SIGLEC6, SLC33A1, SNAP25, TP53, YES1 | 375 | insoluble fraction |
| GO:0060053 | 2.300e-02 | 0.04894 | 2
NEFL, NEFM | 4 | neurofilament cytoskeleton |
Help |
Hide |
Top
Help |
Show |
Top
GO MF test for over-representation
HELP
List of all enriched GO categories (molecular function), at the 0.05
p-value level.
The columns:
- ExpCount is the expected count of genes in the
module annotated with the given GO term, just by chance.
- Count
is the number of genes in the module annotated with the given GO
term.
- Size is the total number of genes (in our universe)
annotated with the GO term.
Clicking on Count shows the genes that drive the
enrichment. You can also click on the individual numbers in
the Count column, to show the driving genes for that individual
GO category.
Clicking on the GO identifiers takes you to the Gene Ontology web
pages.
— Click on the Help button again to close this help window.
Help |
Hide |
Top
Help |
Show |
Top
KEGG Pathway test for over-representation
HELP
List of all enriched KEGG pathways, at the 0.05
p-value level.
The columns:
- ExpCount is the expected count of genes in the
module annotated with the given KEGG pathway, just by chance.
- Count
is the number of genes in the module annotated with the given KEGG
pathway.
- Size is the total number of genes (in our universe)
annotated with the KEGG pathway.
Clicking on Count shows the genes that drive the
enrichment. You can also click on the individual numbers in
the Count column, to show the driving genes for that individual
KEGG pathway.
Clicking on the KEGG identifiers takes you to the KEGG web site.
— Click on the Help button again to close this help window.
Help |
Hide |
Top
Help |
Show |
Top
miRNA test for over-representation
HELP
List of all enriched miRNA families, at the 0.05
p-value level.
The columns:
- ExpCount is the expected count of genes in the
module regulated by the given miRNA family, just by chance.
- Count
is the number of genes in the module regulated by the given miRNA
family.
- Size is the total number of genes (in our universe)
regulated with the given miRNA family.
Clicking on Count shows the genes that drive the
enrichment. You can also click on the individual numbers in
the Count column, to show the driving genes for that individual
miRNA family.
The miRNA regulation data was taken from the TargetScan database.
(Only the conserved sites were used for the current analysis.)
Clicking on the miRNA names takes you to the TargetScan web site.
— Click on the Help button again to close this help window.
Help |
Hide |
Top
Help |
Show |
Top
Chromosome test for over-representation
HELP
List of all enriched Chromosomes, at the 0.05
p-value level.
The columns:
- ExpCount is the expected number of genes in the
module on the given chromosome, just by chance.
- Count
is the number of genes in the module on the given chromosome.
- Size is the total number of genes (in our universe)
on the given chromosome.
Clicking on Count shows the genes that drive the
enrichment. You can also click on the individual numbers in
the Count column, to show the driving genes for that individual
chromosome.
— Click on the Help button again to close this help window.
HELP
A list of all genes in the current module, in alphabetical order. The
size of the text corresponds to the gene scores.
Note that some gene symbols may show up more than once, if many
probes match the same Entrez gene.
Genes with no Entrez mapping are given separately, with their
Affymetrics probe ID.
— Click on the Help button again to close this help window.
Entrez genes
ACSL4acyl-CoA synthetase long-chain family member 4 (202422_s_at), score: -0.67
ACTR3BARP3 actin-related protein 3 homolog B (yeast) (218868_at), score: -0.74
ADORA2Badenosine A2b receptor (205891_at), score: 0.7
AIM1absent in melanoma 1 (212543_at), score: 0.73
ALDH1L1aldehyde dehydrogenase 1 family, member L1 (215798_at), score: -0.7
ATP2C1ATPase, Ca++ transporting, type 2C, member 1 (211137_s_at), score: -0.65
BAT2HLA-B associated transcript 2 (212081_x_at), score: 0.68
BMP6bone morphogenetic protein 6 (206176_at), score: -0.67
C4orf43chromosome 4 open reading frame 43 (218513_at), score: -0.7
CALB2calbindin 2 (205428_s_at), score: -0.8
CALCOCO1calcium binding and coiled-coil domain 1 (209002_s_at), score: 0.65
CASC3cancer susceptibility candidate 3 (207842_s_at), score: 0.65
CDC25Bcell division cycle 25 homolog B (S. pombe) (201853_s_at), score: 0.65
CDC2L6cell division cycle 2-like 6 (CDK8-like) (212899_at), score: 0.66
CDC42BPBCDC42 binding protein kinase beta (DMPK-like) (217849_s_at), score: 0.64
CDC42EP4CDC42 effector protein (Rho GTPase binding) 4 (214721_x_at), score: 0.78
CICcapicua homolog (Drosophila) (212784_at), score: 0.66
CITcitron (rho-interacting, serine/threonine kinase 21) (212801_at), score: 0.71
CNOT3CCR4-NOT transcription complex, subunit 3 (203239_s_at), score: 0.7
CRTC3CREB regulated transcription coactivator 3 (218648_at), score: 0.77
CScitrate synthase (208660_at), score: 0.67
DKFZP564O0823DKFZP564O0823 protein (204687_at), score: -0.65
DMPKdystrophia myotonica-protein kinase (37996_s_at), score: 0.69
DNAJB9DnaJ (Hsp40) homolog, subfamily B, member 9 (202843_at), score: -0.88
DNAJC6DnaJ (Hsp40) homolog, subfamily C, member 6 (204720_s_at), score: -0.68
EDEM1ER degradation enhancer, mannosidase alpha-like 1 (203279_at), score: -0.74
EGFepidermal growth factor (beta-urogastrone) (206254_at), score: -0.65
EMCNendomucin (219436_s_at), score: 0.65
EPHA4EPH receptor A4 (206114_at), score: -0.68
FAM18Bfamily with sequence similarity 18, member B (218446_s_at), score: -0.66
FBXL14F-box and leucine-rich repeat protein 14 (213145_at), score: 0.77
FOXC2forkhead box C2 (MFH-1, mesenchyme forkhead 1) (214520_at), score: 0.69
FOXK2forkhead box K2 (203064_s_at), score: 0.66
GFOD1glucose-fructose oxidoreductase domain containing 1 (219821_s_at), score: -0.88
GKglycerol kinase (207387_s_at), score: -0.65
GK3Pglycerol kinase 3 pseudogene (215966_x_at), score: -0.8
GMCL1germ cell-less homolog 1 (Drosophila) (218458_at), score: -0.65
GMPRguanosine monophosphate reductase (204187_at), score: 0.72
H1FXH1 histone family, member X (204805_s_at), score: 0.7
HDGFhepatoma-derived growth factor (high-mobility group protein 1-like) (200896_x_at), score: 0.67
HGFhepatocyte growth factor (hepapoietin A; scatter factor) (209960_at), score: 0.67
HMGA1high mobility group AT-hook 1 (210457_x_at), score: 0.66
HSD17B6hydroxysteroid (17-beta) dehydrogenase 6 homolog (mouse) (37512_at), score: -0.84
HSPA12Aheat shock 70kDa protein 12A (214434_at), score: 0.67
IRF1interferon regulatory factor 1 (202531_at), score: 0.64
ITGA1integrin, alpha 1 (214660_at), score: -0.66
JUPjunction plakoglobin (201015_s_at), score: 0.76
KAL1Kallmann syndrome 1 sequence (205206_at), score: -1
KIAA1305KIAA1305 (220911_s_at), score: 0.7
KLHL23kelch-like 23 (Drosophila) (213610_s_at), score: -0.68
LOC391132similar to hCG2041276 (216177_at), score: -0.65
LOC440434hypothetical protein FLJ11822 (215090_x_at), score: 0.65
LRP2low density lipoprotein-related protein 2 (205710_at), score: 0.7
LRP8low density lipoprotein receptor-related protein 8, apolipoprotein e receptor (205282_at), score: -0.81
MDM2Mdm2 p53 binding protein homolog (mouse) (205386_s_at), score: 0.72
MFAP3Lmicrofibrillar-associated protein 3-like (205442_at), score: -0.68
MMP10matrix metallopeptidase 10 (stromelysin 2) (205680_at), score: -0.68
MPP1membrane protein, palmitoylated 1, 55kDa (202974_at), score: 0.67
MYL4myosin, light chain 4, alkali; atrial, embryonic (210088_x_at), score: -0.68
NCALDneurocalcin delta (211685_s_at), score: -0.66
NDPNorrie disease (pseudoglioma) (206022_at), score: 0.77
NEFLneurofilament, light polypeptide (221805_at), score: -0.67
NEFMneurofilament, medium polypeptide (205113_at), score: -0.94
NEO1neogenin homolog 1 (chicken) (204321_at), score: 0.64
NF1neurofibromin 1 (211094_s_at), score: 0.67
NFKBIAnuclear factor of kappa light polypeptide gene enhancer in B-cells inhibitor, alpha (201502_s_at), score: 0.7
NOX4NADPH oxidase 4 (219773_at), score: -0.66
OAS22'-5'-oligoadenylate synthetase 2, 69/71kDa (204972_at), score: 0.64
OAS32'-5'-oligoadenylate synthetase 3, 100kDa (218400_at), score: 0.67
OLFML2Bolfactomedin-like 2B (213125_at), score: 0.91
OPCMLopioid binding protein/cell adhesion molecule-like (214111_at), score: -0.74
OSTM1osteopetrosis associated transmembrane protein 1 (218196_at), score: -0.69
PCDH9protocadherin 9 (219737_s_at), score: -0.92
PDE5Aphosphodiesterase 5A, cGMP-specific (206757_at), score: 0.81
PITX1paired-like homeodomain 1 (208502_s_at), score: 0.65
PLAUplasminogen activator, urokinase (211668_s_at), score: 0.66
PLK1polo-like kinase 1 (Drosophila) (202240_at), score: 0.68
PPARGperoxisome proliferator-activated receptor gamma (208510_s_at), score: 0.64
PRMT3protein arginine methyltransferase 3 (213320_at), score: -0.75
RAB1ARAB1A, member RAS oncogene family (213440_at), score: -0.77
REREarginine-glutamic acid dipeptide (RE) repeats (200940_s_at), score: 0.74
RFX5regulatory factor X, 5 (influences HLA class II expression) (202963_at), score: 0.66
RNF220ring finger protein 220 (219988_s_at), score: 0.68
RP5-1000E10.4suppressor of IKK epsilon (221705_s_at), score: -0.65
RPL18AP6ribosomal protein L18a pseudogene 6 (216383_at), score: -0.72
RPLP2P1ribosomal protein, large P2, pseudogene 1 (216490_x_at), score: -0.65
RPS17P5ribosomal protein S17 pseudogene 5 (216348_at), score: -0.65
SAP30LSAP30-like (219129_s_at), score: 0.68
SAV1salvador homolog 1 (Drosophila) (218276_s_at), score: 0.67
SCAMP4secretory carrier membrane protein 4 (213244_at), score: 0.8
SDPRserum deprivation response (phosphatidylserine binding protein) (218711_s_at), score: 0.69
SF1splicing factor 1 (208313_s_at), score: 0.71
SIGLEC6sialic acid binding Ig-like lectin 6 (210796_x_at), score: -0.67
SLC25A13solute carrier family 25, member 13 (citrin) (203775_at), score: -0.67
SLC33A1solute carrier family 33 (acetyl-CoA transporter), member 1 (203165_s_at), score: -0.67
SLC4A7solute carrier family 4, sodium bicarbonate cotransporter, member 7 (209884_s_at), score: -0.72
SLC5A5solute carrier family 5 (sodium iodide symporter), member 5 (211123_at), score: -0.66
SMAD3SMAD family member 3 (218284_at), score: 0.74
SNAP25synaptosomal-associated protein, 25kDa (202508_s_at), score: 0.75
STIM1stromal interaction molecule 1 (202764_at), score: 0.73
SYNE1spectrin repeat containing, nuclear envelope 1 (209447_at), score: -0.69
THSD7Athrombospondin, type I, domain containing 7A (214920_at), score: 0.77
TIAF1TGFB1-induced anti-apoptotic factor 1 (202039_at), score: 0.66
TICAM2toll-like receptor adaptor molecule 2 (214658_at), score: -0.68
TMEM104transmembrane protein 104 (220097_s_at), score: -0.65
TMSB15Bthymosin beta 15B (214051_at), score: 0.64
TP53tumor protein p53 (201746_at), score: 0.74
TRIM21tripartite motif-containing 21 (204804_at), score: 0.67
TRMT2ATRM2 tRNA methyltransferase 2 homolog A (S. cerevisiae) (91617_at), score: -0.7
TSKUtsukushin (218245_at), score: 0.65
ULBP2UL16 binding protein 2 (221291_at), score: -0.65
WDR6WD repeat domain 6 (217734_s_at), score: 0.76
YES1v-yes-1 Yamaguchi sarcoma viral oncogene homolog 1 (202932_at), score: 0.75
ZDHHC7zinc finger, DHHC-type containing 7 (218606_at), score: 0.65
Non-Entrez genes
Unknown, score:
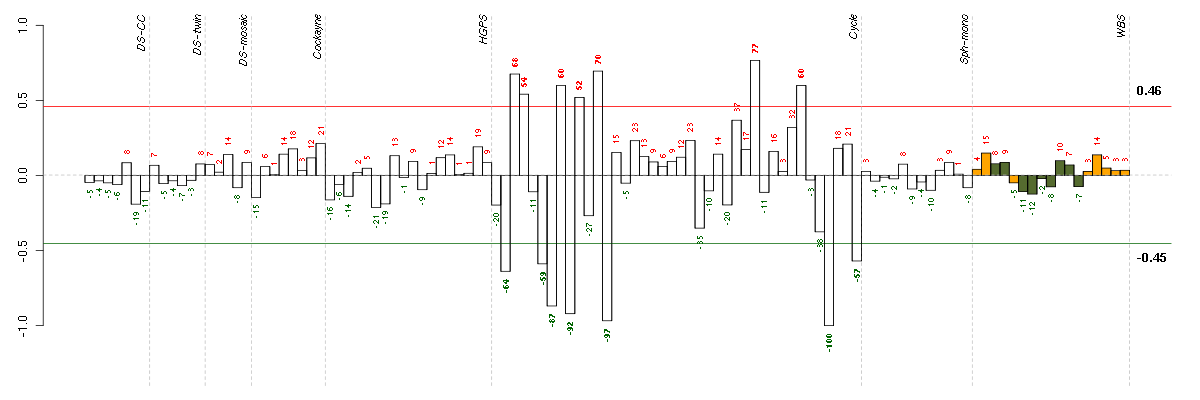
HELP
Conditions in the module, given in the same order as on the expression
plot above. Red color means over-expression, green under-expression in
the given condition.
The barplot below shows the condition (sample) scores. A separate bar
is shown for each sample, its height is the corresponding score of the
sample in the module. The red and green numbers on the bars are the
sample scores expressed in percents, i.e. 100% is 1.0.
The red and green lines show the module thresholds, samples above
the red line and below the green line are included in the module.
The different experiments that were part of the study, are separated
by dashed vertical lines.
— Click on the Help button again to close this help window.
| Id | sample | Experiment | ExpName | Array | Syndrome | Cell.line |
| E-TABM-263-raw-cel-1515486371.cel | 37 | 6 | Cycle | hgu133a2 | none | Cycle 1 |
| E-TABM-263-raw-cel-1515485891.cel | 13 | 6 | Cycle | hgu133a2 | none | Cycle 1 |
| E-TABM-263-raw-cel-1515485811.cel | 9 | 6 | Cycle | hgu133a2 | none | Cycle 1 |
| E-TABM-263-raw-cel-1515485771.cel | 7 | 6 | Cycle | hgu133a2 | none | Cycle 1 |
| E-TABM-263-raw-cel-1515485671.cel | 2 | 6 | Cycle | hgu133a2 | none | Cycle 1 |
| E-TABM-263-raw-cel-1515485751.cel | 6 | 6 | Cycle | hgu133a2 | none | Cycle 1 |
| E-TABM-263-raw-cel-1515486431.cel | 40 | 6 | Cycle | hgu133a2 | none | Cycle 1 |
| E-TABM-263-raw-cel-1515485831.cel | 10 | 6 | Cycle | hgu133a2 | none | Cycle 1 |
| E-TABM-263-raw-cel-1515485711.cel | 4 | 6 | Cycle | hgu133a2 | none | Cycle 1 |
| E-TABM-263-raw-cel-1515485791.cel | 8 | 6 | Cycle | hgu133a2 | none | Cycle 1 |
| E-TABM-263-raw-cel-1515486311.cel | 34 | 6 | Cycle | hgu133a2 | none | Cycle 1 |
| E-TABM-263-raw-cel-1515485691.cel | 3 | 6 | Cycle | hgu133a2 | none | Cycle 1 |
| E-TABM-263-raw-cel-1515485871.cel | 12 | 6 | Cycle | hgu133a2 | none | Cycle 1 |
| E-TABM-263-raw-cel-1515486211.cel | 29 | 6 | Cycle | hgu133a2 | none | Cycle 1 |


© 2008-2010 Computational Biology Group, Department of Medical Genetics,
University of Lausanne, Switzerland