Previous module |
Next module
Module #766, TG: 2.6, TC: 1.4, 118 probes, 118 Entrez genes, 16 conditions


HELP
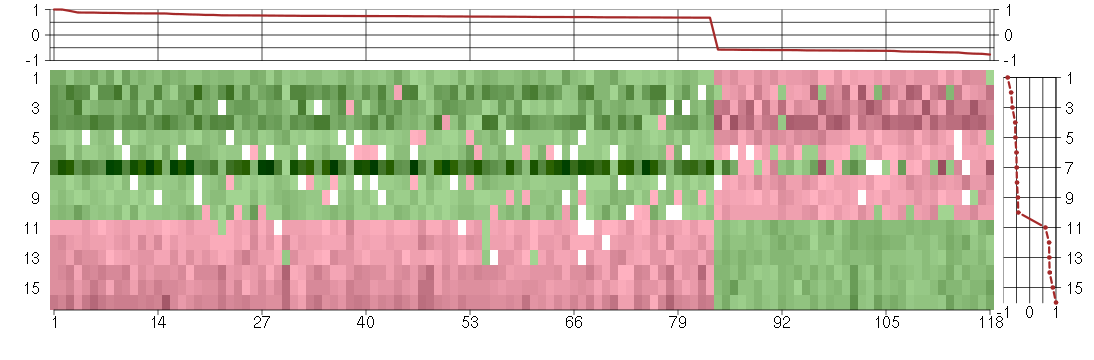
The image plot shows the color-coded level of gene expression, for the
genes and conditions in a given transcription module. The genes are on
the horizontal, the conditions on the vertical axis.
The genes are ordered according to their ISA gene scores, similarly
the conditions are ordered according to their condition scores. The
score of a gene means the «degree of inclusion» in
the module: a high score gene is essential in the module.
Condition scores can also be negative, that means that the genes of
the module are all down-regulated in the condition. Here the absolute
value of the score gives the «degree of inclusion».
The plots above and beside the expression matrix show the gene scores
and condition scores, respectively.
Note that the plot is interactive, you can see the name of the gene
and condition under the mouse cursor.
The expression matrix was normalized to have mean zero and standard
deviation one for every gene separately across all conditions
(i.e. not just for the conditions in the module).
— Click on the Help button again to close this help window.

Under-expression is coded with green,
over-expression with red color.
Help |
Hide |
Top
Help |
Show |
Top
The GO tree — Biological processes
HELP
This is one of three sections showing Gene Ontology enrichment of the
current module: in this case for biological processes.
The graph shows the hierarchy of the GO categories, their enrichment
for the current module is color coded, and the blue number beside the
category is the minus log ten p-value of the enrichment. (Calculated
using the standard hypergeometric test.) The color of the arrows code
«is a» (cyan) and «part of» relationships.
The tree was built the following way. First all GO terms with more
significant enrichment p-value than 0.05 were collected. Then all
paths from these terms to the root node of the GO tree were included
too. If a GO term is included more than once in the tree, then the
green numbers show 1) the id of the node, this makes it easier to find
other appereances of the term, and 2) the number of appearences.
Note that the same GO category might show up on the graph many
times. This is because the GO was «straightened» for this
graph, i.e. if there are more paths from a GO term to the root node of
the tree, all of them are included. The green numbers
Move the mouse cursor over the terms to get their definition. Clicking
on them takes you to the corresponding Gene Ontology web page.
If you cannot see a graph here at all, that means that there were no
significantly enriched GO categories, at the 0.05 level.
— Click on the Help button again to close this help window.

Help |
Hide |
Top
Help |
Show |
Top
The GO tree — Cellular Components
HELP
This is one of three sections showing Gene Ontology enrichment of the
current module: in this case for cellular components.
The graph shows the hierarchy of the GO categories, their enrichment
for the current module is color coded, and the blue number beside the
category is the minus log ten p-value of the enrichment. (Calculated
using the standard hypergeometric test.) The color of the arrows code
«is a» (cyan) and «part of» relationships.
The tree was built the following way. First all GO terms with more
significant enrichment p-value than 0.05 were collected. Then all
paths from these terms to the root node of the GO tree were included
too. If a GO term is included more than once in the tree, then the
green numbers show 1) the id of the node, this makes it easier to find
other appereances of the term, and 2) the number of appearences.
Note that the same GO category might show up on the graph many
times. This is because the GO was «straightened» for this
graph, i.e. if there are more paths from a GO term to the root node of
the tree, all of them are included. The green numbers
Move the mouse cursor over the terms to get their definition. Clicking
on them takes you to the corresponding Gene Ontology web page.
If you cannot see a graph here at all, that means that there were no
significantly enriched GO categories, at the 0.05 level.
— Click on the Help button again to close this help window.
Help |
Hide |
Top
Help |
Show |
Top
The GO tree — Molecular Function
HELP
This is one of three sections showing Gene Ontology enrichment of the
current module: in this case for molecular function.
The graph shows the hierarchy of the GO categories, their enrichment
for the current module is color coded, and the blue number beside the
category is the minus log ten p-value of the enrichment. (Calculated
using the standard hypergeometric test.) The color of the arrows code
«is a» (cyan) and «part of» relationships.
The tree was built the following way. First all GO terms with more
significant enrichment p-value than 0.05 were collected. Then all
paths from these terms to the root node of the GO tree were included
too. If a GO term is included more than once in the tree, then the
green numbers show 1) the id of the node, this makes it easier to find
other appereances of the term, and 2) the number of appearences.
Note that the same GO category might show up on the graph many
times. This is because the GO was «straightened» for this
graph, i.e. if there are more paths from a GO term to the root node of
the tree, all of them are included. The green numbers
Move the mouse cursor over the terms to get their definition. Clicking
on them takes you to the corresponding Gene Ontology web page.
If you cannot see a graph here at all, that means that there were no
significantly enriched GO categories, at the 0.05 level.
— Click on the Help button again to close this help window.
Help |
Hide |
Top
Help |
Show |
Top
GO BP test for over-representation
HELP
List of all enriched GO categories (biological processes), at the 0.05
p-value level.
The columns:
- ExpCount is the expected count of genes in the
module annotated with the given GO term, just by chance.
- Count
is the number of genes in the module annotated with the given GO
term.
- Size is the total number of genes (in our universe)
annotated with the GO term.
Clicking on Count shows the genes that drive the
enrichment. You can also click on the individual numbers in
the Count column, to show the driving genes for that individual
GO category.
Clicking on the GO identifiers takes you to the Gene Ontology web
pages.
— Click on the Help button again to close this help window.
| Id | Pvalue | ExpCount | Count | Size | Term |
| GO:0002573 | 1.414e-02 | 0.5296 | 5
CHUK, NFKBIA, OSTM1, SOAT1, SP3 | 46 | myeloid leukocyte differentiation |
| GO:0007253 | 2.643e-02 | 0.03454 | 2
G3BP2, NFKBIA | 3 | cytoplasmic sequestering of NF-kappaB |
| GO:0042347 | 2.643e-02 | 0.03454 | 2
G3BP2, NFKBIA | 3 | negative regulation of NF-kappaB import into nucleus |
Help |
Hide |
Top
Help |
Show |
Top
GO CC test for over-representation
HELP
List of all enriched GO categories (cellular components), at the 0.05
p-value level.
The columns:
- ExpCount is the expected count of genes in the
module annotated with the given GO term, just by chance.
- Count
is the number of genes in the module annotated with the given GO
term.
- Size is the total number of genes (in our universe)
annotated with the GO term.
Clicking on Count shows the genes that drive the
enrichment. You can also click on the individual numbers in
the Count column, to show the driving genes for that individual
GO category.
Clicking on the GO identifiers takes you to the Gene Ontology web
pages.
— Click on the Help button again to close this help window.
Help |
Hide |
Top
Help |
Show |
Top
GO MF test for over-representation
HELP
List of all enriched GO categories (molecular function), at the 0.05
p-value level.
The columns:
- ExpCount is the expected count of genes in the
module annotated with the given GO term, just by chance.
- Count
is the number of genes in the module annotated with the given GO
term.
- Size is the total number of genes (in our universe)
annotated with the GO term.
Clicking on Count shows the genes that drive the
enrichment. You can also click on the individual numbers in
the Count column, to show the driving genes for that individual
GO category.
Clicking on the GO identifiers takes you to the Gene Ontology web
pages.
— Click on the Help button again to close this help window.
Help |
Hide |
Top
Help |
Show |
Top
KEGG Pathway test for over-representation
HELP
List of all enriched KEGG pathways, at the 0.05
p-value level.
The columns:
- ExpCount is the expected count of genes in the
module annotated with the given KEGG pathway, just by chance.
- Count
is the number of genes in the module annotated with the given KEGG
pathway.
- Size is the total number of genes (in our universe)
annotated with the KEGG pathway.
Clicking on Count shows the genes that drive the
enrichment. You can also click on the individual numbers in
the Count column, to show the driving genes for that individual
KEGG pathway.
Clicking on the KEGG identifiers takes you to the KEGG web site.
— Click on the Help button again to close this help window.
Help |
Hide |
Top
Help |
Show |
Top
miRNA test for over-representation
HELP
List of all enriched miRNA families, at the 0.05
p-value level.
The columns:
- ExpCount is the expected count of genes in the
module regulated by the given miRNA family, just by chance.
- Count
is the number of genes in the module regulated by the given miRNA
family.
- Size is the total number of genes (in our universe)
regulated with the given miRNA family.
Clicking on Count shows the genes that drive the
enrichment. You can also click on the individual numbers in
the Count column, to show the driving genes for that individual
miRNA family.
The miRNA regulation data was taken from the TargetScan database.
(Only the conserved sites were used for the current analysis.)
Clicking on the miRNA names takes you to the TargetScan web site.
— Click on the Help button again to close this help window.
Help |
Hide |
Top
Help |
Show |
Top
Chromosome test for over-representation
HELP
List of all enriched Chromosomes, at the 0.05
p-value level.
The columns:
- ExpCount is the expected number of genes in the
module on the given chromosome, just by chance.
- Count
is the number of genes in the module on the given chromosome.
- Size is the total number of genes (in our universe)
on the given chromosome.
Clicking on Count shows the genes that drive the
enrichment. You can also click on the individual numbers in
the Count column, to show the driving genes for that individual
chromosome.
— Click on the Help button again to close this help window.
HELP
A list of all genes in the current module, in alphabetical order. The
size of the text corresponds to the gene scores.
Note that some gene symbols may show up more than once, if many
probes match the same Entrez gene.
Genes with no Entrez mapping are given separately, with their
Affymetrics probe ID.
— Click on the Help button again to close this help window.
Entrez genes
ABCE1ATP-binding cassette, sub-family E (OABP), member 1 (201873_s_at), score: 0.72
ACAP2ArfGAP with coiled-coil, ankyrin repeat and PH domains 2 (212476_at), score: 0.75
ACSL4acyl-CoA synthetase long-chain family member 4 (202422_s_at), score: 0.84
ADCK2aarF domain containing kinase 2 (221893_s_at), score: -0.62
AGPAT11-acylglycerol-3-phosphate O-acyltransferase 1 (lysophosphatidic acid acyltransferase, alpha) (215535_s_at), score: -0.59
ARSAarylsulfatase A (204443_at), score: -0.61
ATF2activating transcription factor 2 (212984_at), score: 0.77
ATN1atrophin 1 (40489_at), score: -0.61
ATP2C1ATPase, Ca++ transporting, type 2C, member 1 (211137_s_at), score: 0.72
ATP8B1ATPase, class I, type 8B, member 1 (214594_x_at), score: 0.68
BTBD2BTB (POZ) domain containing 2 (207722_s_at), score: -0.74
C4orf43chromosome 4 open reading frame 43 (218513_at), score: 0.88
C5orf28chromosome 5 open reading frame 28 (219029_at), score: 0.69
C5orf44chromosome 5 open reading frame 44 (218674_at), score: 0.88
C6orf211chromosome 6 open reading frame 211 (218195_at), score: 0.73
CAPZA2capping protein (actin filament) muscle Z-line, alpha 2 (201237_at), score: 0.71
CD2APCD2-associated protein (203593_at), score: 0.69
CDC73cell division cycle 73, Paf1/RNA polymerase II complex component, homolog (S. cerevisiae) (218578_at), score: 0.74
CHMP5chromatin modifying protein 5 (218085_at), score: 0.85
CHORDC1cysteine and histidine-rich domain (CHORD)-containing 1 (218566_s_at), score: 0.8
CHUKconserved helix-loop-helix ubiquitous kinase (209666_s_at), score: 0.79
CICcapicua homolog (Drosophila) (212784_at), score: -0.72
CIZ1CDKN1A interacting zinc finger protein 1 (205516_x_at), score: -0.65
CMPK1cytidine monophosphate (UMP-CMP) kinase 1, cytosolic (217870_s_at), score: 0.74
CNOT3CCR4-NOT transcription complex, subunit 3 (203239_s_at), score: -0.6
CRTC3CREB regulated transcription coactivator 3 (218648_at), score: -0.61
DNAJB9DnaJ (Hsp40) homolog, subfamily B, member 9 (202843_at), score: 0.73
DOPEY1dopey family member 1 (40612_at), score: 0.71
EIF3Meukaryotic translation initiation factor 3, subunit M (202231_at), score: 0.7
EIF4Eeukaryotic translation initiation factor 4E (201436_at), score: 0.75
EPS15epidermal growth factor receptor pathway substrate 15 (217887_s_at), score: 0.75
ERBB2IPerbb2 interacting protein (217941_s_at), score: 0.72
FAM18Bfamily with sequence similarity 18, member B (218446_s_at), score: 1
FRG1FSHD region gene 1 (204145_at), score: 0.7
FUBP3far upstream element (FUSE) binding protein 3 (212824_at), score: 0.7
G3BP2GTPase activating protein (SH3 domain) binding protein 2 (208841_s_at), score: 0.82
GMCL1germ cell-less homolog 1 (Drosophila) (218458_at), score: 0.73
HISPPD1histidine acid phosphatase domain containing 1 (203253_s_at), score: 0.86
HMGA1high mobility group AT-hook 1 (210457_x_at), score: -0.59
HNRNPH2heterogeneous nuclear ribonucleoprotein H2 (H') (201132_at), score: 0.88
HSD17B6hydroxysteroid (17-beta) dehydrogenase 6 homolog (mouse) (37512_at), score: 0.74
IBTKinhibitor of Bruton agammaglobulinemia tyrosine kinase (210970_s_at), score: 0.74
IMPACTImpact homolog (mouse) (218637_at), score: 0.72
JMJD1Cjumonji domain containing 1C (221763_at), score: 0.69
JUNDjun D proto-oncogene (203751_x_at), score: -0.68
KAL1Kallmann syndrome 1 sequence (205206_at), score: 0.76
KIAA0562KIAA0562 (204075_s_at), score: 0.69
LARP4La ribonucleoprotein domain family, member 4 (214155_s_at), score: 0.87
LOC100132540similar to LOC339047 protein (214870_x_at), score: -0.62
LOC391132similar to hCG2041276 (216177_at), score: 0.69
LPGAT1lysophosphatidylglycerol acyltransferase 1 (202651_at), score: 0.82
LRRC40leucine rich repeat containing 40 (218577_at), score: 0.76
MAP1Smicrotubule-associated protein 1S (218522_s_at), score: -0.73
MAP3K6mitogen-activated protein kinase kinase kinase 6 (219278_at), score: -0.6
MAP7D1MAP7 domain containing 1 (217943_s_at), score: -0.58
MAPK1IP1Lmitogen-activated protein kinase 1 interacting protein 1-like (212499_s_at), score: 0.69
MATR3matrin 3 (200626_s_at), score: 0.77
MINK1misshapen-like kinase 1 (zebrafish) (214246_x_at), score: -0.61
MUC1mucin 1, cell surface associated (207847_s_at), score: -0.66
NDUFA5NADH dehydrogenase (ubiquinone) 1 alpha subcomplex, 5, 13kDa (201304_at), score: 0.85
NFATC4nuclear factor of activated T-cells, cytoplasmic, calcineurin-dependent 4 (205897_at), score: -0.59
NFKBIAnuclear factor of kappa light polypeptide gene enhancer in B-cells inhibitor, alpha (201502_s_at), score: -0.62
NPIPnuclear pore complex interacting protein (204538_x_at), score: -0.68
NUP160nucleoporin 160kDa (212709_at), score: 0.74
OSTM1osteopetrosis associated transmembrane protein 1 (218196_at), score: 0.85
PAQR3progestin and adipoQ receptor family member III (213372_at), score: 0.75
PCDH9protocadherin 9 (219737_s_at), score: 0.68
PCDHG@protocadherin gamma cluster (215836_s_at), score: -0.59
PCDHGA1protocadherin gamma subfamily A, 1 (209079_x_at), score: -0.62
PEX6peroxisomal biogenesis factor 6 (204545_at), score: -0.65
PIP5K1Cphosphatidylinositol-4-phosphate 5-kinase, type I, gamma (212518_at), score: -0.66
PLCD1phospholipase C, delta 1 (205125_at), score: -0.62
PNPLA2patatin-like phospholipase domain containing 2 (212705_x_at), score: -0.77
POLR2Apolymerase (RNA) II (DNA directed) polypeptide A, 220kDa (202725_at), score: -0.57
PPP1CBprotein phosphatase 1, catalytic subunit, beta isoform (201407_s_at), score: 0.69
PRMT3protein arginine methyltransferase 3 (213320_at), score: 0.85
PVRL3poliovirus receptor-related 3 (213325_at), score: 0.71
RAB1ARAB1A, member RAS oncogene family (213440_at), score: 0.85
RABGGTBRab geranylgeranyltransferase, beta subunit (213704_at), score: 0.74
RANBP6RAN binding protein 6 (213019_at), score: 0.76
RBM15BRNA binding motif protein 15B (202689_at), score: -0.61
RECQLRecQ protein-like (DNA helicase Q1-like) (205091_x_at), score: 0.73
RNF11ring finger protein 11 (208924_at), score: 0.74
RNF220ring finger protein 220 (219988_s_at), score: -0.58
RPS17P5ribosomal protein S17 pseudogene 5 (216348_at), score: 0.77
RPS25ribosomal protein S25 (200091_s_at), score: 0.72
RRP15ribosomal RNA processing 15 homolog (S. cerevisiae) (219037_at), score: 0.72
SACM1LSAC1 suppressor of actin mutations 1-like (yeast) (202797_at), score: 0.71
SBNO2strawberry notch homolog 2 (Drosophila) (204166_at), score: -0.58
SCAMP4secretory carrier membrane protein 4 (213244_at), score: -0.59
SEP1515 kDa selenoprotein (200902_at), score: 0.68
SLC30A9solute carrier family 30 (zinc transporter), member 9 (202614_at), score: 0.73
SLC33A1solute carrier family 33 (acetyl-CoA transporter), member 1 (203165_s_at), score: 0.68
SLC4A7solute carrier family 4, sodium bicarbonate cotransporter, member 7 (209884_s_at), score: 0.77
SLMO2slowmo homolog 2 (Drosophila) (217851_s_at), score: 0.94
SOAT1sterol O-acyltransferase 1 (221561_at), score: 0.68
SOLHsmall optic lobes homolog (Drosophila) (204275_at), score: -0.59
SP3Sp3 transcription factor (213168_at), score: 0.76
SPG20spastic paraplegia 20 (Troyer syndrome) (212526_at), score: 0.68
STXBP3syntaxin binding protein 3 (203310_at), score: 0.75
TAF2TAF2 RNA polymerase II, TATA box binding protein (TBP)-associated factor, 150kDa (209523_at), score: 0.87
TCEB1transcription elongation factor B (SIII), polypeptide 1 (15kDa, elongin C) (202823_at), score: 0.74
TICAM2toll-like receptor adaptor molecule 2 (214658_at), score: 1
TM9SF3transmembrane 9 superfamily member 3 (217758_s_at), score: 0.75
TMED7transmembrane emp24 protein transport domain containing 7 (209404_s_at), score: 0.73
TMEM123transmembrane protein 123 (211967_at), score: 0.81
TMEM30Atransmembrane protein 30A (217743_s_at), score: 0.72
TMF1TATA element modulatory factor 1 (213024_at), score: 0.7
TSNAXtranslin-associated factor X (203983_at), score: 0.7
UGDHUDP-glucose dehydrogenase (203343_at), score: 0.73
VEGFBvascular endothelial growth factor B (203683_s_at), score: -0.67
VPS13Cvacuolar protein sorting 13 homolog C (S. cerevisiae) (218396_at), score: 0.76
VPS37Bvacuolar protein sorting 37 homolog B (S. cerevisiae) (221704_s_at), score: -0.68
XAB2XPA binding protein 2 (218110_at), score: -0.58
YTHDC2YTH domain containing 2 (213077_at), score: 0.77
YTHDF3YTH domain family, member 3 (221749_at), score: 0.71
ZC3H14zinc finger CCCH-type containing 14 (213064_at), score: 0.69
ZCCHC10zinc finger, CCHC domain containing 10 (221193_s_at), score: 0.79
Non-Entrez genes
Unknown, score:
HELP
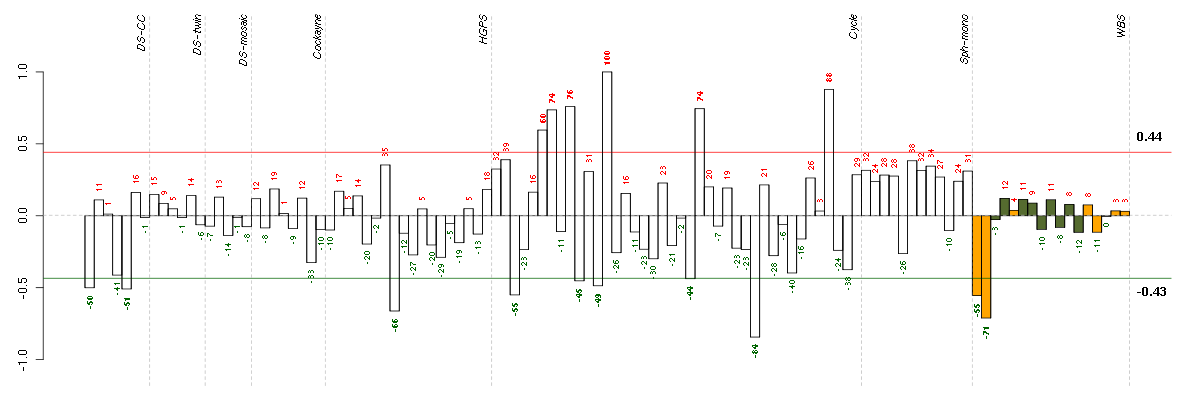
Conditions in the module, given in the same order as on the expression
plot above. Red color means over-expression, green under-expression in
the given condition.
The barplot below shows the condition (sample) scores. A separate bar
is shown for each sample, its height is the corresponding score of the
sample in the module. The red and green numbers on the bars are the
sample scores expressed in percents, i.e. 100% is 1.0.
The red and green lines show the module thresholds, samples above
the red line and below the green line are included in the module.
The different experiments that were part of the study, are separated
by dashed vertical lines.
— Click on the Help button again to close this help window.
| Id | sample | Experiment | ExpName | Array | Syndrome | Cell.line |
| E-TABM-263-raw-cel-1515486211.cel | 29 | 6 | Cycle | hgu133a2 | none | Cycle 1 |
| 10590_WBS.CEL | 2 | 8 | WBS | hgu133plus2 | WBS | WBS 1 |
| E-GEOD-3860-raw-cel-1561690304.cel | 8 | 5 | HGPS | hgu133a | none | GMO8398C |
| 10358_WBS.CEL | 1 | 8 | WBS | hgu133plus2 | WBS | WBS 1 |
| E-TABM-263-raw-cel-1515485691.cel | 3 | 6 | Cycle | hgu133a2 | none | Cycle 1 |
| t21b 08-03.CEL | 5 | 1 | DS-CC | hgu133a | Down | DS-CC 5 |
| ctrl a 08-03.CEL | 1 | 1 | DS-CC | hgu133a | none | DS-CC 1 |
| E-TABM-263-raw-cel-1515485871.cel | 12 | 6 | Cycle | hgu133a2 | none | Cycle 1 |
| E-TABM-263-raw-cel-1515485831.cel | 10 | 6 | Cycle | hgu133a2 | none | Cycle 1 |
| E-TABM-263-raw-cel-1515486071.cel | 22 | 6 | Cycle | hgu133a2 | none | Cycle 1 |
| E-TABM-263-raw-cel-1515485751.cel | 6 | 6 | Cycle | hgu133a2 | none | Cycle 1 |
| E-TABM-263-raw-cel-1515485771.cel | 7 | 6 | Cycle | hgu133a2 | none | Cycle 1 |
| E-TABM-263-raw-cel-1515486091.cel | 23 | 6 | Cycle | hgu133a2 | none | Cycle 1 |
| E-TABM-263-raw-cel-1515485811.cel | 9 | 6 | Cycle | hgu133a2 | none | Cycle 1 |
| E-TABM-263-raw-cel-1515486371.cel | 37 | 6 | Cycle | hgu133a2 | none | Cycle 1 |
| E-TABM-263-raw-cel-1515485891.cel | 13 | 6 | Cycle | hgu133a2 | none | Cycle 1 |


© 2008-2010 Computational Biology Group, Department of Medical Genetics,
University of Lausanne, Switzerland