Previous module |
Next module
Module #778, TG: 2.6, TC: 1.2, 104 probes, 104 Entrez genes, 9 conditions


HELP
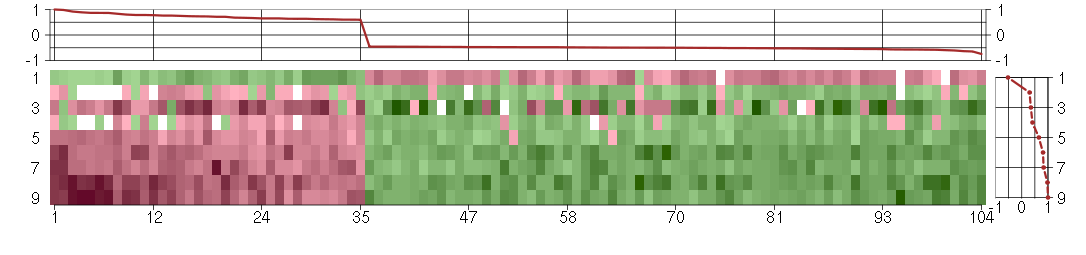
The image plot shows the color-coded level of gene expression, for the
genes and conditions in a given transcription module. The genes are on
the horizontal, the conditions on the vertical axis.
The genes are ordered according to their ISA gene scores, similarly
the conditions are ordered according to their condition scores. The
score of a gene means the «degree of inclusion» in
the module: a high score gene is essential in the module.
Condition scores can also be negative, that means that the genes of
the module are all down-regulated in the condition. Here the absolute
value of the score gives the «degree of inclusion».
The plots above and beside the expression matrix show the gene scores
and condition scores, respectively.
Note that the plot is interactive, you can see the name of the gene
and condition under the mouse cursor.
The expression matrix was normalized to have mean zero and standard
deviation one for every gene separately across all conditions
(i.e. not just for the conditions in the module).
— Click on the Help button again to close this help window.

Under-expression is coded with green,
over-expression with red color.
Help |
Hide |
Top
Help |
Show |
Top
The GO tree — Biological processes
HELP
This is one of three sections showing Gene Ontology enrichment of the
current module: in this case for biological processes.
The graph shows the hierarchy of the GO categories, their enrichment
for the current module is color coded, and the blue number beside the
category is the minus log ten p-value of the enrichment. (Calculated
using the standard hypergeometric test.) The color of the arrows code
«is a» (cyan) and «part of» relationships.
The tree was built the following way. First all GO terms with more
significant enrichment p-value than 0.05 were collected. Then all
paths from these terms to the root node of the GO tree were included
too. If a GO term is included more than once in the tree, then the
green numbers show 1) the id of the node, this makes it easier to find
other appereances of the term, and 2) the number of appearences.
Note that the same GO category might show up on the graph many
times. This is because the GO was «straightened» for this
graph, i.e. if there are more paths from a GO term to the root node of
the tree, all of them are included. The green numbers
Move the mouse cursor over the terms to get their definition. Clicking
on them takes you to the corresponding Gene Ontology web page.
If you cannot see a graph here at all, that means that there were no
significantly enriched GO categories, at the 0.05 level.
— Click on the Help button again to close this help window.

Help |
Hide |
Top
Help |
Show |
Top
The GO tree — Cellular Components
HELP
This is one of three sections showing Gene Ontology enrichment of the
current module: in this case for cellular components.
The graph shows the hierarchy of the GO categories, their enrichment
for the current module is color coded, and the blue number beside the
category is the minus log ten p-value of the enrichment. (Calculated
using the standard hypergeometric test.) The color of the arrows code
«is a» (cyan) and «part of» relationships.
The tree was built the following way. First all GO terms with more
significant enrichment p-value than 0.05 were collected. Then all
paths from these terms to the root node of the GO tree were included
too. If a GO term is included more than once in the tree, then the
green numbers show 1) the id of the node, this makes it easier to find
other appereances of the term, and 2) the number of appearences.
Note that the same GO category might show up on the graph many
times. This is because the GO was «straightened» for this
graph, i.e. if there are more paths from a GO term to the root node of
the tree, all of them are included. The green numbers
Move the mouse cursor over the terms to get their definition. Clicking
on them takes you to the corresponding Gene Ontology web page.
If you cannot see a graph here at all, that means that there were no
significantly enriched GO categories, at the 0.05 level.
— Click on the Help button again to close this help window.
Help |
Hide |
Top
Help |
Show |
Top
The GO tree — Molecular Function
HELP
This is one of three sections showing Gene Ontology enrichment of the
current module: in this case for molecular function.
The graph shows the hierarchy of the GO categories, their enrichment
for the current module is color coded, and the blue number beside the
category is the minus log ten p-value of the enrichment. (Calculated
using the standard hypergeometric test.) The color of the arrows code
«is a» (cyan) and «part of» relationships.
The tree was built the following way. First all GO terms with more
significant enrichment p-value than 0.05 were collected. Then all
paths from these terms to the root node of the GO tree were included
too. If a GO term is included more than once in the tree, then the
green numbers show 1) the id of the node, this makes it easier to find
other appereances of the term, and 2) the number of appearences.
Note that the same GO category might show up on the graph many
times. This is because the GO was «straightened» for this
graph, i.e. if there are more paths from a GO term to the root node of
the tree, all of them are included. The green numbers
Move the mouse cursor over the terms to get their definition. Clicking
on them takes you to the corresponding Gene Ontology web page.
If you cannot see a graph here at all, that means that there were no
significantly enriched GO categories, at the 0.05 level.
— Click on the Help button again to close this help window.
Help |
Hide |
Top
Help |
Show |
Top
GO BP test for over-representation
HELP
List of all enriched GO categories (biological processes), at the 0.05
p-value level.
The columns:
- ExpCount is the expected count of genes in the
module annotated with the given GO term, just by chance.
- Count
is the number of genes in the module annotated with the given GO
term.
- Size is the total number of genes (in our universe)
annotated with the GO term.
Clicking on Count shows the genes that drive the
enrichment. You can also click on the individual numbers in
the Count column, to show the driving genes for that individual
GO category.
Clicking on the GO identifiers takes you to the Gene Ontology web
pages.
— Click on the Help button again to close this help window.
| Id | Pvalue | ExpCount | Count | Size | Term |
| GO:0009725 | 2.163e-02 | 0.9216 | 6
ABCB4, GATA3, IRS2, KRT19, PRKACA, UGT1A1 | 82 | response to hormone stimulus |
| GO:0006805 | 2.491e-02 | 0.1461 | 3
UGT1A1, UGT1A6, UGT1A9 | 13 | xenobiotic metabolic process |
| GO:0019896 | 2.546e-02 | 0.03372 | 2
NEFL, UCHL1 | 3 | axon transport of mitochondrion |
| GO:0009719 | 2.983e-02 | 1 | 6
ABCB4, GATA3, IRS2, KRT19, PRKACA, UGT1A1 | 89 | response to endogenous stimulus |
| GO:0009410 | 3.918e-02 | 0.1798 | 3
UGT1A1, UGT1A6, UGT1A9 | 16 | response to xenobiotic stimulus |
| GO:0048545 | 4.680e-02 | 0.4383 | 4
ABCB4, GATA3, KRT19, UGT1A1 | 39 | response to steroid hormone stimulus |
Help |
Hide |
Top
Help |
Show |
Top
GO CC test for over-representation
HELP
List of all enriched GO categories (cellular components), at the 0.05
p-value level.
The columns:
- ExpCount is the expected count of genes in the
module annotated with the given GO term, just by chance.
- Count
is the number of genes in the module annotated with the given GO
term.
- Size is the total number of genes (in our universe)
annotated with the GO term.
Clicking on Count shows the genes that drive the
enrichment. You can also click on the individual numbers in
the Count column, to show the driving genes for that individual
GO category.
Clicking on the GO identifiers takes you to the Gene Ontology web
pages.
— Click on the Help button again to close this help window.
| Id | Pvalue | ExpCount | Count | Size | Term |
| GO:0005576 | 1.231e-02 | 7.593 | 18
C3orf64, C4orf31, CNP, COMP, CRTAP, FAM108A1, FBN2, IGFBP3, ISLR, KIAA0495, LAMB3, MFAP5, NMU, PTHLH, PXDN, SCG5, SNCA, TIMP2 | 700 | extracellular region |
| GO:0005578 | 3.482e-02 | 1.692 | 7
COMP, CRTAP, FBN2, LAMB3, MFAP5, SNCA, TIMP2 | 156 | proteinaceous extracellular matrix |
| GO:0031012 | 4.638e-02 | 1.801 | 7
COMP, CRTAP, FBN2, LAMB3, MFAP5, SNCA, TIMP2 | 166 | extracellular matrix |
Help |
Hide |
Top
Help |
Show |
Top
GO MF test for over-representation
HELP
List of all enriched GO categories (molecular function), at the 0.05
p-value level.
The columns:
- ExpCount is the expected count of genes in the
module annotated with the given GO term, just by chance.
- Count
is the number of genes in the module annotated with the given GO
term.
- Size is the total number of genes (in our universe)
annotated with the GO term.
Clicking on Count shows the genes that drive the
enrichment. You can also click on the individual numbers in
the Count column, to show the driving genes for that individual
GO category.
Clicking on the GO identifiers takes you to the Gene Ontology web
pages.
— Click on the Help button again to close this help window.
| Id | Pvalue | ExpCount | Count | Size | Term |
| GO:0015020 | 2.483e-02 | 0.1319 | 3
UGT1A1, UGT1A6, UGT1A9 | 12 | glucuronosyltransferase activity |
| GO:0008559 | 3.056e-02 | 0.03298 | 2
ABCB1, ABCB4 | 3 | xenobiotic-transporting ATPase activity |
| GO:0015239 | 3.056e-02 | 0.03298 | 2
ABCB1, ABCB4 | 3 | multidrug transporter activity |
| GO:0042910 | 3.056e-02 | 0.03298 | 2
ABCB1, ABCB4 | 3 | xenobiotic transporter activity |
Help |
Hide |
Top
Help |
Show |
Top
KEGG Pathway test for over-representation
HELP
List of all enriched KEGG pathways, at the 0.05
p-value level.
The columns:
- ExpCount is the expected count of genes in the
module annotated with the given KEGG pathway, just by chance.
- Count
is the number of genes in the module annotated with the given KEGG
pathway.
- Size is the total number of genes (in our universe)
annotated with the KEGG pathway.
Clicking on Count shows the genes that drive the
enrichment. You can also click on the individual numbers in
the Count column, to show the driving genes for that individual
KEGG pathway.
Clicking on the KEGG identifiers takes you to the KEGG web site.
— Click on the Help button again to close this help window.
| Id | Pvalue | ExpCount | Count | Size | Term |
| 00500 | 8.995e-03 | 0.2553 | 4
UGT1A1, UGT1A6, UGT1A9, UXS1 | 24 | Starch and sucrose metabolism |
| 00860 | 8.995e-03 | 0.2553 | 4
UGT1A1, UGT1A6, UGT1A9, UROS | 24 | Porphyrin and chlorophyll metabolism |
| 00040 | 2.140e-02 | 0.1383 | 3
UGT1A1, UGT1A6, UGT1A9 | 13 | Pentose and glucuronate interconversions |
Help |
Hide |
Top
Help |
Show |
Top
miRNA test for over-representation
HELP
List of all enriched miRNA families, at the 0.05
p-value level.
The columns:
- ExpCount is the expected count of genes in the
module regulated by the given miRNA family, just by chance.
- Count
is the number of genes in the module regulated by the given miRNA
family.
- Size is the total number of genes (in our universe)
regulated with the given miRNA family.
Clicking on Count shows the genes that drive the
enrichment. You can also click on the individual numbers in
the Count column, to show the driving genes for that individual
miRNA family.
The miRNA regulation data was taken from the TargetScan database.
(Only the conserved sites were used for the current analysis.)
Clicking on the miRNA names takes you to the TargetScan web site.
— Click on the Help button again to close this help window.
Help |
Hide |
Top
Help |
Show |
Top
Chromosome test for over-representation
HELP
List of all enriched Chromosomes, at the 0.05
p-value level.
The columns:
- ExpCount is the expected number of genes in the
module on the given chromosome, just by chance.
- Count
is the number of genes in the module on the given chromosome.
- Size is the total number of genes (in our universe)
on the given chromosome.
Clicking on Count shows the genes that drive the
enrichment. You can also click on the individual numbers in
the Count column, to show the driving genes for that individual
chromosome.
— Click on the Help button again to close this help window.
HELP
A list of all genes in the current module, in alphabetical order. The
size of the text corresponds to the gene scores.
Note that some gene symbols may show up more than once, if many
probes match the same Entrez gene.
Genes with no Entrez mapping are given separately, with their
Affymetrics probe ID.
— Click on the Help button again to close this help window.
Entrez genes
ABCB1ATP-binding cassette, sub-family B (MDR/TAP), member 1 (209993_at), score: 0.98
ABCB4ATP-binding cassette, sub-family B (MDR/TAP), member 4 (207819_s_at), score: 0.71
AIM2absent in melanoma 2 (206513_at), score: 0.73
ARHGAP1Rho GTPase activating protein 1 (202117_at), score: -0.47
BAZ2Abromodomain adjacent to zinc finger domain, 2A (201353_s_at), score: 0.6
BHMT2betaine-homocysteine methyltransferase 2 (219902_at), score: 0.74
C10orf116chromosome 10 open reading frame 116 (203571_s_at), score: -0.49
C20orf149chromosome 20 open reading frame 149 (218010_x_at), score: -0.54
C3orf64chromosome 3 open reading frame 64 (221935_s_at), score: -0.48
C4orf31chromosome 4 open reading frame 31 (219747_at), score: -0.48
C5orf23chromosome 5 open reading frame 23 (219054_at), score: -0.47
C5orf30chromosome 5 open reading frame 30 (221823_at), score: -0.5
CA3carbonic anhydrase III, muscle specific (204865_at), score: 0.64
CDR2Lcerebellar degeneration-related protein 2-like (213230_at), score: -0.63
CHPcalcium binding protein P22 (214665_s_at), score: -0.46
CNP2',3'-cyclic nucleotide 3' phosphodiesterase (208912_s_at), score: -0.47
COMPcartilage oligomeric matrix protein (205713_s_at), score: -0.52
COPZ2coatomer protein complex, subunit zeta 2 (219561_at), score: -0.49
CRTAPcartilage associated protein (201380_at), score: -0.57
CRYABcrystallin, alpha B (209283_at), score: -0.47
CYBAcytochrome b-245, alpha polypeptide (203028_s_at), score: -0.51
DDX17DEAD (Asp-Glu-Ala-Asp) box polypeptide 17 (208151_x_at), score: 0.83
DDX3XDEAD (Asp-Glu-Ala-Asp) box polypeptide 3, X-linked (201211_s_at), score: 0.65
DDX3YDEAD (Asp-Glu-Ala-Asp) box polypeptide 3, Y-linked (205000_at), score: -0.5
DIO2deiodinase, iodothyronine, type II (203699_s_at), score: 0.79
EIF1AYeukaryotic translation initiation factor 1A, Y-linked (204409_s_at), score: -0.5
FAM108A1family with sequence similarity 108, member A1 (221267_s_at), score: -0.51
FAM169Afamily with sequence similarity 169, member A (213954_at), score: 0.75
FAT1FAT tumor suppressor homolog 1 (Drosophila) (201579_at), score: -0.5
FBN2fibrillin 2 (203184_at), score: -0.54
FBXW7F-box and WD repeat domain containing 7 (218751_s_at), score: -0.47
FKBP9FK506 binding protein 9, 63 kDa (212169_at), score: -0.59
GAGE4G antigen 4 (207086_x_at), score: 0.92
GAGE6G antigen 6 (208155_x_at), score: 0.87
GATA3GATA binding protein 3 (209604_s_at), score: 0.8
GLSglutaminase (203159_at), score: -0.48
GLTPglycolipid transfer protein (219267_at), score: -0.52
GSPT2G1 to S phase transition 2 (205541_s_at), score: -0.52
HAS2hyaluronan synthase 2 (206432_at), score: -0.48
HERC5hect domain and RLD 5 (219863_at), score: 0.76
HGSNATheparan-alpha-glucosaminide N-acetyltransferase (218017_s_at), score: -0.58
HIST1H4Chistone cluster 1, H4c (205967_at), score: -0.55
HSPB7heat shock 27kDa protein family, member 7 (cardiovascular) (218934_s_at), score: -0.57
IGFBP3insulin-like growth factor binding protein 3 (212143_s_at), score: -0.5
IRS2insulin receptor substrate 2 (209185_s_at), score: -0.5
ISLRimmunoglobulin superfamily containing leucine-rich repeat (207191_s_at), score: -0.53
JARID1Djumonji, AT rich interactive domain 1D (206700_s_at), score: -0.46
KIAA0495KIAA0495 (213340_s_at), score: -0.65
KIF3Akinesin family member 3A (213623_at), score: 0.62
KRT19keratin 19 (201650_at), score: -0.46
LAMB3laminin, beta 3 (209270_at), score: 0.64
LRRFIP1leucine rich repeat (in FLII) interacting protein 1 (201861_s_at), score: -0.52
MAN2A1mannosidase, alpha, class 2A, member 1 (205105_at), score: -0.58
MAP3K3mitogen-activated protein kinase kinase kinase 3 (203514_at), score: -0.47
MARCH2membrane-associated ring finger (C3HC4) 2 (210075_at), score: -0.55
MARK1MAP/microtubule affinity-regulating kinase 1 (221047_s_at), score: 0.76
MFAP5microfibrillar associated protein 5 (213764_s_at), score: -0.49
MT1P3metallothionein 1 pseudogene 3 (221953_s_at), score: -0.52
MYO1Cmyosin IC (214656_x_at), score: -0.74
NAPGN-ethylmaleimide-sensitive factor attachment protein, gamma (210048_at), score: 0.64
NCRNA00084non-protein coding RNA 84 (214657_s_at), score: 0.73
NEFLneurofilament, light polypeptide (221805_at), score: 0.71
NMUneuromedin U (206023_at), score: 0.65
NRGNneurogranin (protein kinase C substrate, RC3) (204081_at), score: 0.65
OASL2'-5'-oligoadenylate synthetase-like (210797_s_at), score: 1
OPCMLopioid binding protein/cell adhesion molecule-like (214111_at), score: -0.48
PDPK13-phosphoinositide dependent protein kinase-1 (204524_at), score: -0.51
PILRBpaired immunoglobin-like type 2 receptor beta (220954_s_at), score: 0.68
PPM2Cprotein phosphatase 2C, magnesium-dependent, catalytic subunit (218273_s_at), score: 0.6
PRKACAprotein kinase, cAMP-dependent, catalytic, alpha (202801_at), score: -0.46
PTHLHparathyroid hormone-like hormone (211756_at), score: -0.46
PXDNperoxidasin homolog (Drosophila) (212013_at), score: -0.48
RAB7L1RAB7, member RAS oncogene family-like 1 (218700_s_at), score: 0.61
RABGAP1LRAB GTPase activating protein 1-like (213982_s_at), score: -0.48
RPS4Y1ribosomal protein S4, Y-linked 1 (201909_at), score: -0.48
SCG5secretogranin V (7B2 protein) (203889_at), score: -0.46
SGCDsarcoglycan, delta (35kDa dystrophin-associated glycoprotein) (213543_at), score: -0.47
SLC16A1solute carrier family 16, member 1 (monocarboxylic acid transporter 1) (209900_s_at), score: -0.57
SLC30A1solute carrier family 30 (zinc transporter), member 1 (212907_at), score: -0.54
SLC4A4solute carrier family 4, sodium bicarbonate cotransporter, member 4 (203908_at), score: -0.49
SMG1SMG1 homolog, phosphatidylinositol 3-kinase-related kinase (C. elegans) (210057_at), score: 0.67
SNCAsynuclein, alpha (non A4 component of amyloid precursor) (204466_s_at), score: 0.79
SSR3signal sequence receptor, gamma (translocon-associated protein gamma) (217790_s_at), score: -0.61
TCEAL2transcription elongation factor A (SII)-like 2 (211276_at), score: 0.78
TIMP2TIMP metallopeptidase inhibitor 2 (203167_at), score: -0.55
TMEM204transmembrane protein 204 (219315_s_at), score: -0.5
TMOD1tropomodulin 1 (203661_s_at), score: 0.67
TNS1tensin 1 (221748_s_at), score: -0.51
TOB1transducer of ERBB2, 1 (202704_at), score: -0.54
TSPYL1TSPY-like 1 (221493_at), score: -0.5
TSPYL5TSPY-like 5 (213122_at), score: -0.57
UAP1UDP-N-acteylglucosamine pyrophosphorylase 1 (209340_at), score: -0.53
UBE2D4ubiquitin-conjugating enzyme E2D 4 (putative) (218837_s_at), score: -0.46
UBL3ubiquitin-like 3 (201535_at), score: -0.51
UCHL1ubiquitin carboxyl-terminal esterase L1 (ubiquitin thiolesterase) (201387_s_at), score: -0.55
UGT1A1UDP glucuronosyltransferase 1 family, polypeptide A1 (207126_x_at), score: 0.87
UGT1A6UDP glucuronosyltransferase 1 family, polypeptide A6 (206094_x_at), score: 0.89
UGT1A9UDP glucuronosyltransferase 1 family, polypeptide A9 (204532_x_at), score: 0.87
UROSuroporphyrinogen III synthase (203031_s_at), score: -0.48
USP18ubiquitin specific peptidase 18 (219211_at), score: 0.6
USP25ubiquitin specific peptidase 25 (220419_s_at), score: -0.46
UXS1UDP-glucuronate decarboxylase 1 (219675_s_at), score: -0.49
WDR91WD repeat domain 91 (218971_s_at), score: 0.62
ZNF281zinc finger protein 281 (218401_s_at), score: -0.5
Non-Entrez genes
Unknown, score:
HELP
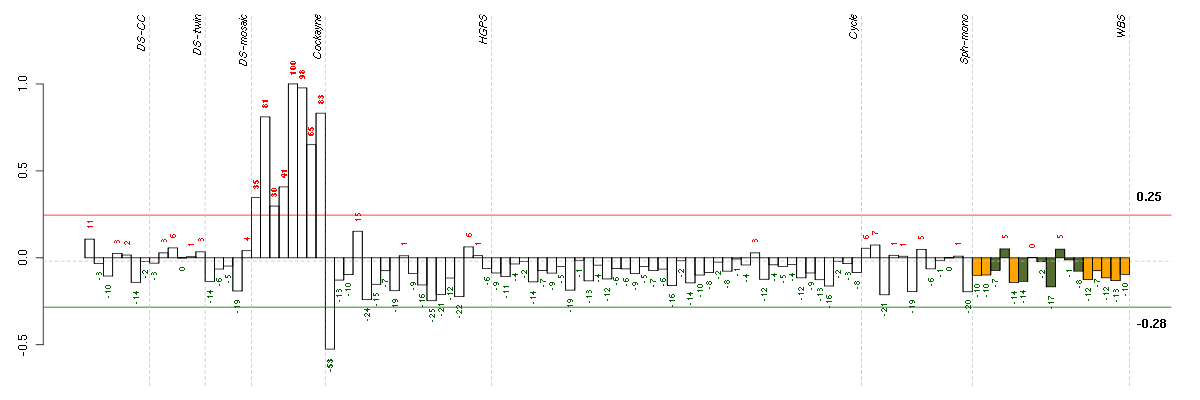
Conditions in the module, given in the same order as on the expression
plot above. Red color means over-expression, green under-expression in
the given condition.
The barplot below shows the condition (sample) scores. A separate bar
is shown for each sample, its height is the corresponding score of the
sample in the module. The red and green numbers on the bars are the
sample scores expressed in percents, i.e. 100% is 1.0.
The red and green lines show the module thresholds, samples above
the red line and below the green line are included in the module.
The different experiments that were part of the study, are separated
by dashed vertical lines.
— Click on the Help button again to close this help window.
| Id | sample | Experiment | ExpName | Array | Syndrome | Cell.line |
| E-GEOD-3860-raw-cel-1561690199.cel | 1 | 5 | HGPS | hgu133a | none | GM0316B |
| E-GEOD-3407-raw-cel-1437949655.cel | 3 | 4 | Cockayne | hgu133a | none | CSB |
| E-GEOD-3407-raw-cel-1437949557.cel | 1 | 4 | Cockayne | hgu133a | CS | eGFP |
| E-GEOD-3407-raw-cel-1437949704.cel | 4 | 4 | Cockayne | hgu133a | CS | eGFP |
| E-GEOD-3407-raw-cel-1437949854.cel | 7 | 4 | Cockayne | hgu133a | CS | eGFP |
| E-GEOD-3407-raw-cel-1437949579.cel | 2 | 4 | Cockayne | hgu133a | none | CSB |
| E-GEOD-3407-raw-cel-1437949938.cel | 8 | 4 | Cockayne | hgu133a | none | CSB |
| E-GEOD-3407-raw-cel-1437949750.cel | 6 | 4 | Cockayne | hgu133a | CS | CSB |
| E-GEOD-3407-raw-cel-1437949721.cel | 5 | 4 | Cockayne | hgu133a | CS | CSB |


© 2008-2010 Computational Biology Group, Department of Medical Genetics,
University of Lausanne, Switzerland