Previous module |
Next module
Module #788, TG: 2.6, TC: 1, 83 probes, 83 Entrez genes, 27 conditions


HELP
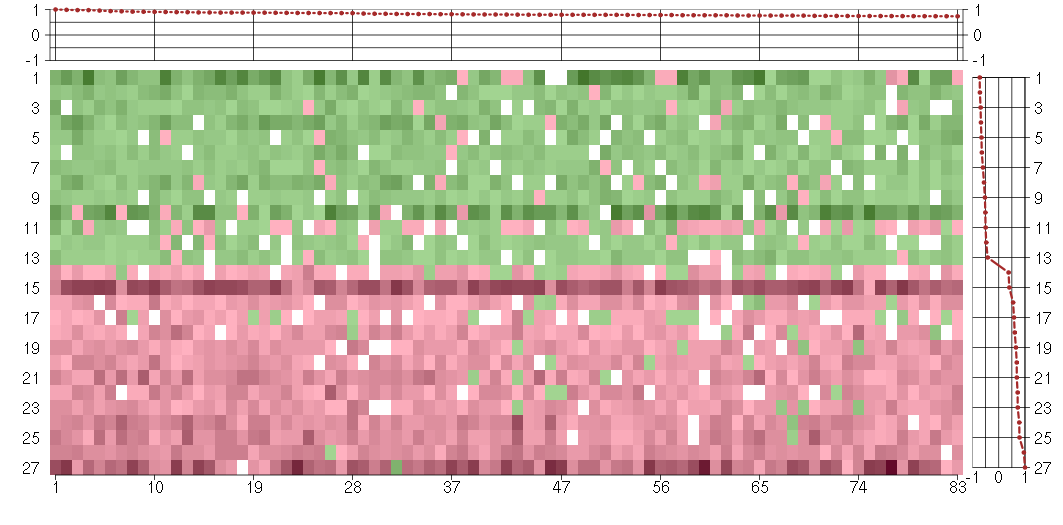
The image plot shows the color-coded level of gene expression, for the
genes and conditions in a given transcription module. The genes are on
the horizontal, the conditions on the vertical axis.
The genes are ordered according to their ISA gene scores, similarly
the conditions are ordered according to their condition scores. The
score of a gene means the «degree of inclusion» in
the module: a high score gene is essential in the module.
Condition scores can also be negative, that means that the genes of
the module are all down-regulated in the condition. Here the absolute
value of the score gives the «degree of inclusion».
The plots above and beside the expression matrix show the gene scores
and condition scores, respectively.
Note that the plot is interactive, you can see the name of the gene
and condition under the mouse cursor.
The expression matrix was normalized to have mean zero and standard
deviation one for every gene separately across all conditions
(i.e. not just for the conditions in the module).
— Click on the Help button again to close this help window.

Under-expression is coded with green,
over-expression with red color.
Help |
Hide |
Top
Help |
Show |
Top
The GO tree — Biological processes
HELP
This is one of three sections showing Gene Ontology enrichment of the
current module: in this case for biological processes.
The graph shows the hierarchy of the GO categories, their enrichment
for the current module is color coded, and the blue number beside the
category is the minus log ten p-value of the enrichment. (Calculated
using the standard hypergeometric test.) The color of the arrows code
«is a» (cyan) and «part of» relationships.
The tree was built the following way. First all GO terms with more
significant enrichment p-value than 0.05 were collected. Then all
paths from these terms to the root node of the GO tree were included
too. If a GO term is included more than once in the tree, then the
green numbers show 1) the id of the node, this makes it easier to find
other appereances of the term, and 2) the number of appearences.
Note that the same GO category might show up on the graph many
times. This is because the GO was «straightened» for this
graph, i.e. if there are more paths from a GO term to the root node of
the tree, all of them are included. The green numbers
Move the mouse cursor over the terms to get their definition. Clicking
on them takes you to the corresponding Gene Ontology web page.
If you cannot see a graph here at all, that means that there were no
significantly enriched GO categories, at the 0.05 level.
— Click on the Help button again to close this help window.

Help |
Hide |
Top
Help |
Show |
Top
The GO tree — Cellular Components
HELP
This is one of three sections showing Gene Ontology enrichment of the
current module: in this case for cellular components.
The graph shows the hierarchy of the GO categories, their enrichment
for the current module is color coded, and the blue number beside the
category is the minus log ten p-value of the enrichment. (Calculated
using the standard hypergeometric test.) The color of the arrows code
«is a» (cyan) and «part of» relationships.
The tree was built the following way. First all GO terms with more
significant enrichment p-value than 0.05 were collected. Then all
paths from these terms to the root node of the GO tree were included
too. If a GO term is included more than once in the tree, then the
green numbers show 1) the id of the node, this makes it easier to find
other appereances of the term, and 2) the number of appearences.
Note that the same GO category might show up on the graph many
times. This is because the GO was «straightened» for this
graph, i.e. if there are more paths from a GO term to the root node of
the tree, all of them are included. The green numbers
Move the mouse cursor over the terms to get their definition. Clicking
on them takes you to the corresponding Gene Ontology web page.
If you cannot see a graph here at all, that means that there were no
significantly enriched GO categories, at the 0.05 level.
— Click on the Help button again to close this help window.
Help |
Hide |
Top
Help |
Show |
Top
The GO tree — Molecular Function
HELP
This is one of three sections showing Gene Ontology enrichment of the
current module: in this case for molecular function.
The graph shows the hierarchy of the GO categories, their enrichment
for the current module is color coded, and the blue number beside the
category is the minus log ten p-value of the enrichment. (Calculated
using the standard hypergeometric test.) The color of the arrows code
«is a» (cyan) and «part of» relationships.
The tree was built the following way. First all GO terms with more
significant enrichment p-value than 0.05 were collected. Then all
paths from these terms to the root node of the GO tree were included
too. If a GO term is included more than once in the tree, then the
green numbers show 1) the id of the node, this makes it easier to find
other appereances of the term, and 2) the number of appearences.
Note that the same GO category might show up on the graph many
times. This is because the GO was «straightened» for this
graph, i.e. if there are more paths from a GO term to the root node of
the tree, all of them are included. The green numbers
Move the mouse cursor over the terms to get their definition. Clicking
on them takes you to the corresponding Gene Ontology web page.
If you cannot see a graph here at all, that means that there were no
significantly enriched GO categories, at the 0.05 level.
— Click on the Help button again to close this help window.
Help |
Hide |
Top
Help |
Show |
Top
GO BP test for over-representation
HELP
List of all enriched GO categories (biological processes), at the 0.05
p-value level.
The columns:
- ExpCount is the expected count of genes in the
module annotated with the given GO term, just by chance.
- Count
is the number of genes in the module annotated with the given GO
term.
- Size is the total number of genes (in our universe)
annotated with the GO term.
Clicking on Count shows the genes that drive the
enrichment. You can also click on the individual numbers in
the Count column, to show the driving genes for that individual
GO category.
Clicking on the GO identifiers takes you to the Gene Ontology web
pages.
— Click on the Help button again to close this help window.
Help |
Hide |
Top
Help |
Show |
Top
GO CC test for over-representation
HELP
List of all enriched GO categories (cellular components), at the 0.05
p-value level.
The columns:
- ExpCount is the expected count of genes in the
module annotated with the given GO term, just by chance.
- Count
is the number of genes in the module annotated with the given GO
term.
- Size is the total number of genes (in our universe)
annotated with the GO term.
Clicking on Count shows the genes that drive the
enrichment. You can also click on the individual numbers in
the Count column, to show the driving genes for that individual
GO category.
Clicking on the GO identifiers takes you to the Gene Ontology web
pages.
— Click on the Help button again to close this help window.
Help |
Hide |
Top
Help |
Show |
Top
GO MF test for over-representation
HELP
List of all enriched GO categories (molecular function), at the 0.05
p-value level.
The columns:
- ExpCount is the expected count of genes in the
module annotated with the given GO term, just by chance.
- Count
is the number of genes in the module annotated with the given GO
term.
- Size is the total number of genes (in our universe)
annotated with the GO term.
Clicking on Count shows the genes that drive the
enrichment. You can also click on the individual numbers in
the Count column, to show the driving genes for that individual
GO category.
Clicking on the GO identifiers takes you to the Gene Ontology web
pages.
— Click on the Help button again to close this help window.
| Id | Pvalue | ExpCount | Count | Size | Term |
| GO:0008517 | 2.225e-02 | 0.02638 | 2
SLC19A2, SLC25A32 | 3 | folic acid transporter activity |
Help |
Hide |
Top
Help |
Show |
Top
KEGG Pathway test for over-representation
HELP
List of all enriched KEGG pathways, at the 0.05
p-value level.
The columns:
- ExpCount is the expected count of genes in the
module annotated with the given KEGG pathway, just by chance.
- Count
is the number of genes in the module annotated with the given KEGG
pathway.
- Size is the total number of genes (in our universe)
annotated with the KEGG pathway.
Clicking on Count shows the genes that drive the
enrichment. You can also click on the individual numbers in
the Count column, to show the driving genes for that individual
KEGG pathway.
Clicking on the KEGG identifiers takes you to the KEGG web site.
— Click on the Help button again to close this help window.
Help |
Hide |
Top
Help |
Show |
Top
miRNA test for over-representation
HELP
List of all enriched miRNA families, at the 0.05
p-value level.
The columns:
- ExpCount is the expected count of genes in the
module regulated by the given miRNA family, just by chance.
- Count
is the number of genes in the module regulated by the given miRNA
family.
- Size is the total number of genes (in our universe)
regulated with the given miRNA family.
Clicking on Count shows the genes that drive the
enrichment. You can also click on the individual numbers in
the Count column, to show the driving genes for that individual
miRNA family.
The miRNA regulation data was taken from the TargetScan database.
(Only the conserved sites were used for the current analysis.)
Clicking on the miRNA names takes you to the TargetScan web site.
— Click on the Help button again to close this help window.
| Id | Pvalue | ExpCount | Count | Size |
| miR-17-5p/20/93.mr/106/519.d | 4.930e-02 | 8.361 | 22
ACAP2, ACSL4, ANKH, ANKRD12, ARID4B, BMP2, BNIP2, CASP7, CCNJ, DNAJB9, GCC2, IL1RAP, KIAA0247, KIAA1128, LPGAT1, MYNN, RAPGEF2, RB1CC1, RNF38, SS18L1, TRAPPC10, VPS13C | 639 |
Help |
Hide |
Top
Help |
Show |
Top
Chromosome test for over-representation
HELP
List of all enriched Chromosomes, at the 0.05
p-value level.
The columns:
- ExpCount is the expected number of genes in the
module on the given chromosome, just by chance.
- Count
is the number of genes in the module on the given chromosome.
- Size is the total number of genes (in our universe)
on the given chromosome.
Clicking on Count shows the genes that drive the
enrichment. You can also click on the individual numbers in
the Count column, to show the driving genes for that individual
chromosome.
— Click on the Help button again to close this help window.
HELP
A list of all genes in the current module, in alphabetical order. The
size of the text corresponds to the gene scores.
Note that some gene symbols may show up more than once, if many
probes match the same Entrez gene.
Genes with no Entrez mapping are given separately, with their
Affymetrics probe ID.
— Click on the Help button again to close this help window.
Entrez genes
ABCE1ATP-binding cassette, sub-family E (OABP), member 1 (201873_s_at), score: 0.79
ACAP2ArfGAP with coiled-coil, ankyrin repeat and PH domains 2 (212476_at), score: 0.79
ACSL4acyl-CoA synthetase long-chain family member 4 (202422_s_at), score: 0.86
ANKHankylosis, progressive homolog (mouse) (220076_at), score: 0.9
ANKRD10ankyrin repeat domain 10 (218093_s_at), score: 0.86
ANKRD12ankyrin repeat domain 12 (216550_x_at), score: 0.79
ARID4BAT rich interactive domain 4B (RBP1-like) (221230_s_at), score: 0.74
BACH1BTB and CNC homology 1, basic leucine zipper transcription factor 1 (204194_at), score: 0.82
BMP2bone morphogenetic protein 2 (205289_at), score: 0.8
BNIP2BCL2/adenovirus E1B 19kDa interacting protein 2 (209308_s_at), score: 0.87
BTAF1BTAF1 RNA polymerase II, B-TFIID transcription factor-associated, 170kDa (Mot1 homolog, S. cerevisiae) (209430_at), score: 0.99
C10orf88chromosome 10 open reading frame 88 (219240_s_at), score: 0.81
C14orf138chromosome 14 open reading frame 138 (218940_at), score: 0.88
CAPZA2capping protein (actin filament) muscle Z-line, alpha 2 (201237_at), score: 0.77
CASP7caspase 7, apoptosis-related cysteine peptidase (207181_s_at), score: 0.74
CCDC47coiled-coil domain containing 47 (217814_at), score: 0.74
CCNJcyclin J (219470_x_at), score: 0.75
CCNT2cyclin T2 (204645_at), score: 0.79
CCT6Bchaperonin containing TCP1, subunit 6B (zeta 2) (206587_at), score: 0.74
CHD1chromodomain helicase DNA binding protein 1 (204258_at), score: 0.76
COQ10Bcoenzyme Q10 homolog B (S. cerevisiae) (219397_at), score: 0.78
CSGALNACT2chondroitin sulfate N-acetylgalactosaminyltransferase 2 (222235_s_at), score: 0.98
DNAJB9DnaJ (Hsp40) homolog, subfamily B, member 9 (202843_at), score: 0.91
EDNRAendothelin receptor type A (204464_s_at), score: 0.74
EVI5ecotropic viral integration site 5 (209717_at), score: 0.87
FAM18Bfamily with sequence similarity 18, member B (218446_s_at), score: 0.8
FUBP1far upstream element (FUSE) binding protein 1 (212847_at), score: 0.77
FUBP3far upstream element (FUSE) binding protein 3 (212824_at), score: 0.79
GCC2GRIP and coiled-coil domain containing 2 (202832_at), score: 0.9
HS2ST1heparan sulfate 2-O-sulfotransferase 1 (203285_s_at), score: 0.74
IL1RAPinterleukin 1 receptor accessory protein (205227_at), score: 0.78
ITSN2intersectin 2 (209898_x_at), score: 0.79
JARID2jumonji, AT rich interactive domain 2 (203297_s_at), score: 0.79
JHDM1Djumonji C domain containing histone demethylase 1 homolog D (S. cerevisiae) (221778_at), score: 0.93
JMJD1Cjumonji domain containing 1C (221763_at), score: 0.88
KIAA0247KIAA0247 (202181_at), score: 0.81
KIAA0562KIAA0562 (204075_s_at), score: 0.94
KIAA1128KIAA1128 (209379_s_at), score: 0.76
LARP4La ribonucleoprotein domain family, member 4 (214155_s_at), score: 0.78
LEMD3LEM domain containing 3 (218604_at), score: 0.74
LOC644617hypothetical LOC644617 (221235_s_at), score: 0.74
LOC65998hypothetical protein LOC65998 (218641_at), score: 0.75
LPGAT1lysophosphatidylglycerol acyltransferase 1 (202651_at), score: 0.74
MEX3Cmex-3 homolog C (C. elegans) (218247_s_at), score: 0.82
MORC3MORC family CW-type zinc finger 3 (213000_at), score: 0.8
MYNNmyoneurin (218926_at), score: 0.88
NAMPTnicotinamide phosphoribosyltransferase (217738_at), score: 0.76
NARG1LNMDA receptor regulated 1-like (219378_at), score: 0.76
NUMBnumb homolog (Drosophila) (207545_s_at), score: 0.78
NUPL1nucleoporin like 1 (204435_at), score: 0.88
PCTK2PCTAIRE protein kinase 2 (221918_at), score: 0.83
PELI1pellino homolog 1 (Drosophila) (218319_at), score: 0.86
RAPGEF2Rap guanine nucleotide exchange factor (GEF) 2 (203097_s_at), score: 1
RB1CC1RB1-inducible coiled-coil 1 (202034_x_at), score: 0.84
RBM39RNA binding motif protein 39 (207941_s_at), score: 0.77
RIPK2receptor-interacting serine-threonine kinase 2 (209544_at), score: 0.8
RNF11ring finger protein 11 (208924_at), score: 0.73
RNF38ring finger protein 38 (218528_s_at), score: 0.79
SLC19A2solute carrier family 19 (thiamine transporter), member 2 (209681_at), score: 0.96
SLC25A32solute carrier family 25, member 32 (221020_s_at), score: 0.75
SLC2A3P1solute carrier family 2 (facilitated glucose transporter), member 3 pseudogene 1 (221751_at), score: 0.88
SLC39A14solute carrier family 39 (zinc transporter), member 14 (212110_at), score: 0.83
SLKSTE20-like kinase (yeast) (206875_s_at), score: 0.86
SOS2son of sevenless homolog 2 (Drosophila) (212870_at), score: 0.76
SS18L1synovial sarcoma translocation gene on chromosome 18-like 1 (213140_s_at), score: 0.88
SSFA2sperm specific antigen 2 (202506_at), score: 0.76
STK38Lserine/threonine kinase 38 like (212572_at), score: 0.89
STRN3striatin, calmodulin binding protein 3 (204496_at), score: 0.79
TBCCD1TBCC domain containing 1 (206451_at), score: 0.75
TDGthymine-DNA glycosylase (203743_s_at), score: 0.77
TICAM2toll-like receptor adaptor molecule 2 (214658_at), score: 0.79
TRAPPC10trafficking protein particle complex 10 (209412_at), score: 0.86
UBE2D1ubiquitin-conjugating enzyme E2D 1 (UBC4/5 homolog, yeast) (211764_s_at), score: 0.81
UFM1ubiquitin-fold modifier 1 (218050_at), score: 0.97
USP12ubiquitin specific peptidase 12 (213327_s_at), score: 0.88
VPS13Cvacuolar protein sorting 13 homolog C (S. cerevisiae) (218396_at), score: 0.86
WRNWerner syndrome (205667_at), score: 0.77
ZCCHC10zinc finger, CCHC domain containing 10 (221193_s_at), score: 0.82
ZCCHC2zinc finger, CCHC domain containing 2 (219062_s_at), score: 0.91
ZDHHC17zinc finger, DHHC-type containing 17 (212982_at), score: 0.83
ZNF267zinc finger protein 267 (219540_at), score: 0.82
ZNF432zinc finger protein 432 (219848_s_at), score: 0.77
ZNF468zinc finger protein 468 (214751_at), score: 0.92
Non-Entrez genes
Unknown, score:
HELP
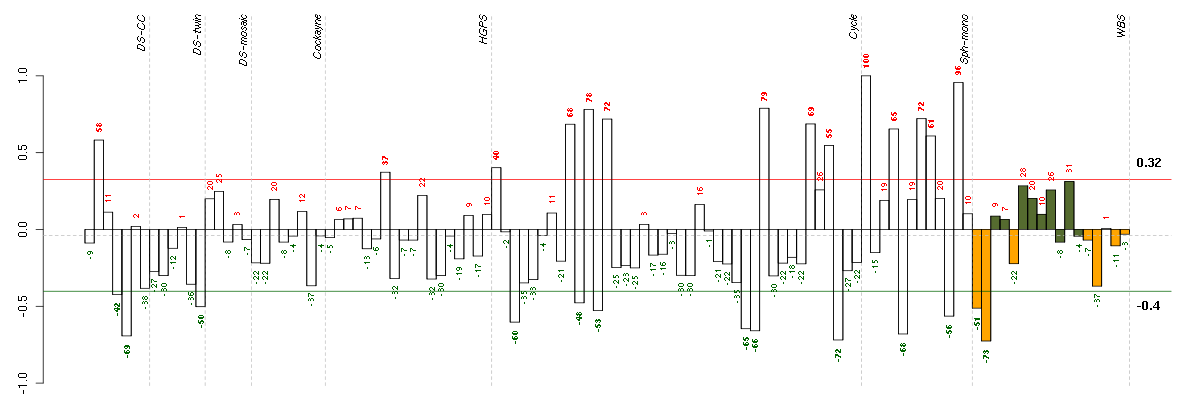
Conditions in the module, given in the same order as on the expression
plot above. Red color means over-expression, green under-expression in
the given condition.
The barplot below shows the condition (sample) scores. A separate bar
is shown for each sample, its height is the corresponding score of the
sample in the module. The red and green numbers on the bars are the
sample scores expressed in percents, i.e. 100% is 1.0.
The red and green lines show the module thresholds, samples above
the red line and below the green line are included in the module.
The different experiments that were part of the study, are separated
by dashed vertical lines.
— Click on the Help button again to close this help window.
| Id | sample | Experiment | ExpName | Array | Syndrome | Cell.line |
| 10590_WBS.CEL | 2 | 8 | WBS | hgu133plus2 | WBS | WBS 1 |
| E-TABM-263-raw-cel-1515486391.cel | 38 | 6 | Cycle | hgu133a2 | none | Cycle 1 |
| t21b 08-03.CEL | 5 | 1 | DS-CC | hgu133a | Down | DS-CC 5 |
| E-GEOD-4219-raw-cel-1311956321.cel | 9 | 7 | Sph-mono | hgu133plus2 | none | Sph-mon 1 |
| E-TABM-263-raw-cel-1515486211.cel | 29 | 6 | Cycle | hgu133a2 | none | Cycle 1 |
| E-TABM-263-raw-cel-1515486191.cel | 28 | 6 | Cycle | hgu133a2 | none | Cycle 1 |
| E-TABM-263-raw-cel-1515485691.cel | 3 | 6 | Cycle | hgu133a2 | none | Cycle 1 |
| E-GEOD-4219-raw-cel-1311956614.cel | 18 | 7 | Sph-mono | hgu133plus2 | none | Sph-mon 1 |
| E-TABM-263-raw-cel-1515485871.cel | 12 | 6 | Cycle | hgu133a2 | none | Cycle 1 |
| 10358_WBS.CEL | 1 | 8 | WBS | hgu133plus2 | WBS | WBS 1 |
| 6Twin.CEL | 6 | 2 | DS-twin | hgu133plus2 | none | DS-twin 6 |
| E-TABM-263-raw-cel-1515485831.cel | 10 | 6 | Cycle | hgu133a2 | none | Cycle 1 |
| t21a 08-03.CEL | 4 | 1 | DS-CC | hgu133a | Down | DS-CC 4 |
| E-GEOD-3860-raw-cel-1561690272.cel | 7 | 5 | HGPS | hgu133a | HGPS | AG11498 |
| E-TABM-263-raw-cel-1515485651.cel | 1 | 6 | Cycle | hgu133a2 | none | Cycle 1 |
| E-TABM-263-raw-cel-1515486371.cel | 37 | 6 | Cycle | hgu133a2 | none | Cycle 1 |
| ctrl b 08-03.CEL | 2 | 1 | DS-CC | hgu133a | none | DS-CC 2 |
| E-GEOD-4219-raw-cel-1311956418.cel | 13 | 7 | Sph-mono | hgu133plus2 | none | Sph-mon 1 |
| E-GEOD-4219-raw-cel-1311956275.cel | 8 | 7 | Sph-mono | hgu133plus2 | none | Sph-mon 1 |
| E-TABM-263-raw-cel-1515485811.cel | 9 | 6 | Cycle | hgu133a2 | none | Cycle 1 |
| E-TABM-263-raw-cel-1515486331.cel | 35 | 6 | Cycle | hgu133a2 | none | Cycle 1 |
| E-TABM-263-raw-cel-1515485891.cel | 13 | 6 | Cycle | hgu133a2 | none | Cycle 1 |
| E-GEOD-4219-raw-cel-1311956398.cel | 12 | 7 | Sph-mono | hgu133plus2 | none | Sph-mon 1 |
| E-TABM-263-raw-cel-1515485851.cel | 11 | 6 | Cycle | hgu133a2 | none | Cycle 1 |
| E-TABM-263-raw-cel-1515486231.cel | 30 | 6 | Cycle | hgu133a2 | none | Cycle 1 |
| E-GEOD-4219-raw-cel-1311956634.cel | 19 | 7 | Sph-mono | hgu133plus2 | none | Sph-mon 1 |
| E-GEOD-4219-raw-cel-1311956083.cel | 2 | 7 | Sph-mono | hgu133plus2 | none | Sph-mon 1 |


© 2008-2010 Computational Biology Group, Department of Medical Genetics,
University of Lausanne, Switzerland