Previous module |
Next module
Module #795, TG: 2.4, TC: 2, 134 probes, 134 Entrez genes, 3 conditions


HELP
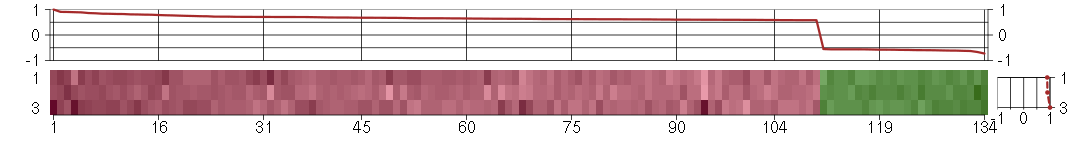
The image plot shows the color-coded level of gene expression, for the
genes and conditions in a given transcription module. The genes are on
the horizontal, the conditions on the vertical axis.
The genes are ordered according to their ISA gene scores, similarly
the conditions are ordered according to their condition scores. The
score of a gene means the «degree of inclusion» in
the module: a high score gene is essential in the module.
Condition scores can also be negative, that means that the genes of
the module are all down-regulated in the condition. Here the absolute
value of the score gives the «degree of inclusion».
The plots above and beside the expression matrix show the gene scores
and condition scores, respectively.
Note that the plot is interactive, you can see the name of the gene
and condition under the mouse cursor.
The expression matrix was normalized to have mean zero and standard
deviation one for every gene separately across all conditions
(i.e. not just for the conditions in the module).
— Click on the Help button again to close this help window.

Under-expression is coded with green,
over-expression with red color.
Help |
Hide |
Top
Help |
Show |
Top
The GO tree — Biological processes
HELP
This is one of three sections showing Gene Ontology enrichment of the
current module: in this case for biological processes.
The graph shows the hierarchy of the GO categories, their enrichment
for the current module is color coded, and the blue number beside the
category is the minus log ten p-value of the enrichment. (Calculated
using the standard hypergeometric test.) The color of the arrows code
«is a» (cyan) and «part of» relationships.
The tree was built the following way. First all GO terms with more
significant enrichment p-value than 0.05 were collected. Then all
paths from these terms to the root node of the GO tree were included
too. If a GO term is included more than once in the tree, then the
green numbers show 1) the id of the node, this makes it easier to find
other appereances of the term, and 2) the number of appearences.
Note that the same GO category might show up on the graph many
times. This is because the GO was «straightened» for this
graph, i.e. if there are more paths from a GO term to the root node of
the tree, all of them are included. The green numbers
Move the mouse cursor over the terms to get their definition. Clicking
on them takes you to the corresponding Gene Ontology web page.
If you cannot see a graph here at all, that means that there were no
significantly enriched GO categories, at the 0.05 level.
— Click on the Help button again to close this help window.

Help |
Hide |
Top
Help |
Show |
Top
The GO tree — Cellular Components
HELP
This is one of three sections showing Gene Ontology enrichment of the
current module: in this case for cellular components.
The graph shows the hierarchy of the GO categories, their enrichment
for the current module is color coded, and the blue number beside the
category is the minus log ten p-value of the enrichment. (Calculated
using the standard hypergeometric test.) The color of the arrows code
«is a» (cyan) and «part of» relationships.
The tree was built the following way. First all GO terms with more
significant enrichment p-value than 0.05 were collected. Then all
paths from these terms to the root node of the GO tree were included
too. If a GO term is included more than once in the tree, then the
green numbers show 1) the id of the node, this makes it easier to find
other appereances of the term, and 2) the number of appearences.
Note that the same GO category might show up on the graph many
times. This is because the GO was «straightened» for this
graph, i.e. if there are more paths from a GO term to the root node of
the tree, all of them are included. The green numbers
Move the mouse cursor over the terms to get their definition. Clicking
on them takes you to the corresponding Gene Ontology web page.
If you cannot see a graph here at all, that means that there were no
significantly enriched GO categories, at the 0.05 level.
— Click on the Help button again to close this help window.
Help |
Hide |
Top
Help |
Show |
Top
The GO tree — Molecular Function
HELP
This is one of three sections showing Gene Ontology enrichment of the
current module: in this case for molecular function.
The graph shows the hierarchy of the GO categories, their enrichment
for the current module is color coded, and the blue number beside the
category is the minus log ten p-value of the enrichment. (Calculated
using the standard hypergeometric test.) The color of the arrows code
«is a» (cyan) and «part of» relationships.
The tree was built the following way. First all GO terms with more
significant enrichment p-value than 0.05 were collected. Then all
paths from these terms to the root node of the GO tree were included
too. If a GO term is included more than once in the tree, then the
green numbers show 1) the id of the node, this makes it easier to find
other appereances of the term, and 2) the number of appearences.
Note that the same GO category might show up on the graph many
times. This is because the GO was «straightened» for this
graph, i.e. if there are more paths from a GO term to the root node of
the tree, all of them are included. The green numbers
Move the mouse cursor over the terms to get their definition. Clicking
on them takes you to the corresponding Gene Ontology web page.
If you cannot see a graph here at all, that means that there were no
significantly enriched GO categories, at the 0.05 level.
— Click on the Help button again to close this help window.
Help |
Hide |
Top
Help |
Show |
Top
GO BP test for over-representation
HELP
List of all enriched GO categories (biological processes), at the 0.05
p-value level.
The columns:
- ExpCount is the expected count of genes in the
module annotated with the given GO term, just by chance.
- Count
is the number of genes in the module annotated with the given GO
term.
- Size is the total number of genes (in our universe)
annotated with the GO term.
Clicking on Count shows the genes that drive the
enrichment. You can also click on the individual numbers in
the Count column, to show the driving genes for that individual
GO category.
Clicking on the GO identifiers takes you to the Gene Ontology web
pages.
— Click on the Help button again to close this help window.
| Id | Pvalue | ExpCount | Count | Size | Term |
| GO:0006814 | 3.498e-02 | 0.6883 | 5
SCN3A, SCN9A, SGK1, SLC20A2, SLC38A4 | 54 | sodium ion transport |
Help |
Hide |
Top
Help |
Show |
Top
GO CC test for over-representation
HELP
List of all enriched GO categories (cellular components), at the 0.05
p-value level.
The columns:
- ExpCount is the expected count of genes in the
module annotated with the given GO term, just by chance.
- Count
is the number of genes in the module annotated with the given GO
term.
- Size is the total number of genes (in our universe)
annotated with the GO term.
Clicking on Count shows the genes that drive the
enrichment. You can also click on the individual numbers in
the Count column, to show the driving genes for that individual
GO category.
Clicking on the GO identifiers takes you to the Gene Ontology web
pages.
— Click on the Help button again to close this help window.
| Id | Pvalue | ExpCount | Count | Size | Term |
| GO:0060053 | 3.158e-02 | 0.05954 | 2
INA, SYNM | 4 | neurofilament cytoskeleton |
Help |
Hide |
Top
Help |
Show |
Top
GO MF test for over-representation
HELP
List of all enriched GO categories (molecular function), at the 0.05
p-value level.
The columns:
- ExpCount is the expected count of genes in the
module annotated with the given GO term, just by chance.
- Count
is the number of genes in the module annotated with the given GO
term.
- Size is the total number of genes (in our universe)
annotated with the GO term.
Clicking on Count shows the genes that drive the
enrichment. You can also click on the individual numbers in
the Count column, to show the driving genes for that individual
GO category.
Clicking on the GO identifiers takes you to the Gene Ontology web
pages.
— Click on the Help button again to close this help window.
Help |
Hide |
Top
Help |
Show |
Top
KEGG Pathway test for over-representation
HELP
List of all enriched KEGG pathways, at the 0.05
p-value level.
The columns:
- ExpCount is the expected count of genes in the
module annotated with the given KEGG pathway, just by chance.
- Count
is the number of genes in the module annotated with the given KEGG
pathway.
- Size is the total number of genes (in our universe)
annotated with the KEGG pathway.
Clicking on Count shows the genes that drive the
enrichment. You can also click on the individual numbers in
the Count column, to show the driving genes for that individual
KEGG pathway.
Clicking on the KEGG identifiers takes you to the KEGG web site.
— Click on the Help button again to close this help window.
Help |
Hide |
Top
Help |
Show |
Top
miRNA test for over-representation
HELP
List of all enriched miRNA families, at the 0.05
p-value level.
The columns:
- ExpCount is the expected count of genes in the
module regulated by the given miRNA family, just by chance.
- Count
is the number of genes in the module regulated by the given miRNA
family.
- Size is the total number of genes (in our universe)
regulated with the given miRNA family.
Clicking on Count shows the genes that drive the
enrichment. You can also click on the individual numbers in
the Count column, to show the driving genes for that individual
miRNA family.
The miRNA regulation data was taken from the TargetScan database.
(Only the conserved sites were used for the current analysis.)
Clicking on the miRNA names takes you to the TargetScan web site.
— Click on the Help button again to close this help window.
Help |
Hide |
Top
Help |
Show |
Top
Chromosome test for over-representation
HELP
List of all enriched Chromosomes, at the 0.05
p-value level.
The columns:
- ExpCount is the expected number of genes in the
module on the given chromosome, just by chance.
- Count
is the number of genes in the module on the given chromosome.
- Size is the total number of genes (in our universe)
on the given chromosome.
Clicking on Count shows the genes that drive the
enrichment. You can also click on the individual numbers in
the Count column, to show the driving genes for that individual
chromosome.
— Click on the Help button again to close this help window.
HELP
A list of all genes in the current module, in alphabetical order. The
size of the text corresponds to the gene scores.
Note that some gene symbols may show up more than once, if many
probes match the same Entrez gene.
Genes with no Entrez mapping are given separately, with their
Affymetrics probe ID.
— Click on the Help button again to close this help window.
Entrez genes
ABAT4-aminobutyrate aminotransferase (209459_s_at), score: 0.62
ABLIM1actin binding LIM protein 1 (200965_s_at), score: 0.74
ACTR8ARP8 actin-related protein 8 homolog (yeast) (218658_s_at), score: 0.59
ADAMTS3ADAM metallopeptidase with thrombospondin type 1 motif, 3 (214913_at), score: 0.71
ADIPOR1adiponectin receptor 1 (217748_at), score: -0.6
ALDH1A1aldehyde dehydrogenase 1 family, member A1 (212224_at), score: 0.86
ARL15ADP-ribosylation factor-like 15 (219842_at), score: 0.81
ARSJarylsulfatase family, member J (219973_at), score: 0.6
ASCC3activating signal cointegrator 1 complex subunit 3 (212815_at), score: 0.58
ASPNasporin (219087_at), score: 0.6
C14orf169chromosome 14 open reading frame 169 (219526_at), score: 0.69
C15orf29chromosome 15 open reading frame 29 (218791_s_at), score: 0.67
C20orf111chromosome 20 open reading frame 111 (209020_at), score: -0.57
C2orf37chromosome 2 open reading frame 37 (220172_at), score: 0.64
C6orf211chromosome 6 open reading frame 211 (218195_at), score: 0.61
CAND1cullin-associated and neddylation-dissociated 1 (208839_s_at), score: 0.64
CAND2cullin-associated and neddylation-dissociated 2 (putative) (213547_at), score: 0.72
CD44CD44 molecule (Indian blood group) (210916_s_at), score: -0.59
CELSR3cadherin, EGF LAG seven-pass G-type receptor 3 (flamingo homolog, Drosophila) (40020_at), score: -0.63
CHRDL1chordin-like 1 (209763_at), score: 0.67
CLASP2cytoplasmic linker associated protein 2 (212306_at), score: 0.62
CLEC2BC-type lectin domain family 2, member B (209732_at), score: -0.59
COBLL1COBL-like 1 (203642_s_at), score: 0.8
CPEcarboxypeptidase E (201117_s_at), score: -0.55
CTSScathepsin S (202901_x_at), score: -0.56
DAPK1death-associated protein kinase 1 (203139_at), score: 0.7
DDAH1dimethylarginine dimethylaminohydrolase 1 (209094_at), score: 0.66
DGKDdiacylglycerol kinase, delta 130kDa (208072_s_at), score: -0.61
DNAJC6DnaJ (Hsp40) homolog, subfamily C, member 6 (204720_s_at), score: 0.65
EIF3Deukaryotic translation initiation factor 3, subunit D (200005_at), score: -0.56
ENOSF1enolase superfamily member 1 (204142_at), score: 0.71
FABP3fatty acid binding protein 3, muscle and heart (mammary-derived growth inhibitor) (214285_at), score: 0.6
FAM174Bfamily with sequence similarity 174, member B (51158_at), score: 1
FAM46Cfamily with sequence similarity 46, member C (220306_at), score: 0.89
FAM65Bfamily with sequence similarity 65, member B (209829_at), score: 0.83
FBN2fibrillin 2 (203184_at), score: 0.59
FLT1fms-related tyrosine kinase 1 (vascular endothelial growth factor/vascular permeability factor receptor) (222033_s_at), score: 0.78
FOXL2forkhead box L2 (220102_at), score: -0.58
GAL3ST4galactose-3-O-sulfotransferase 4 (219815_at), score: 0.74
GALNT3UDP-N-acetyl-alpha-D-galactosamine:polypeptide N-acetylgalactosaminyltransferase 3 (GalNAc-T3) (203397_s_at), score: 0.85
GFRA1GDNF family receptor alpha 1 (205696_s_at), score: 0.83
GIPC2GIPC PDZ domain containing family, member 2 (219970_at), score: 0.67
GLT25D2glycosyltransferase 25 domain containing 2 (209883_at), score: 0.61
GPR126G protein-coupled receptor 126 (213094_at), score: 0.77
GREM1gremlin 1, cysteine knot superfamily, homolog (Xenopus laevis) (218469_at), score: 0.82
HLA-Bmajor histocompatibility complex, class I, B (211911_x_at), score: -0.6
HSD17B12hydroxysteroid (17-beta) dehydrogenase 12 (217869_at), score: 0.64
IGSF3immunoglobulin superfamily, member 3 (202421_at), score: -0.56
IL23Ainterleukin 23, alpha subunit p19 (211796_s_at), score: 0.89
INAinternexin neuronal intermediate filament protein, alpha (204465_s_at), score: 0.71
INHBEinhibin, beta E (210587_at), score: 0.6
INPP4Binositol polyphosphate-4-phosphatase, type II, 105kDa (205376_at), score: 0.62
IPWimprinted in Prader-Willi syndrome (non-protein coding) (221974_at), score: 0.6
ISL1ISL LIM homeobox 1 (206104_at), score: 0.72
KCNJ2potassium inwardly-rectifying channel, subfamily J, member 2 (206765_at), score: 0.75
KCNN2potassium intermediate/small conductance calcium-activated channel, subfamily N, member 2 (220116_at), score: 0.71
KIF3Bkinesin family member 3B (203943_at), score: -0.58
KLHL3kelch-like 3 (Drosophila) (221221_s_at), score: 0.63
KYNUkynureninase (L-kynurenine hydrolase) (217388_s_at), score: -0.73
L1CAML1 cell adhesion molecule (204584_at), score: 0.8
LMO7LIM domain 7 (202674_s_at), score: 0.72
LPPR4plasticity related gene 1 (213496_at), score: 0.76
LRRC1leucine rich repeat containing 1 (218816_at), score: 0.73
LRRC16Aleucine rich repeat containing 16A (219573_at), score: 0.68
LUMlumican (201744_s_at), score: 0.66
LXNlatexin (218729_at), score: 0.62
MAMLD1mastermind-like domain containing 1 (205088_at), score: 0.58
MAN1A2mannosidase, alpha, class 1A, member 2 (217921_at), score: 0.59
MANSC1MANSC domain containing 1 (220945_x_at), score: 0.81
ME1malic enzyme 1, NADP(+)-dependent, cytosolic (204058_at), score: 0.68
MKRN2makorin ring finger protein 2 (218071_s_at), score: 0.59
MLF1myeloid leukemia factor 1 (204784_s_at), score: -0.58
MLLT3myeloid/lymphoid or mixed-lineage leukemia (trithorax homolog, Drosophila); translocated to, 3 (204918_s_at), score: 0.77
MRPL52mitochondrial ribosomal protein L52 (221997_s_at), score: 0.62
MRPS18Cmitochondrial ribosomal protein S18C (220103_s_at), score: 0.7
MYO1Bmyosin IB (212364_at), score: 0.66
NAV3neuron navigator 3 (204823_at), score: 0.58
NBEAneurobeachin (221207_s_at), score: 0.69
NESnestin (218678_at), score: 0.71
NLGN1neuroligin 1 (205893_at), score: 0.68
NRN1neuritin 1 (218625_at), score: -0.61
OXTRoxytocin receptor (206825_at), score: 0.58
PBXIP1pre-B-cell leukemia homeobox interacting protein 1 (214176_s_at), score: 0.68
PEX5peroxisomal biogenesis factor 5 (203244_at), score: -0.59
PFDN2prefoldin subunit 2 (218336_at), score: -0.56
PGAP1post-GPI attachment to proteins 1 (213469_at), score: 0.61
PLCB1phospholipase C, beta 1 (phosphoinositide-specific) (213222_at), score: 0.68
PSMD5proteasome (prosome, macropain) 26S subunit, non-ATPase, 5 (203447_at), score: 0.64
PSTPIP2proline-serine-threonine phosphatase interacting protein 2 (219938_s_at), score: 0.69
PTPRDprotein tyrosine phosphatase, receptor type, D (214043_at), score: 0.64
RAD23BRAD23 homolog B (S. cerevisiae) (201222_s_at), score: 0.6
RASL11BRAS-like, family 11, member B (219142_at), score: 0.64
RIPK4receptor-interacting serine-threonine kinase 4 (221215_s_at), score: -0.56
RPRD1Aregulation of nuclear pre-mRNA domain containing 1A (218209_s_at), score: 0.6
RPS4P17ribosomal protein S4X pseudogene 17 (216342_x_at), score: -0.67
RPS4Xribosomal protein S4, X-linked (200933_x_at), score: -0.61
SCN3Asodium channel, voltage-gated, type III, alpha subunit (210432_s_at), score: 0.63
SCN9Asodium channel, voltage-gated, type IX, alpha subunit (206950_at), score: 0.62
SCRIBscribbled homolog (Drosophila) (212556_at), score: 0.66
SERPINB7serpin peptidase inhibitor, clade B (ovalbumin), member 7 (206421_s_at), score: 0.66
SERPINB9serpin peptidase inhibitor, clade B (ovalbumin), member 9 (209723_at), score: 0.82
SGK1serum/glucocorticoid regulated kinase 1 (201739_at), score: 0.61
SLC20A2solute carrier family 20 (phosphate transporter), member 2 (202744_at), score: 0.62
SLC24A1solute carrier family 24 (sodium/potassium/calcium exchanger), member 1 (206081_at), score: 0.61
SLC35F5solute carrier family 35, member F5 (220123_at), score: 0.64
SLC38A4solute carrier family 38, member 4 (220786_s_at), score: 0.91
SLC3A1solute carrier family 3 (cystine, dibasic and neutral amino acid transporters, activator of cystine, dibasic and neutral amino acid transport), member 1 (205799_s_at), score: 0.71
SLC48A1solute carrier family 48 (heme transporter), member 1 (218417_s_at), score: 0.58
SMA5glucuronidase, beta pseudogene (215043_s_at), score: -0.58
SPCS3signal peptidase complex subunit 3 homolog (S. cerevisiae) (218817_at), score: 0.6
ST6GAL1ST6 beta-galactosamide alpha-2,6-sialyltranferase 1 (201998_at), score: 0.6
STAM2signal transducing adaptor molecule (SH3 domain and ITAM motif) 2 (209649_at), score: 0.58
STAU2staufen, RNA binding protein, homolog 2 (Drosophila) (204226_at), score: 0.61
STX7syntaxin 7 (212631_at), score: 0.62
SULF1sulfatase 1 (212353_at), score: 0.6
SYNGR1synaptogyrin 1 (210613_s_at), score: 0.71
SYNMsynemin, intermediate filament protein (212730_at), score: 0.7
SYT11synaptotagmin XI (209198_s_at), score: 0.69
TBC1D2BTBC1 domain family, member 2B (212796_s_at), score: 0.59
TBXA2Rthromboxane A2 receptor (336_at), score: 0.9
TEStestis derived transcript (3 LIM domains) (202720_at), score: 0.62
THAP1THAP domain containing, apoptosis associated protein 1 (219292_at), score: 0.62
THBS2thrombospondin 2 (203083_at), score: 0.62
TMEM111transmembrane protein 111 (217882_at), score: -0.62
TMEM168transmembrane protein 168 (218962_s_at), score: 0.65
TMEM2transmembrane protein 2 (218113_at), score: 0.71
TOXthymocyte selection-associated high mobility group box (204529_s_at), score: 0.65
TRHDEthyrotropin-releasing hormone degrading enzyme (219937_at), score: 0.62
TRNAG6transfer RNA glycine 6 (anticodon GCC) (217542_at), score: 0.63
TSKUtsukushin (218245_at), score: -0.56
TSPYL5TSPY-like 5 (213122_at), score: 0.61
VGLL3vestigial like 3 (Drosophila) (220327_at), score: 0.7
ZNF215zinc finger protein 215 (220214_at), score: 0.71
ZNF518Azinc finger protein 518A (204291_at), score: 0.65
Non-Entrez genes
Unknown, score:
HELP
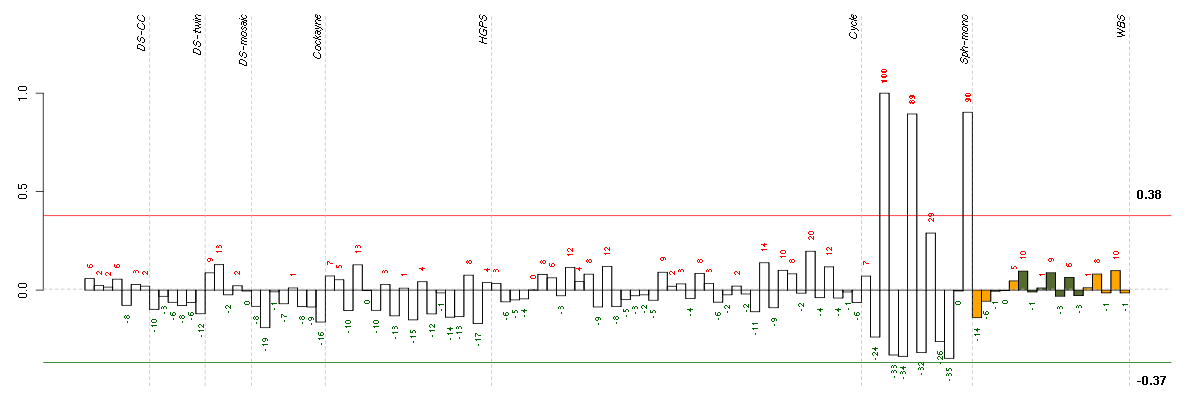
Conditions in the module, given in the same order as on the expression
plot above. Red color means over-expression, green under-expression in
the given condition.
The barplot below shows the condition (sample) scores. A separate bar
is shown for each sample, its height is the corresponding score of the
sample in the module. The red and green numbers on the bars are the
sample scores expressed in percents, i.e. 100% is 1.0.
The red and green lines show the module thresholds, samples above
the red line and below the green line are included in the module.
The different experiments that were part of the study, are separated
by dashed vertical lines.
— Click on the Help button again to close this help window.
| Id | sample | Experiment | ExpName | Array | Syndrome | Cell.line |
| E-GEOD-4219-raw-cel-1311956358.cel | 10 | 7 | Sph-mono | hgu133plus2 | none | Sph-mon 1 |
| E-GEOD-4219-raw-cel-1311956824.cel | 24 | 7 | Sph-mono | hgu133plus2 | none | Sph-mon 1 |
| E-GEOD-4219-raw-cel-1311956178.cel | 6 | 7 | Sph-mono | hgu133plus2 | none | Sph-mon 1 |


© 2008-2010 Computational Biology Group, Department of Medical Genetics,
University of Lausanne, Switzerland