Previous module |
Next module
Module #15, TG: 3, TC: 1.8, 133 probes, 133 Entrez genes, 10 conditions


HELP
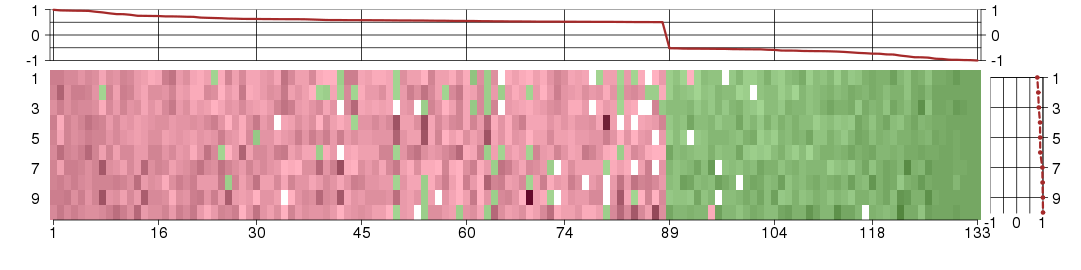
The image plot shows the color-coded level of gene expression, for the
genes and conditions in a given transcription module. The genes are on
the horizontal, the conditions on the vertical axis.
The genes are ordered according to their ISA gene scores, similarly
the conditions are ordered according to their condition scores. The
score of a gene means the «degree of inclusion» in
the module: a high score gene is essential in the module.
Condition scores can also be negative, that means that the genes of
the module are all down-regulated in the condition. Here the absolute
value of the score gives the «degree of inclusion».
The plots above and beside the expression matrix show the gene scores
and condition scores, respectively.
Note that the plot is interactive, you can see the name of the gene
and condition under the mouse cursor.
The expression matrix was normalized to have mean zero and standard
deviation one for every gene separately across all conditions
(i.e. not just for the conditions in the module).
— Click on the Help button again to close this help window.

Under-expression is coded with green,
over-expression with red color.
Help |
Hide |
Top
Help |
Show |
Top
The GO tree — Biological processes
HELP
This is one of three sections showing Gene Ontology enrichment of the
current module: in this case for biological processes.
The graph shows the hierarchy of the GO categories, their enrichment
for the current module is color coded, and the blue number beside the
category is the minus log ten p-value of the enrichment. (Calculated
using the standard hypergeometric test.) The color of the arrows code
«is a» (cyan) and «part of» relationships.
The tree was built the following way. First all GO terms with more
significant enrichment p-value than 0.05 were collected. Then all
paths from these terms to the root node of the GO tree were included
too. If a GO term is included more than once in the tree, then the
green numbers show 1) the id of the node, this makes it easier to find
other appereances of the term, and 2) the number of appearences.
Note that the same GO category might show up on the graph many
times. This is because the GO was «straightened» for this
graph, i.e. if there are more paths from a GO term to the root node of
the tree, all of them are included. The green numbers
Move the mouse cursor over the terms to get their definition. Clicking
on them takes you to the corresponding Gene Ontology web page.
If you cannot see a graph here at all, that means that there were no
significantly enriched GO categories, at the 0.05 level.
— Click on the Help button again to close this help window.
Help |
Hide |
Top
Help |
Show |
Top
The GO tree — Cellular Components
HELP
This is one of three sections showing Gene Ontology enrichment of the
current module: in this case for cellular components.
The graph shows the hierarchy of the GO categories, their enrichment
for the current module is color coded, and the blue number beside the
category is the minus log ten p-value of the enrichment. (Calculated
using the standard hypergeometric test.) The color of the arrows code
«is a» (cyan) and «part of» relationships.
The tree was built the following way. First all GO terms with more
significant enrichment p-value than 0.05 were collected. Then all
paths from these terms to the root node of the GO tree were included
too. If a GO term is included more than once in the tree, then the
green numbers show 1) the id of the node, this makes it easier to find
other appereances of the term, and 2) the number of appearences.
Note that the same GO category might show up on the graph many
times. This is because the GO was «straightened» for this
graph, i.e. if there are more paths from a GO term to the root node of
the tree, all of them are included. The green numbers
Move the mouse cursor over the terms to get their definition. Clicking
on them takes you to the corresponding Gene Ontology web page.
If you cannot see a graph here at all, that means that there were no
significantly enriched GO categories, at the 0.05 level.
— Click on the Help button again to close this help window.
Help |
Hide |
Top
Help |
Show |
Top
The GO tree — Molecular Function
HELP
This is one of three sections showing Gene Ontology enrichment of the
current module: in this case for molecular function.
The graph shows the hierarchy of the GO categories, their enrichment
for the current module is color coded, and the blue number beside the
category is the minus log ten p-value of the enrichment. (Calculated
using the standard hypergeometric test.) The color of the arrows code
«is a» (cyan) and «part of» relationships.
The tree was built the following way. First all GO terms with more
significant enrichment p-value than 0.05 were collected. Then all
paths from these terms to the root node of the GO tree were included
too. If a GO term is included more than once in the tree, then the
green numbers show 1) the id of the node, this makes it easier to find
other appereances of the term, and 2) the number of appearences.
Note that the same GO category might show up on the graph many
times. This is because the GO was «straightened» for this
graph, i.e. if there are more paths from a GO term to the root node of
the tree, all of them are included. The green numbers
Move the mouse cursor over the terms to get their definition. Clicking
on them takes you to the corresponding Gene Ontology web page.
If you cannot see a graph here at all, that means that there were no
significantly enriched GO categories, at the 0.05 level.
— Click on the Help button again to close this help window.
Help |
Hide |
Top
Help |
Show |
Top
GO BP test for over-representation
HELP
List of all enriched GO categories (biological processes), at the 0.05
p-value level.
The columns:
- ExpCount is the expected count of genes in the
module annotated with the given GO term, just by chance.
- Count
is the number of genes in the module annotated with the given GO
term.
- Size is the total number of genes (in our universe)
annotated with the GO term.
Clicking on Count shows the genes that drive the
enrichment. You can also click on the individual numbers in
the Count column, to show the driving genes for that individual
GO category.
Clicking on the GO identifiers takes you to the Gene Ontology web
pages.
— Click on the Help button again to close this help window.
| Id | Pvalue | ExpCount | Count | Size | Term |
| GO:0070647 | 4.753e-02 | 2.841 | 9
BUB1B, CUL1, DDB2, HUWE1, RBX1, TNFAIP1, UBE2V1, USP12, USP9X | 278 | protein modification by small protein conjugation or removal |
Help |
Hide |
Top
Help |
Show |
Top
GO CC test for over-representation
HELP
List of all enriched GO categories (cellular components), at the 0.05
p-value level.
The columns:
- ExpCount is the expected count of genes in the
module annotated with the given GO term, just by chance.
- Count
is the number of genes in the module annotated with the given GO
term.
- Size is the total number of genes (in our universe)
annotated with the GO term.
Clicking on Count shows the genes that drive the
enrichment. You can also click on the individual numbers in
the Count column, to show the driving genes for that individual
GO category.
Clicking on the GO identifiers takes you to the Gene Ontology web
pages.
— Click on the Help button again to close this help window.
| Id | Pvalue | ExpCount | Count | Size | Term |
| GO:0031463 | 4.513e-02 | 0.1023 | 2
RBX1, TNFAIP1 | 10 | Cul3-RING ubiquitin ligase complex |
Help |
Hide |
Top
Help |
Show |
Top
GO MF test for over-representation
HELP
List of all enriched GO categories (molecular function), at the 0.05
p-value level.
The columns:
- ExpCount is the expected count of genes in the
module annotated with the given GO term, just by chance.
- Count
is the number of genes in the module annotated with the given GO
term.
- Size is the total number of genes (in our universe)
annotated with the GO term.
Clicking on Count shows the genes that drive the
enrichment. You can also click on the individual numbers in
the Count column, to show the driving genes for that individual
GO category.
Clicking on the GO identifiers takes you to the Gene Ontology web
pages.
— Click on the Help button again to close this help window.
| Id | Pvalue | ExpCount | Count | Size | Term |
| GO:0019787 | 3.489e-02 | 1.728 | 7
DDB2, FBXW2, HUWE1, RBX1, TNFAIP1, UBE2V1, UBR7 | 163 | small conjugating protein ligase activity |
Help |
Hide |
Top
Help |
Show |
Top
KEGG Pathway test for over-representation
HELP
List of all enriched KEGG pathways, at the 0.05
p-value level.
The columns:
- ExpCount is the expected count of genes in the
module annotated with the given KEGG pathway, just by chance.
- Count
is the number of genes in the module annotated with the given KEGG
pathway.
- Size is the total number of genes (in our universe)
annotated with the KEGG pathway.
Clicking on Count shows the genes that drive the
enrichment. You can also click on the individual numbers in
the Count column, to show the driving genes for that individual
KEGG pathway.
Clicking on the KEGG identifiers takes you to the KEGG web site.
— Click on the Help button again to close this help window.
Help |
Hide |
Top
Help |
Show |
Top
miRNA test for over-representation
HELP
List of all enriched miRNA families, at the 0.05
p-value level.
The columns:
- ExpCount is the expected count of genes in the
module regulated by the given miRNA family, just by chance.
- Count
is the number of genes in the module regulated by the given miRNA
family.
- Size is the total number of genes (in our universe)
regulated with the given miRNA family.
Clicking on Count shows the genes that drive the
enrichment. You can also click on the individual numbers in
the Count column, to show the driving genes for that individual
miRNA family.
The miRNA regulation data was taken from the TargetScan database.
(Only the conserved sites were used for the current analysis.)
Clicking on the miRNA names takes you to the TargetScan web site.
— Click on the Help button again to close this help window.
Help |
Hide |
Top
Help |
Show |
Top
Chromosome test for over-representation
HELP
List of all enriched Chromosomes, at the 0.05
p-value level.
The columns:
- ExpCount is the expected number of genes in the
module on the given chromosome, just by chance.
- Count
is the number of genes in the module on the given chromosome.
- Size is the total number of genes (in our universe)
on the given chromosome.
Clicking on Count shows the genes that drive the
enrichment. You can also click on the individual numbers in
the Count column, to show the driving genes for that individual
chromosome.
— Click on the Help button again to close this help window.
HELP
A list of all genes in the current module, in alphabetical order. The
size of the text corresponds to the gene scores.
Text color indicates correlation and anti-correlation: genes of the
same color are correlated, both move up or down in the module samples
(listed below). Genes of different color are anti-correlated, they
have opposite behavior in the module samples.
Note, that text color of the individual genes should be interpreted
together with the coloring of the samples below. For
red samples,
red genes have a higher expression
(compared to the average gene expression level),
green genes have a lower
expression.
Green samples have opposite
behavior, in these red genes have a
lower expression, green genes
have a higher expression.
Note that some gene symbols may show up more than once, if many
probes match the same Entrez gene.
Genes with no Entrez mapping are given separately, with their
Affymetrics probe ID.
— Click on the Help button again to close this help window.
Entrez genes
ABCC1ATP-binding cassette, sub-family C (CFTR/MRP), member 1 (ENSG00000103222), score: 0.51
ACTR8ARP8 actin-related protein 8 homolog (yeast) (ENSG00000113812), score: -0.59
ADH7alcohol dehydrogenase 7 (class IV), mu or sigma polypeptide (ENSG00000196344), score: 0.89
AHCTF1AT hook containing transcription factor 1 (ENSG00000153207), score: -0.61
AHSA2AHA1, activator of heat shock 90kDa protein ATPase homolog 2 (yeast) (ENSG00000173209), score: -0.63
AMMECR1LAMME chromosomal region gene 1-like (ENSG00000144233), score: 0.51
ANKRD54ankyrin repeat domain 54 (ENSG00000100124), score: -0.76
ANP32Bacidic (leucine-rich) nuclear phosphoprotein 32 family, member B (ENSG00000136938), score: -0.97
APTXaprataxin (ENSG00000137074), score: 0.67
ARCN1archain 1 (ENSG00000095139), score: -0.52
BEST1bestrophin 1 (ENSG00000167995), score: 0.53
BTN3A1butyrophilin, subfamily 3, member A1 (ENSG00000026950), score: 0.52
BUB1Bbudding uninhibited by benzimidazoles 1 homolog beta (yeast) (ENSG00000156970), score: 0.56
C14orf143chromosome 14 open reading frame 143 (ENSG00000140025), score: -0.55
C17orf90chromosome 17 open reading frame 90 (ENSG00000204237), score: 0.51
C1QTNF5C1q and tumor necrosis factor related protein 5 (ENSG00000235718), score: 0.58
C21orf7chromosome 21 open reading frame 7 (ENSG00000156265), score: 0.56
C8orf45chromosome 8 open reading frame 45 (ENSG00000178460), score: 0.95
CACNA2D4calcium channel, voltage-dependent, alpha 2/delta subunit 4 (ENSG00000151062), score: 0.91
CARD6caspase recruitment domain family, member 6 (ENSG00000132357), score: 0.58
CCDC107coiled-coil domain containing 107 (ENSG00000159884), score: -0.99
CCDC137coiled-coil domain containing 137 (ENSG00000185298), score: 0.62
CCDC51coiled-coil domain containing 51 (ENSG00000164051), score: 0.52
CD3EAPCD3e molecule, epsilon associated protein (ENSG00000117877), score: 0.52
CHIT1chitinase 1 (chitotriosidase) (ENSG00000133063), score: 0.59
CLDN6claudin 6 (ENSG00000184697), score: 0.96
CNPY4canopy 4 homolog (zebrafish) (ENSG00000166997), score: 0.55
COL8A1collagen, type VIII, alpha 1 (ENSG00000144810), score: 0.58
CPSF4Lcleavage and polyadenylation specific factor 4-like (ENSG00000187959), score: 0.85
CUL1cullin 1 (ENSG00000055130), score: -0.98
CWF19L1CWF19-like 1, cell cycle control (S. pombe) (ENSG00000095485), score: -0.54
CXCL13chemokine (C-X-C motif) ligand 13 (ENSG00000156234), score: 0.57
CYP2W1cytochrome P450, family 2, subfamily W, polypeptide 1 (ENSG00000073067), score: 0.53
DCTdopachrome tautomerase (dopachrome delta-isomerase, tyrosine-related protein 2) (ENSG00000080166), score: 0.73
DDB2damage-specific DNA binding protein 2, 48kDa (ENSG00000134574), score: 0.68
DDX55DEAD (Asp-Glu-Ala-Asp) box polypeptide 55 (ENSG00000111364), score: 0.57
DNTTdeoxynucleotidyltransferase, terminal (ENSG00000107447), score: 0.51
DVL3dishevelled, dsh homolog 3 (Drosophila) (ENSG00000161202), score: 0.62
EMILIN3elastin microfibril interfacer 3 (ENSG00000183798), score: 0.59
EPT1ethanolaminephosphotransferase 1 (CDP-ethanolamine-specific) (ENSG00000138018), score: -0.61
ERCC1excision repair cross-complementing rodent repair deficiency, complementation group 1 (includes overlapping antisense sequence) (ENSG00000012061), score: 0.75
FAM122Cfamily with sequence similarity 122C (ENSG00000156500), score: 0.58
FAM193Bfamily with sequence similarity 193, member B (ENSG00000146067), score: 0.52
FAM59Bfamily with sequence similarity 59, member B (ENSG00000157833), score: 0.64
FBXW2F-box and WD repeat domain containing 2 (ENSG00000119402), score: -0.56
FLGfilaggrin (ENSG00000143631), score: 0.52
FOXH1forkhead box H1 (ENSG00000160973), score: 0.54
GCET2germinal center expressed transcript 2 (ENSG00000174500), score: 0.54
GPR19G protein-coupled receptor 19 (ENSG00000183150), score: 0.62
GUF1GUF1 GTPase homolog (S. cerevisiae) (ENSG00000151806), score: 0.5
GZMHgranzyme H (cathepsin G-like 2, protein h-CCPX) (ENSG00000100450), score: 0.54
HHLA1HERV-H LTR-associating 1 (ENSG00000132297), score: 0.51
HKDC1hexokinase domain containing 1 (ENSG00000156510), score: 0.82
HSD17B4hydroxysteroid (17-beta) dehydrogenase 4 (ENSG00000133835), score: -0.93
HUWE1HECT, UBA and WWE domain containing 1 (ENSG00000086758), score: -0.84
HYIhydroxypyruvate isomerase (putative) (ENSG00000178922), score: 0.52
IFI44Linterferon-induced protein 44-like (ENSG00000137959), score: 0.51
IL17RAinterleukin 17 receptor A (ENSG00000177663), score: 0.52
IP6K3inositol hexakisphosphate kinase 3 (ENSG00000161896), score: 0.72
ITGA11integrin, alpha 11 (ENSG00000137809), score: 0.79
KCNK7potassium channel, subfamily K, member 7 (ENSG00000173338), score: 0.62
KIAA0467KIAA0467 (ENSG00000198198), score: 0.58
KIF15kinesin family member 15 (ENSG00000163808), score: 0.57
KLHL1kelch-like 1 (Drosophila) (ENSG00000150361), score: 0.99
KPNA6karyopherin alpha 6 (importin alpha 7) (ENSG00000025800), score: -0.54
LAIR2leukocyte-associated immunoglobulin-like receptor 2 (ENSG00000167618), score: 0.58
LILRA4leukocyte immunoglobulin-like receptor, subfamily A (with TM domain), member 4 (ENSG00000239961), score: 0.6
LINGO4leucine rich repeat and Ig domain containing 4 (ENSG00000213171), score: 0.55
LOC100289938similar to cytoplasmic tRNA 2-thiolation protein 2 (ENSG00000174177), score: 0.59
LRPAP1low density lipoprotein receptor-related protein associated protein 1 (ENSG00000163956), score: 0.53
LY75lymphocyte antigen 75 (ENSG00000054219), score: 0.75
MAN2C1mannosidase, alpha, class 2C, member 1 (ENSG00000140400), score: 0.75
MED9mediator complex subunit 9 (ENSG00000141026), score: 0.54
METTL10methyltransferase like 10 (ENSG00000203791), score: -0.63
MFSD2Bmajor facilitator superfamily domain containing 2B (ENSG00000205639), score: 0.62
MORN4MORN repeat containing 4 (ENSG00000171160), score: 0.52
MRPS17mitochondrial ribosomal protein S17 (ENSG00000239789), score: -0.73
MYL6Bmyosin, light chain 6B, alkali, smooth muscle and non-muscle (ENSG00000196465), score: 0.63
NAT15N-acetyltransferase 15 (GCN5-related, putative) (ENSG00000122390), score: -0.77
NAT9N-acetyltransferase 9 (GCN5-related, putative) (ENSG00000109065), score: -0.58
NDUFB2NADH dehydrogenase (ubiquinone) 1 beta subcomplex, 2, 8kDa (ENSG00000090266), score: -0.71
NLRP1NLR family, pyrin domain containing 1 (ENSG00000091592), score: 0.73
NME7non-metastatic cells 7, protein expressed in (nucleoside-diphosphate kinase) (ENSG00000143156), score: -0.63
OSMoncostatin M (ENSG00000099985), score: 0.66
PCID2PCI domain containing 2 (ENSG00000126226), score: 0.52
PDE6Bphosphodiesterase 6B, cGMP-specific, rod, beta (ENSG00000133256), score: 0.56
PDSS1prenyl (decaprenyl) diphosphate synthase, subunit 1 (ENSG00000148459), score: -0.73
PHF10PHD finger protein 10 (ENSG00000130024), score: -0.54
PIWIL3piwi-like 3 (Drosophila) (ENSG00000184571), score: 0.95
POLR3Epolymerase (RNA) III (DNA directed) polypeptide E (80kD) (ENSG00000058600), score: -0.54
PRR4proline rich 4 (lacrimal) (ENSG00000111215), score: 0.72
PTCD1pentatricopeptide repeat domain 1 (ENSG00000106246), score: 0.82
RALAv-ral simian leukemia viral oncogene homolog A (ras related) (ENSG00000006451), score: -0.88
RCOR1REST corepressor 1 (ENSG00000089902), score: -0.66
RECQL4RecQ protein-like 4 (ENSG00000160957), score: 0.57
RPF2ribosome production factor 2 homolog (S. cerevisiae) (ENSG00000197498), score: -0.64
RRHretinal pigment epithelium-derived rhodopsin homolog (ENSG00000180245), score: 0.55
SLC25A34solute carrier family 25, member 34 (ENSG00000162461), score: 0.55
SNRNP27small nuclear ribonucleoprotein 27kDa (U4/U6.U5) (ENSG00000124380), score: -0.81
SNX18sorting nexin 18 (ENSG00000178996), score: -0.97
SNX33sorting nexin 33 (ENSG00000173548), score: 0.62
SPDYCspeedy homolog C (Xenopus laevis) (ENSG00000204710), score: 0.64
SPNsialophorin (ENSG00000197471), score: 0.95
SUDS3suppressor of defective silencing 3 homolog (S. cerevisiae) (ENSG00000111707), score: -1
SVIPsmall VCP/p97-interacting protein (ENSG00000198168), score: -0.63
TAS1R3taste receptor, type 1, member 3 (ENSG00000169962), score: 0.51
TAS2R5taste receptor, type 2, member 5 (ENSG00000127366), score: 0.63
TBX10T-box 10 (ENSG00000167800), score: 0.57
TIPRLTIP41, TOR signaling pathway regulator-like (S. cerevisiae) (ENSG00000143155), score: -0.68
TMCO6transmembrane and coiled-coil domains 6 (ENSG00000113119), score: 0.53
TMEM189transmembrane protein 189 (ENSG00000124208), score: -0.7
TNFAIP1tumor necrosis factor, alpha-induced protein 1 (endothelial) (ENSG00000109079), score: 0.71
TNFRSF17tumor necrosis factor receptor superfamily, member 17 (ENSG00000048462), score: 0.96
TNMDtenomodulin (ENSG00000000005), score: 0.51
TNPO1transportin 1 (ENSG00000083312), score: -0.94
TRMT61BtRNA methyltransferase 61 homolog B (S. cerevisiae) (ENSG00000171103), score: -0.56
TSC22D1TSC22 domain family, member 1 (ENSG00000102804), score: -0.89
TSHRthyroid stimulating hormone receptor (ENSG00000165409), score: 0.63
TTC33tetratricopeptide repeat domain 33 (ENSG00000113638), score: -0.56
UAP1UDP-N-acteylglucosamine pyrophosphorylase 1 (ENSG00000117143), score: -0.87
UBE2CBPubiquitin-conjugating enzyme E2C binding protein (ENSG00000118420), score: 0.61
UBR7ubiquitin protein ligase E3 component n-recognin 7 (putative) (ENSG00000012963), score: -0.56
USP12ubiquitin specific peptidase 12 (ENSG00000152484), score: -0.65
USP9Xubiquitin specific peptidase 9, X-linked (ENSG00000124486), score: -0.53
UTP20UTP20, small subunit (SSU) processome component, homolog (yeast) (ENSG00000120800), score: 0.57
XPNPEP3X-prolyl aminopeptidase (aminopeptidase P) 3, putative (ENSG00000196236), score: -0.54
XRCC2X-ray repair complementing defective repair in Chinese hamster cells 2 (ENSG00000196584), score: 0.74
YPEL5yippee-like 5 (Drosophila) (ENSG00000119801), score: -0.55
ZCWPW1zinc finger, CW type with PWWP domain 1 (ENSG00000078487), score: -0.61
ZFYVE21zinc finger, FYVE domain containing 21 (ENSG00000100711), score: 0.52
ZNF24zinc finger protein 24 (ENSG00000172466), score: 0.63
ZNF615zinc finger protein 615 (ENSG00000197619), score: 0.67
ZWINTZW10 interactor (ENSG00000122952), score: -0.52
Non-Entrez genes
Unknown, score:
HELP
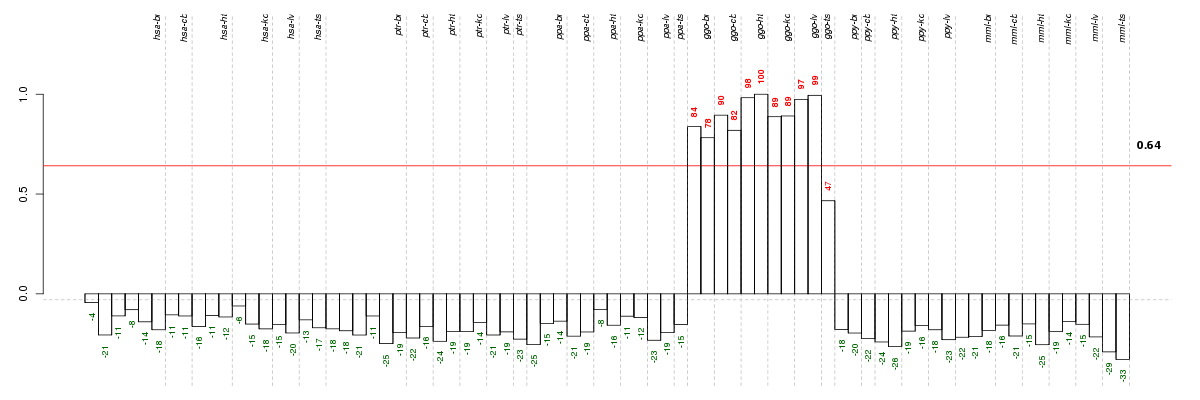
Conditions in the module, given in the same order as on the expression
plot above. Red color means over-expression, green under-expression in
the given condition.
The barplot below shows the condition (sample) scores. A separate bar
is shown for each sample, its height is the corresponding score of the
sample in the module. The red and green numbers on the bars are the
sample scores expressed in percents, i.e. 100% is 1.0.
The height of each bar corresponds to the weighted
mean expression of the module genes. The weights are the gene scores
of the module and they are positive for the genes listed in
red above and they are negative for
the genes that are listed in
green.
Bars going up correspond to samples listed in
red (the ones that are different
enough to included in the module). In these samples
the red module genes are highly
expressed, and the green
module genes are lowly expressed. The behavior of the genes is the
opposite for bars going down.
The red and green lines show the module thresholds, samples above
the red line and below the green line are included in the module.
The different species and tissues that were part of the study, are separated
by dashed vertical lines.
— Click on the Help button again to close this help window.
| Id | species | tissue | sex | individual |
| ggo_br_f_ca1 | ggo | br | f | _ |
| ggo_cb_f_ca1 | ggo | cb | f | _ |
| ggo_br_m_ca1 | ggo | br | m | _ |
| ggo_kd_m_ca1 | ggo | kd | m | _ |
| ggo_kd_f_ca1 | ggo | kd | f | _ |
| ggo_cb_m_ca1 | ggo | cb | m | _ |
| ggo_lv_m_ca1 | ggo | lv | m | _ |
| ggo_ht_m_ca1 | ggo | ht | m | _ |
| ggo_lv_f_ca1 | ggo | lv | f | _ |
| ggo_ht_f_ca1 | ggo | ht | f | _ |


© 2008-2010 Computational Biology Group, Department of Medical Genetics,
University of Lausanne, Switzerland