Previous module |
Next module
Module #57, TG: 2.6, TC: 2.4, 129 probes, 129 Entrez genes, 3 conditions


HELP
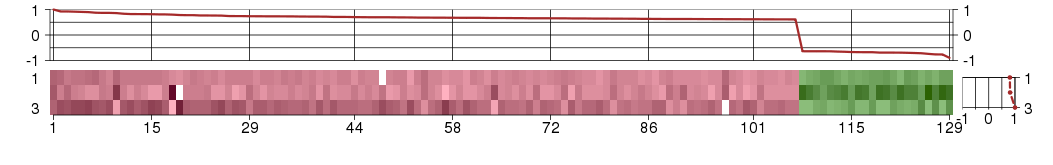
The image plot shows the color-coded level of gene expression, for the
genes and conditions in a given transcription module. The genes are on
the horizontal, the conditions on the vertical axis.
The genes are ordered according to their ISA gene scores, similarly
the conditions are ordered according to their condition scores. The
score of a gene means the «degree of inclusion» in
the module: a high score gene is essential in the module.
Condition scores can also be negative, that means that the genes of
the module are all down-regulated in the condition. Here the absolute
value of the score gives the «degree of inclusion».
The plots above and beside the expression matrix show the gene scores
and condition scores, respectively.
Note that the plot is interactive, you can see the name of the gene
and condition under the mouse cursor.
The expression matrix was normalized to have mean zero and standard
deviation one for every gene separately across all conditions
(i.e. not just for the conditions in the module).
— Click on the Help button again to close this help window.

Under-expression is coded with green,
over-expression with red color.
Help |
Hide |
Top
Help |
Show |
Top
The GO tree — Biological processes
HELP
This is one of three sections showing Gene Ontology enrichment of the
current module: in this case for biological processes.
The graph shows the hierarchy of the GO categories, their enrichment
for the current module is color coded, and the blue number beside the
category is the minus log ten p-value of the enrichment. (Calculated
using the standard hypergeometric test.) The color of the arrows code
«is a» (cyan) and «part of» relationships.
The tree was built the following way. First all GO terms with more
significant enrichment p-value than 0.05 were collected. Then all
paths from these terms to the root node of the GO tree were included
too. If a GO term is included more than once in the tree, then the
green numbers show 1) the id of the node, this makes it easier to find
other appereances of the term, and 2) the number of appearences.
Note that the same GO category might show up on the graph many
times. This is because the GO was «straightened» for this
graph, i.e. if there are more paths from a GO term to the root node of
the tree, all of them are included. The green numbers
Move the mouse cursor over the terms to get their definition. Clicking
on them takes you to the corresponding Gene Ontology web page.
If you cannot see a graph here at all, that means that there were no
significantly enriched GO categories, at the 0.05 level.
— Click on the Help button again to close this help window.
Help |
Hide |
Top
Help |
Show |
Top
The GO tree — Cellular Components
HELP
This is one of three sections showing Gene Ontology enrichment of the
current module: in this case for cellular components.
The graph shows the hierarchy of the GO categories, their enrichment
for the current module is color coded, and the blue number beside the
category is the minus log ten p-value of the enrichment. (Calculated
using the standard hypergeometric test.) The color of the arrows code
«is a» (cyan) and «part of» relationships.
The tree was built the following way. First all GO terms with more
significant enrichment p-value than 0.05 were collected. Then all
paths from these terms to the root node of the GO tree were included
too. If a GO term is included more than once in the tree, then the
green numbers show 1) the id of the node, this makes it easier to find
other appereances of the term, and 2) the number of appearences.
Note that the same GO category might show up on the graph many
times. This is because the GO was «straightened» for this
graph, i.e. if there are more paths from a GO term to the root node of
the tree, all of them are included. The green numbers
Move the mouse cursor over the terms to get their definition. Clicking
on them takes you to the corresponding Gene Ontology web page.
If you cannot see a graph here at all, that means that there were no
significantly enriched GO categories, at the 0.05 level.
— Click on the Help button again to close this help window.
Help |
Hide |
Top
Help |
Show |
Top
The GO tree — Molecular Function
HELP
This is one of three sections showing Gene Ontology enrichment of the
current module: in this case for molecular function.
The graph shows the hierarchy of the GO categories, their enrichment
for the current module is color coded, and the blue number beside the
category is the minus log ten p-value of the enrichment. (Calculated
using the standard hypergeometric test.) The color of the arrows code
«is a» (cyan) and «part of» relationships.
The tree was built the following way. First all GO terms with more
significant enrichment p-value than 0.05 were collected. Then all
paths from these terms to the root node of the GO tree were included
too. If a GO term is included more than once in the tree, then the
green numbers show 1) the id of the node, this makes it easier to find
other appereances of the term, and 2) the number of appearences.
Note that the same GO category might show up on the graph many
times. This is because the GO was «straightened» for this
graph, i.e. if there are more paths from a GO term to the root node of
the tree, all of them are included. The green numbers
Move the mouse cursor over the terms to get their definition. Clicking
on them takes you to the corresponding Gene Ontology web page.
If you cannot see a graph here at all, that means that there were no
significantly enriched GO categories, at the 0.05 level.
— Click on the Help button again to close this help window.
molecular_function
Elemental activities, such as catalysis or binding, describing the actions of a gene product at the molecular level. A given gene product may exhibit one or more molecular functions.
signal transducer activity
Mediates the transfer of a signal from the outside to the inside of a cell by means other than the introduction of the signal molecule itself into the cell.
receptor activity
Combining with an extracellular or intracellular messenger to initiate a change in cell activity.
transmembrane receptor activity
Combining with an extracellular or intracellular messenger to initiate a change in cell activity, and spanning to the membrane of either the cell or an organelle.
scavenger receptor activity
Combining with acetylated low-density lipoproteins, advanced glycation end products, or other polyanionic ligands to initiate a change in cell activity.
molecular transducer activity
The molecular function that accepts an input of one form and creates an output of a different form.
all
NA
Help |
Hide |
Top
Help |
Show |
Top
GO BP test for over-representation
HELP
List of all enriched GO categories (biological processes), at the 0.05
p-value level.
The columns:
- ExpCount is the expected count of genes in the
module annotated with the given GO term, just by chance.
- Count
is the number of genes in the module annotated with the given GO
term.
- Size is the total number of genes (in our universe)
annotated with the GO term.
Clicking on Count shows the genes that drive the
enrichment. You can also click on the individual numbers in
the Count column, to show the driving genes for that individual
GO category.
Clicking on the GO identifiers takes you to the Gene Ontology web
pages.
— Click on the Help button again to close this help window.
| Id | Pvalue | ExpCount | Count | Size | Term |
| GO:0007010 | 3.492e-02 | 3.794 | 11
CLN8, CNP, DAAM2, MID1IP1, MYO9B, PREX1, PRKCQ, PTK2, RHOG, SEMA6A, TBCE | 394 | cytoskeleton organization |
Help |
Hide |
Top
Help |
Show |
Top
GO CC test for over-representation
HELP
List of all enriched GO categories (cellular components), at the 0.05
p-value level.
The columns:
- ExpCount is the expected count of genes in the
module annotated with the given GO term, just by chance.
- Count
is the number of genes in the module annotated with the given GO
term.
- Size is the total number of genes (in our universe)
annotated with the GO term.
Clicking on Count shows the genes that drive the
enrichment. You can also click on the individual numbers in
the Count column, to show the driving genes for that individual
GO category.
Clicking on the GO identifiers takes you to the Gene Ontology web
pages.
— Click on the Help button again to close this help window.
Help |
Hide |
Top
Help |
Show |
Top
GO MF test for over-representation
HELP
List of all enriched GO categories (molecular function), at the 0.05
p-value level.
The columns:
- ExpCount is the expected count of genes in the
module annotated with the given GO term, just by chance.
- Count
is the number of genes in the module annotated with the given GO
term.
- Size is the total number of genes (in our universe)
annotated with the GO term.
Clicking on Count shows the genes that drive the
enrichment. You can also click on the individual numbers in
the Count column, to show the driving genes for that individual
GO category.
Clicking on the GO identifiers takes you to the Gene Ontology web
pages.
— Click on the Help button again to close this help window.
| Id | Pvalue | ExpCount | Count | Size | Term |
| GO:0005044 | 9.321e-03 | 0.3293 | 4
DMBT1, ENPP2, HHIPL1, TMPRSS5 | 34 | scavenger receptor activity |
| GO:0016462 | 4.961e-02 | 5.385 | 13
ABCA2, ATL2, ATP10B, ATP11A, CCT8, ENPP2, LHPP, MYO9B, RAB11B, RAB4B, RHOG, SMARCA1, YME1L1 | 556 | pyrophosphatase activity |
Help |
Hide |
Top
Help |
Show |
Top
KEGG Pathway test for over-representation
HELP
List of all enriched KEGG pathways, at the 0.05
p-value level.
The columns:
- ExpCount is the expected count of genes in the
module annotated with the given KEGG pathway, just by chance.
- Count
is the number of genes in the module annotated with the given KEGG
pathway.
- Size is the total number of genes (in our universe)
annotated with the KEGG pathway.
Clicking on Count shows the genes that drive the
enrichment. You can also click on the individual numbers in
the Count column, to show the driving genes for that individual
KEGG pathway.
Clicking on the KEGG identifiers takes you to the KEGG web site.
— Click on the Help button again to close this help window.
Help |
Hide |
Top
Help |
Show |
Top
miRNA test for over-representation
HELP
List of all enriched miRNA families, at the 0.05
p-value level.
The columns:
- ExpCount is the expected count of genes in the
module regulated by the given miRNA family, just by chance.
- Count
is the number of genes in the module regulated by the given miRNA
family.
- Size is the total number of genes (in our universe)
regulated with the given miRNA family.
Clicking on Count shows the genes that drive the
enrichment. You can also click on the individual numbers in
the Count column, to show the driving genes for that individual
miRNA family.
The miRNA regulation data was taken from the TargetScan database.
(Only the conserved sites were used for the current analysis.)
Clicking on the miRNA names takes you to the TargetScan web site.
— Click on the Help button again to close this help window.
Help |
Hide |
Top
Help |
Show |
Top
Chromosome test for over-representation
HELP
List of all enriched Chromosomes, at the 0.05
p-value level.
The columns:
- ExpCount is the expected number of genes in the
module on the given chromosome, just by chance.
- Count
is the number of genes in the module on the given chromosome.
- Size is the total number of genes (in our universe)
on the given chromosome.
Clicking on Count shows the genes that drive the
enrichment. You can also click on the individual numbers in
the Count column, to show the driving genes for that individual
chromosome.
— Click on the Help button again to close this help window.
HELP
A list of all genes in the current module, in alphabetical order. The
size of the text corresponds to the gene scores.
Text color indicates correlation and anti-correlation: genes of the
same color are correlated, both move up or down in the module samples
(listed below). Genes of different color are anti-correlated, they
have opposite behavior in the module samples.
Note, that text color of the individual genes should be interpreted
together with the coloring of the samples below. For
red samples,
red genes have a higher expression
(compared to the average gene expression level),
green genes have a lower
expression.
Green samples have opposite
behavior, in these red genes have a
lower expression, green genes
have a higher expression.
Note that some gene symbols may show up more than once, if many
probes match the same Entrez gene.
Genes with no Entrez mapping are given separately, with their
Affymetrics probe ID.
— Click on the Help button again to close this help window.
Entrez genes
ABCA2ATP-binding cassette, sub-family A (ABC1), member 2 (ENSG00000107331), score: 0.64
ADAMTS14ADAM metallopeptidase with thrombospondin type 1 motif, 14 (ENSG00000138316), score: 0.62
AIDAaxin interactor, dorsalization associated (ENSG00000186063), score: -0.67
ATL2atlastin GTPase 2 (ENSG00000119787), score: -0.72
ATP10BATPase, class V, type 10B (ENSG00000118322), score: 0.71
ATP11AATPase, class VI, type 11A (ENSG00000068650), score: 0.66
C11orf9chromosome 11 open reading frame 9 (ENSG00000124920), score: 0.68
C1orf198chromosome 1 open reading frame 198 (ENSG00000119280), score: 0.73
CAPN3calpain 3, (p94) (ENSG00000092529), score: 0.64
CAPN9calpain 9 (ENSG00000135773), score: 0.68
CCPG1cell cycle progression 1 (ENSG00000214882), score: -0.67
CCT8chaperonin containing TCP1, subunit 8 (theta) (ENSG00000156261), score: -0.9
CD22CD22 molecule (ENSG00000012124), score: 0.91
CERCAMcerebral endothelial cell adhesion molecule (ENSG00000167123), score: 0.87
CHADLchondroadherin-like (ENSG00000100399), score: 0.82
CHST6carbohydrate (N-acetylglucosamine 6-O) sulfotransferase 6 (ENSG00000183196), score: 0.61
CLCA4chloride channel accessory 4 (ENSG00000016602), score: 0.81
CLDND1claudin domain containing 1 (ENSG00000080822), score: 0.69
CLN8ceroid-lipofuscinosis, neuronal 8 (epilepsy, progressive with mental retardation) (ENSG00000182372), score: 0.92
CLUL1clusterin-like 1 (retinal) (ENSG00000079101), score: 0.74
CNP2',3'-cyclic nucleotide 3' phosphodiesterase (ENSG00000173786), score: 0.74
CPNE2copine II (ENSG00000140848), score: 0.74
CRYBB1crystallin, beta B1 (ENSG00000100122), score: 0.64
CYB5D1cytochrome b5 domain containing 1 (ENSG00000182224), score: -0.76
DAAM2dishevelled associated activator of morphogenesis 2 (ENSG00000146122), score: 0.64
DEFB134defensin, beta 134 (ENSG00000205882), score: 0.67
DMBT1deleted in malignant brain tumors 1 (ENSG00000187908), score: 0.9
DNMBPdynamin binding protein (ENSG00000107554), score: -0.64
DOHHdeoxyhypusine hydroxylase/monooxygenase (ENSG00000129932), score: 0.77
DSELdermatan sulfate epimerase-like (ENSG00000171451), score: 0.61
DUSP11dual specificity phosphatase 11 (RNA/RNP complex 1-interacting) (ENSG00000144048), score: -0.65
EFSembryonal Fyn-associated substrate (ENSG00000100842), score: 0.61
ELOVL1elongation of very long chain fatty acids (FEN1/Elo2, SUR4/Elo3, yeast)-like 1 (ENSG00000066322), score: 0.82
EML2echinoderm microtubule associated protein like 2 (ENSG00000125746), score: 0.64
ENPP2ectonucleotide pyrophosphatase/phosphodiesterase 2 (ENSG00000136960), score: 0.65
FA2Hfatty acid 2-hydroxylase (ENSG00000103089), score: 0.67
FABP6fatty acid binding protein 6, ileal (ENSG00000170231), score: 0.68
FAM102Afamily with sequence similarity 102, member A (ENSG00000167106), score: 0.68
FAM103A1family with sequence similarity 103, member A1 (ENSG00000169612), score: -0.67
FAM108B1family with sequence similarity 108, member B1 (ENSG00000107362), score: 0.63
FAM124Afamily with sequence similarity 124A (ENSG00000150510), score: 0.83
FAM125Bfamily with sequence similarity 125, member B (ENSG00000196814), score: 0.72
FAM175Bfamily with sequence similarity 175, member B (ENSG00000165660), score: -0.69
FAM53Bfamily with sequence similarity 53, member B (ENSG00000189319), score: 0.71
FNTBfarnesyltransferase, CAAX box, beta (ENSG00000125954), score: 0.62
GAB2GRB2-associated binding protein 2 (ENSG00000033327), score: 0.68
GABRQgamma-aminobutyric acid (GABA) receptor, theta (ENSG00000147402), score: 0.62
GALNT6UDP-N-acetyl-alpha-D-galactosamine:polypeptide N-acetylgalactosaminyltransferase 6 (GalNAc-T6) (ENSG00000139629), score: 0.87
GIPC1GIPC PDZ domain containing family, member 1 (ENSG00000123159), score: 0.65
GIPRgastric inhibitory polypeptide receptor (ENSG00000010310), score: 0.78
GPR78G protein-coupled receptor 78 (ENSG00000155269), score: 0.8
GREM1gremlin 1 (ENSG00000166923), score: 0.82
GTF2E2general transcription factor IIE, polypeptide 2, beta 34kDa (ENSG00000197265), score: -0.69
GUK1guanylate kinase 1 (ENSG00000143774), score: 0.65
HEATR1HEAT repeat containing 1 (ENSG00000119285), score: -0.64
HHIPL1HHIP-like 1 (ENSG00000182218), score: 0.63
ICOSLGinducible T-cell co-stimulator ligand (ENSG00000160223), score: 0.7
IL1RAPL1interleukin 1 receptor accessory protein-like 1 (ENSG00000169306), score: 0.73
IPO13importin 13 (ENSG00000117408), score: 0.61
KCNH8potassium voltage-gated channel, subfamily H (eag-related), member 8 (ENSG00000183960), score: 0.72
KIAA1755KIAA1755 (ENSG00000149633), score: 0.66
KIRREL2kin of IRRE like 2 (Drosophila) (ENSG00000126259), score: 0.63
KREMEN2kringle containing transmembrane protein 2 (ENSG00000131650), score: 1
LGR5leucine-rich repeat-containing G protein-coupled receptor 5 (ENSG00000139292), score: 0.82
LHPPphospholysine phosphohistidine inorganic pyrophosphate phosphatase (ENSG00000107902), score: 0.77
LIX1Lix1 homolog (chicken) (ENSG00000145721), score: 0.72
LRIT2leucine-rich repeat, immunoglobulin-like and transmembrane domains 2 (ENSG00000204033), score: 0.86
MAK16MAK16 homolog (S. cerevisiae) (ENSG00000198042), score: -0.64
MARCKSL1MARCKS-like 1 (ENSG00000175130), score: 0.73
MATN1matrilin 1, cartilage matrix protein (ENSG00000162510), score: 0.62
MFAP1microfibrillar-associated protein 1 (ENSG00000140259), score: -0.66
MID1IP1MID1 interacting protein 1 (gastrulation specific G12 homolog (zebrafish)) (ENSG00000165175), score: 0.62
MKRN3makorin ring finger protein 3 (ENSG00000179455), score: 0.65
MPLmyeloproliferative leukemia virus oncogene (ENSG00000117400), score: 0.64
MYO9Bmyosin IXB (ENSG00000099331), score: 0.76
NIPAL4NIPA-like domain containing 4 (ENSG00000172548), score: 0.92
NKX2-2NK2 homeobox 2 (ENSG00000125820), score: 0.63
NOP58NOP58 ribonucleoprotein homolog (yeast) (ENSG00000055044), score: -0.64
NPC1Niemann-Pick disease, type C1 (ENSG00000141458), score: 0.92
PACS2phosphofurin acidic cluster sorting protein 2 (ENSG00000179364), score: 0.64
PHLPP1PH domain and leucine rich repeat protein phosphatase 1 (ENSG00000081913), score: 0.63
PIP4K2Aphosphatidylinositol-5-phosphate 4-kinase, type II, alpha (ENSG00000150867), score: 0.67
PLEKHG3pleckstrin homology domain containing, family G (with RhoGef domain) member 3 (ENSG00000126822), score: 0.66
PLXNB3plexin B3 (ENSG00000198753), score: 0.62
POLR2Gpolymerase (RNA) II (DNA directed) polypeptide G (ENSG00000168002), score: 0.63
PREX1phosphatidylinositol-3,4,5-trisphosphate-dependent Rac exchange factor 1 (ENSG00000124126), score: 0.73
PRKCQprotein kinase C, theta (ENSG00000065675), score: 0.65
PRPF18PRP18 pre-mRNA processing factor 18 homolog (S. cerevisiae) (ENSG00000165630), score: -0.76
PRR18proline rich 18 (ENSG00000176381), score: 0.78
PRR5Lproline rich 5 like (ENSG00000135362), score: 0.67
PRRG1proline rich Gla (G-carboxyglutamic acid) 1 (ENSG00000130962), score: 0.73
PTK2PTK2 protein tyrosine kinase 2 (ENSG00000169398), score: 0.69
PTPRHprotein tyrosine phosphatase, receptor type, H (ENSG00000080031), score: 0.87
PXKPX domain containing serine/threonine kinase (ENSG00000168297), score: 0.62
RAB11BRAB11B, member RAS oncogene family (ENSG00000185236), score: 0.66
RAB4BRAB4B, member RAS oncogene family (ENSG00000167578), score: 0.69
RALGDSral guanine nucleotide dissociation stimulator (ENSG00000160271), score: 0.62
RBP3retinol binding protein 3, interstitial (ENSG00000107618), score: 0.68
RHOGras homolog gene family, member G (rho G) (ENSG00000177105), score: 0.81
RIOK2RIO kinase 2 (yeast) (ENSG00000058729), score: -0.69
ROM1retinal outer segment membrane protein 1 (ENSG00000149489), score: 0.7
RPF1ribosome production factor 1 homolog (S. cerevisiae) (ENSG00000117133), score: -0.71
SAMD4Bsterile alpha motif domain containing 4B (ENSG00000179134), score: 0.66
SCNN1Dsodium channel, nonvoltage-gated 1, delta (ENSG00000162572), score: 0.63
SEMA4Dsema domain, immunoglobulin domain (Ig), transmembrane domain (TM) and short cytoplasmic domain, (semaphorin) 4D (ENSG00000187764), score: 0.7
SEMA6Asema domain, transmembrane domain (TM), and cytoplasmic domain, (semaphorin) 6A (ENSG00000092421), score: 0.66
SH3GLB2SH3-domain GRB2-like endophilin B2 (ENSG00000148341), score: 0.72
SH3TC2SH3 domain and tetratricopeptide repeats 2 (ENSG00000169247), score: 0.74
SIRT2sirtuin 2 (ENSG00000068903), score: 0.76
SLC5A11solute carrier family 5 (sodium/glucose cotransporter), member 11 (ENSG00000158865), score: 0.66
SMARCA1SWI/SNF related, matrix associated, actin dependent regulator of chromatin, subfamily a, member 1 (ENSG00000102038), score: -0.69
SSBSjogren syndrome antigen B (autoantigen La) (ENSG00000138385), score: -0.74
TBC1D2TBC1 domain family, member 2 (ENSG00000095383), score: 0.63
TBCBtubulin folding cofactor B (ENSG00000105254), score: 0.63
TBCEtubulin folding cofactor E (ENSG00000116957), score: -0.7
THUMPD1THUMP domain containing 1 (ENSG00000066654), score: -0.64
TJAP1tight junction associated protein 1 (peripheral) (ENSG00000137221), score: 0.68
TMC6transmembrane channel-like 6 (ENSG00000141524), score: 0.78
TMEM144transmembrane protein 144 (ENSG00000164124), score: 0.73
TMEM175transmembrane protein 175 (ENSG00000127419), score: 0.62
TMPRSS5transmembrane protease, serine 5 (ENSG00000166682), score: 0.69
TNFRSF13Ctumor necrosis factor receptor superfamily, member 13C (ENSG00000159958), score: 0.69
TP53INP2tumor protein p53 inducible nuclear protein 2 (ENSG00000078804), score: 0.74
TRAPPC10trafficking protein particle complex 10 (ENSG00000160218), score: 0.68
TRIM41tripartite motif-containing 41 (ENSG00000146063), score: 0.67
UNC5Cunc-5 homolog C (C. elegans) (ENSG00000182168), score: 0.71
YME1L1YME1-like 1 (S. cerevisiae) (ENSG00000136758), score: -0.67
ZCCHC24zinc finger, CCHC domain containing 24 (ENSG00000165424), score: 0.61
ZSWIM6zinc finger, SWIM-type containing 6 (ENSG00000130449), score: 0.7
Non-Entrez genes
Unknown, score:
HELP
Conditions in the module, given in the same order as on the expression
plot above. Red color means over-expression, green under-expression in
the given condition.
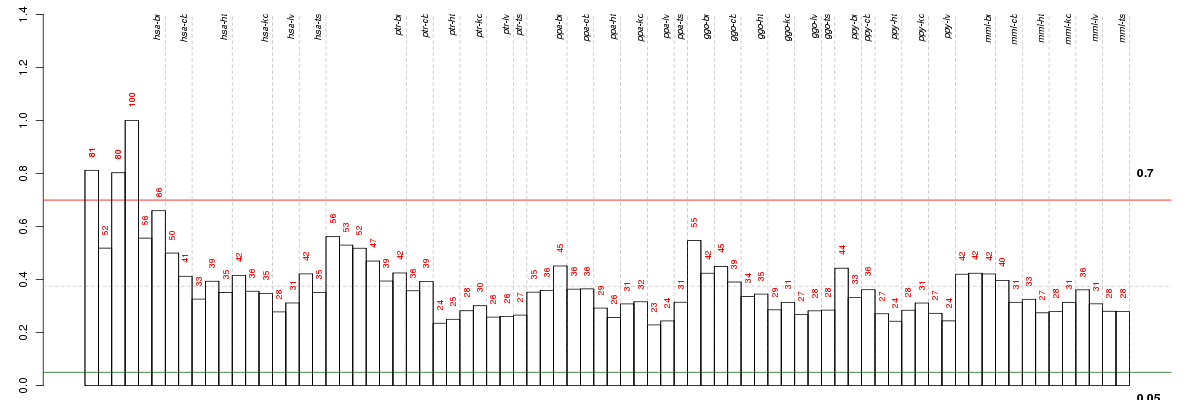
The barplot below shows the condition (sample) scores. A separate bar
is shown for each sample, its height is the corresponding score of the
sample in the module. The red and green numbers on the bars are the
sample scores expressed in percents, i.e. 100% is 1.0.
The height of each bar corresponds to the weighted
mean expression of the module genes. The weights are the gene scores
of the module and they are positive for the genes listed in
red above and they are negative for
the genes that are listed in
green.
Bars going up correspond to samples listed in
red (the ones that are different
enough to included in the module). In these samples
the red module genes are highly
expressed, and the green
module genes are lowly expressed. The behavior of the genes is the
opposite for bars going down.
The red and green lines show the module thresholds, samples above
the red line and below the green line are included in the module.
The different species and tissues that were part of the study, are separated
by dashed vertical lines.
— Click on the Help button again to close this help window.
| Id | species | tissue | sex | individual |
| hsa_br_m3_ca1 | hsa | br | m | 3 |
| hsa_br_m7_ca1 | hsa | br | m | 7 |
| hsa_br_m6_ca1 | hsa | br | m | 6 |


© 2008-2010 Computational Biology Group, Department of Medical Genetics,
University of Lausanne, Switzerland