Previous module |
Next module
Module #85, TG: 2.6, TC: 1.4, 124 probes, 122 Entrez genes, 12 conditions


HELP
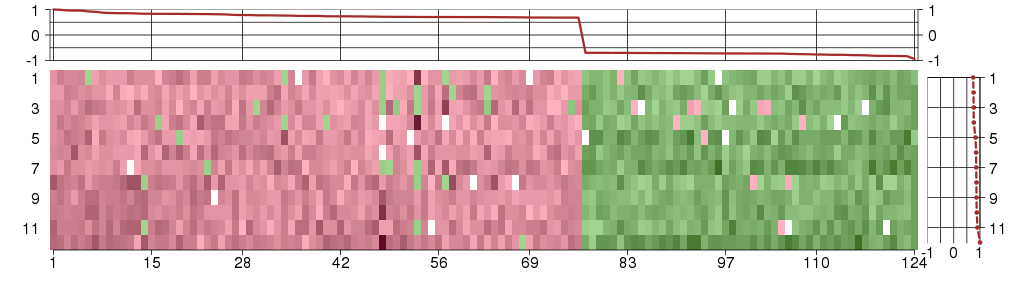
The image plot shows the color-coded level of gene expression, for the
genes and conditions in a given transcription module. The genes are on
the horizontal, the conditions on the vertical axis.
The genes are ordered according to their ISA gene scores, similarly
the conditions are ordered according to their condition scores. The
score of a gene means the «degree of inclusion» in
the module: a high score gene is essential in the module.
Condition scores can also be negative, that means that the genes of
the module are all down-regulated in the condition. Here the absolute
value of the score gives the «degree of inclusion».
The plots above and beside the expression matrix show the gene scores
and condition scores, respectively.
Note that the plot is interactive, you can see the name of the gene
and condition under the mouse cursor.
The expression matrix was normalized to have mean zero and standard
deviation one for every gene separately across all conditions
(i.e. not just for the conditions in the module).
— Click on the Help button again to close this help window.

Under-expression is coded with green,
over-expression with red color.
Help |
Hide |
Top
Help |
Show |
Top
The GO tree — Biological processes
HELP
This is one of three sections showing Gene Ontology enrichment of the
current module: in this case for biological processes.
The graph shows the hierarchy of the GO categories, their enrichment
for the current module is color coded, and the blue number beside the
category is the minus log ten p-value of the enrichment. (Calculated
using the standard hypergeometric test.) The color of the arrows code
«is a» (cyan) and «part of» relationships.
The tree was built the following way. First all GO terms with more
significant enrichment p-value than 0.05 were collected. Then all
paths from these terms to the root node of the GO tree were included
too. If a GO term is included more than once in the tree, then the
green numbers show 1) the id of the node, this makes it easier to find
other appereances of the term, and 2) the number of appearences.
Note that the same GO category might show up on the graph many
times. This is because the GO was «straightened» for this
graph, i.e. if there are more paths from a GO term to the root node of
the tree, all of them are included. The green numbers
Move the mouse cursor over the terms to get their definition. Clicking
on them takes you to the corresponding Gene Ontology web page.
If you cannot see a graph here at all, that means that there were no
significantly enriched GO categories, at the 0.05 level.
— Click on the Help button again to close this help window.
Help |
Hide |
Top
Help |
Show |
Top
The GO tree — Cellular Components
HELP
This is one of three sections showing Gene Ontology enrichment of the
current module: in this case for cellular components.
The graph shows the hierarchy of the GO categories, their enrichment
for the current module is color coded, and the blue number beside the
category is the minus log ten p-value of the enrichment. (Calculated
using the standard hypergeometric test.) The color of the arrows code
«is a» (cyan) and «part of» relationships.
The tree was built the following way. First all GO terms with more
significant enrichment p-value than 0.05 were collected. Then all
paths from these terms to the root node of the GO tree were included
too. If a GO term is included more than once in the tree, then the
green numbers show 1) the id of the node, this makes it easier to find
other appereances of the term, and 2) the number of appearences.
Note that the same GO category might show up on the graph many
times. This is because the GO was «straightened» for this
graph, i.e. if there are more paths from a GO term to the root node of
the tree, all of them are included. The green numbers
Move the mouse cursor over the terms to get their definition. Clicking
on them takes you to the corresponding Gene Ontology web page.
If you cannot see a graph here at all, that means that there were no
significantly enriched GO categories, at the 0.05 level.
— Click on the Help button again to close this help window.
Help |
Hide |
Top
Help |
Show |
Top
The GO tree — Molecular Function
HELP
This is one of three sections showing Gene Ontology enrichment of the
current module: in this case for molecular function.
The graph shows the hierarchy of the GO categories, their enrichment
for the current module is color coded, and the blue number beside the
category is the minus log ten p-value of the enrichment. (Calculated
using the standard hypergeometric test.) The color of the arrows code
«is a» (cyan) and «part of» relationships.
The tree was built the following way. First all GO terms with more
significant enrichment p-value than 0.05 were collected. Then all
paths from these terms to the root node of the GO tree were included
too. If a GO term is included more than once in the tree, then the
green numbers show 1) the id of the node, this makes it easier to find
other appereances of the term, and 2) the number of appearences.
Note that the same GO category might show up on the graph many
times. This is because the GO was «straightened» for this
graph, i.e. if there are more paths from a GO term to the root node of
the tree, all of them are included. The green numbers
Move the mouse cursor over the terms to get their definition. Clicking
on them takes you to the corresponding Gene Ontology web page.
If you cannot see a graph here at all, that means that there were no
significantly enriched GO categories, at the 0.05 level.
— Click on the Help button again to close this help window.
molecular_function
Elemental activities, such as catalysis or binding, describing the actions of a gene product at the molecular level. A given gene product may exhibit one or more molecular functions.
catalytic activity
Catalysis of a biochemical reaction at physiological temperatures. In biologically catalyzed reactions, the reactants are known as substrates, and the catalysts are naturally occurring macromolecular substances known as enzymes. Enzymes possess specific binding sites for substrates, and are usually composed wholly or largely of protein, but RNA that has catalytic activity (ribozyme) is often also regarded as enzymatic.
transferase activity
Catalysis of the transfer of a group, e.g. a methyl group, glycosyl group, acyl group, phosphorus-containing, or other groups, from one compound (generally regarded as the donor) to another compound (generally regarded as the acceptor). Transferase is the systematic name for any enzyme of EC class 2.
transferase activity, transferring phosphorus-containing groups
Catalysis of the transfer of a phosphorus-containing group from one compound (donor) to another (acceptor).
nucleotidyltransferase activity
Catalysis of the transfer of a nucleotidyl group to a reactant.
adenylyltransferase activity
Catalysis of the transfer of an adenylyl group to an acceptor.
all
NA
Help |
Hide |
Top
Help |
Show |
Top
GO BP test for over-representation
HELP
List of all enriched GO categories (biological processes), at the 0.05
p-value level.
The columns:
- ExpCount is the expected count of genes in the
module annotated with the given GO term, just by chance.
- Count
is the number of genes in the module annotated with the given GO
term.
- Size is the total number of genes (in our universe)
annotated with the GO term.
Clicking on Count shows the genes that drive the
enrichment. You can also click on the individual numbers in
the Count column, to show the driving genes for that individual
GO category.
Clicking on the GO identifiers takes you to the Gene Ontology web
pages.
— Click on the Help button again to close this help window.
| Id | Pvalue | ExpCount | Count | Size | Term |
| GO:0007033 | 1.602e-02 | 0.3679 | 4
AKTIP, ATG12, CLN8, HOOK3 | 39 | vacuole organization |
| GO:0007040 | 2.955e-02 | 0.2075 | 3
AKTIP, CLN8, HOOK3 | 22 | lysosome organization |
| GO:0016197 | 3.943e-02 | 0.5094 | 4
AKTIP, HOOK3, SNX17, VPS35 | 54 | endosome transport |
Help |
Hide |
Top
Help |
Show |
Top
GO CC test for over-representation
HELP
List of all enriched GO categories (cellular components), at the 0.05
p-value level.
The columns:
- ExpCount is the expected count of genes in the
module annotated with the given GO term, just by chance.
- Count
is the number of genes in the module annotated with the given GO
term.
- Size is the total number of genes (in our universe)
annotated with the GO term.
Clicking on Count shows the genes that drive the
enrichment. You can also click on the individual numbers in
the Count column, to show the driving genes for that individual
GO category.
Clicking on the GO identifiers takes you to the Gene Ontology web
pages.
— Click on the Help button again to close this help window.
| Id | Pvalue | ExpCount | Count | Size | Term |
| GO:0070695 | 1.132e-02 | 0.04591 | 2
AKTIP, HOOK3 | 5 | FHF complex |
Help |
Hide |
Top
Help |
Show |
Top
GO MF test for over-representation
HELP
List of all enriched GO categories (molecular function), at the 0.05
p-value level.
The columns:
- ExpCount is the expected count of genes in the
module annotated with the given GO term, just by chance.
- Count
is the number of genes in the module annotated with the given GO
term.
- Size is the total number of genes (in our universe)
annotated with the GO term.
Clicking on Count shows the genes that drive the
enrichment. You can also click on the individual numbers in
the Count column, to show the driving genes for that individual
GO category.
Clicking on the GO identifiers takes you to the Gene Ontology web
pages.
— Click on the Help button again to close this help window.
| Id | Pvalue | ExpCount | Count | Size | Term |
| GO:0070566 | 8.080e-03 | 0.1292 | 3
COASY, PAPOLG, TRNT1 | 14 | adenylyltransferase activity |
| GO:0008135 | 3.194e-02 | 0.4984 | 4
EEF1G, EEF2, EIF3K, EIF4E | 54 | translation factor activity, nucleic acid binding |
| GO:0016779 | 4.217e-02 | 0.9137 | 5
COASY, PAPOLG, POLR2L, TRNT1, TUT1 | 99 | nucleotidyltransferase activity |
Help |
Hide |
Top
Help |
Show |
Top
KEGG Pathway test for over-representation
HELP
List of all enriched KEGG pathways, at the 0.05
p-value level.
The columns:
- ExpCount is the expected count of genes in the
module annotated with the given KEGG pathway, just by chance.
- Count
is the number of genes in the module annotated with the given KEGG
pathway.
- Size is the total number of genes (in our universe)
annotated with the KEGG pathway.
Clicking on Count shows the genes that drive the
enrichment. You can also click on the individual numbers in
the Count column, to show the driving genes for that individual
KEGG pathway.
Clicking on the KEGG identifiers takes you to the KEGG web site.
— Click on the Help button again to close this help window.
Help |
Hide |
Top
Help |
Show |
Top
miRNA test for over-representation
HELP
List of all enriched miRNA families, at the 0.05
p-value level.
The columns:
- ExpCount is the expected count of genes in the
module regulated by the given miRNA family, just by chance.
- Count
is the number of genes in the module regulated by the given miRNA
family.
- Size is the total number of genes (in our universe)
regulated with the given miRNA family.
Clicking on Count shows the genes that drive the
enrichment. You can also click on the individual numbers in
the Count column, to show the driving genes for that individual
miRNA family.
The miRNA regulation data was taken from the TargetScan database.
(Only the conserved sites were used for the current analysis.)
Clicking on the miRNA names takes you to the TargetScan web site.
— Click on the Help button again to close this help window.
Help |
Hide |
Top
Help |
Show |
Top
Chromosome test for over-representation
HELP
List of all enriched Chromosomes, at the 0.05
p-value level.
The columns:
- ExpCount is the expected number of genes in the
module on the given chromosome, just by chance.
- Count
is the number of genes in the module on the given chromosome.
- Size is the total number of genes (in our universe)
on the given chromosome.
Clicking on Count shows the genes that drive the
enrichment. You can also click on the individual numbers in
the Count column, to show the driving genes for that individual
chromosome.
— Click on the Help button again to close this help window.
HELP
A list of all genes in the current module, in alphabetical order. The
size of the text corresponds to the gene scores.
Text color indicates correlation and anti-correlation: genes of the
same color are correlated, both move up or down in the module samples
(listed below). Genes of different color are anti-correlated, they
have opposite behavior in the module samples.
Note, that text color of the individual genes should be interpreted
together with the coloring of the samples below. For
red samples,
red genes have a higher expression
(compared to the average gene expression level),
green genes have a lower
expression.
Green samples have opposite
behavior, in these red genes have a
lower expression, green genes
have a higher expression.
Note that some gene symbols may show up more than once, if many
probes match the same Entrez gene.
Genes with no Entrez mapping are given separately, with their
Affymetrics probe ID.
— Click on the Help button again to close this help window.
Entrez genes
ACAD9acyl-CoA dehydrogenase family, member 9 (ENSG00000177646), score: 0.68
ACAP2ArfGAP with coiled-coil, ankyrin repeat and PH domains 2 (ENSG00000114331), score: -0.7
ACOT8acyl-CoA thioesterase 8 (ENSG00000101473), score: 0.7
AGXT2L2alanine-glyoxylate aminotransferase 2-like 2 (ENSG00000175309), score: 0.68
AIDAaxin interactor, dorsalization associated (ENSG00000186063), score: -0.75
AKTIPAKT interacting protein (ENSG00000166971), score: -0.7
APEHN-acylaminoacyl-peptide hydrolase (ENSG00000164062), score: 0.68
ATG10ATG10 autophagy related 10 homolog (S. cerevisiae) (ENSG00000152348), score: 0.82
ATG12ATG12 autophagy related 12 homolog (S. cerevisiae) (ENSG00000145782), score: -0.73
BAT5HLA-B associated transcript 5 (ENSG00000204422), score: 0.96
BDP1B double prime 1, subunit of RNA polymerase III transcription initiation factor IIIB (ENSG00000145734), score: -0.7
C12orf4chromosome 12 open reading frame 4 (ENSG00000047621), score: -0.78
C14orf80chromosome 14 open reading frame 80 (ENSG00000185347), score: 0.81
C1orf186chromosome 1 open reading frame 186 (ENSG00000196533), score: 0.71
C2orf49chromosome 2 open reading frame 49 (ENSG00000135974), score: -0.78
C2orf79chromosome 2 open reading frame 79 (ENSG00000184924), score: 0.71
C3orf16chromosome 3 open reading frame 16 (ENSG00000206199), score: 0.7
C5orf15chromosome 5 open reading frame 15 (ENSG00000113583), score: 0.75
C5orf41chromosome 5 open reading frame 41 (ENSG00000164463), score: -0.78
C5orf45chromosome 5 open reading frame 45 (ENSG00000161010), score: 0.83
C6orf162chromosome 6 open reading frame 162 (ENSG00000111850), score: -0.71
CCNT2cyclin T2 (ENSG00000082258), score: -0.79
CD72CD72 molecule (ENSG00000137101), score: 0.8
CDC26cell division cycle 26 homolog (S. cerevisiae) (ENSG00000176386), score: -0.71
CDC27cell division cycle 27 homolog (S. cerevisiae) (ENSG00000004897), score: -0.71
CECR5cat eye syndrome chromosome region, candidate 5 (ENSG00000069998), score: 0.83
CIITAclass II, major histocompatibility complex, transactivator (ENSG00000179583), score: 0.83
CITED4Cbp/p300-interacting transactivator, with Glu/Asp-rich carboxy-terminal domain, 4 (ENSG00000179862), score: 0.78
CLN8ceroid-lipofuscinosis, neuronal 8 (epilepsy, progressive with mental retardation) (ENSG00000182372), score: 0.71
COASYCoA synthase (ENSG00000068120), score: 0.71
COMMD2COMM domain containing 2 (ENSG00000114744), score: -0.83
COQ4coenzyme Q4 homolog (S. cerevisiae) (ENSG00000167113), score: 0.73
CRBNcereblon (ENSG00000113851), score: -0.73
CRIPTcysteine-rich PDZ-binding protein (ENSG00000119878), score: -0.73
CYB561D2cytochrome b-561 domain containing 2 (ENSG00000114395), score: 0.68
CYP4B1cytochrome P450, family 4, subfamily B, polypeptide 1 (ENSG00000142973), score: 0.71
DLEC1deleted in lung and esophageal cancer 1 (ENSG00000008226), score: 0.86
EEF1Geukaryotic translation elongation factor 1 gamma (ENSG00000149016), score: 0.99
EEF2eukaryotic translation elongation factor 2 (ENSG00000167658), score: 0.77
EIF3Keukaryotic translation initiation factor 3, subunit K (ENSG00000178982), score: 0.83
ELAC2elaC homolog 2 (E. coli) (ENSG00000006744), score: 0.96
ERCC6excision repair cross-complementing rodent repair deficiency, complementation group 6 (ENSG00000225830), score: -0.73
EXOC1exocyst complex component 1 (ENSG00000090989), score: -0.72
FAM103A1family with sequence similarity 103, member A1 (ENSG00000169612), score: -0.82
FAM119Afamily with sequence similarity 119, member A (ENSG00000144401), score: -0.7
FAM156Afamily with sequence similarity 156, member A (ENSG00000182646), score: -0.82
FRA10AC1fragile site, folic acid type, rare, fra(10)(q23.3) or fra(10)(q24.2) candidate 1 (ENSG00000148690), score: -0.71
GPS1G protein pathway suppressor 1 (ENSG00000169727), score: 0.73
GRWD1glutamate-rich WD repeat containing 1 (ENSG00000105447), score: 0.73
GUK1guanylate kinase 1 (ENSG00000143774), score: 0.77
HOOK3hook homolog 3 (Drosophila) (ENSG00000168172), score: -0.71
HTRA2HtrA serine peptidase 2 (ENSG00000115317), score: 0.69
IL9Rinterleukin 9 receptor (ENSG00000124334), score: 0.92
INMTindolethylamine N-methyltransferase (ENSG00000106125), score: 0.83
INTS2integrator complex subunit 2 (ENSG00000108506), score: -0.72
ITGB3BPintegrin beta 3 binding protein (beta3-endonexin) (ENSG00000142856), score: 0.7
LCN12lipocalin 12 (ENSG00000184925), score: 0.76
LGALS3BPlectin, galactoside-binding, soluble, 3 binding protein (ENSG00000108679), score: 0.77
LOC100131693eukaryotic translation initiation factor 4E pseudogene (ENSG00000151247), score: -0.7
LOC100133770hypothetical protein LOC100133770 (ENSG00000069329), score: -0.76
LOC731605similar to Bcl-2-associated transcription factor 1 (Btf) (ENSG00000029363), score: -0.82
MAN2B2mannosidase, alpha, class 2B, member 2 (ENSG00000013288), score: 0.7
METTL6methyltransferase like 6 (ENSG00000206562), score: -0.72
MIFmacrophage migration inhibitory factor (glycosylation-inhibiting factor) (ENSG00000133460), score: 0.86
MMABmethylmalonic aciduria (cobalamin deficiency) cblB type (ENSG00000139428), score: 0.72
MYL5myosin, light chain 5, regulatory (ENSG00000215375), score: 0.88
NDOR1NADPH dependent diflavin oxidoreductase 1 (ENSG00000188566), score: 0.7
NOL8nucleolar protein 8 (ENSG00000198000), score: -0.72
NPBneuropeptide B (ENSG00000183979), score: 0.83
NPRL3nitrogen permease regulator-like 3 (S. cerevisiae) (ENSG00000103148), score: 0.73
ODF2Louter dense fiber of sperm tails 2-like (ENSG00000122417), score: -0.79
OTUD6BOTU domain containing 6B (ENSG00000155100), score: -0.72
PABPC1Lpoly(A) binding protein, cytoplasmic 1-like (ENSG00000101104), score: 0.82
PAPOLGpoly(A) polymerase gamma (ENSG00000115421), score: -0.71
PEX10peroxisomal biogenesis factor 10 (ENSG00000157911), score: 0.75
PHF14PHD finger protein 14 (ENSG00000106443), score: -0.74
PIGCphosphatidylinositol glycan anchor biosynthesis, class C (ENSG00000135845), score: -0.73
PIGTphosphatidylinositol glycan anchor biosynthesis, class T (ENSG00000124155), score: 0.78
PLEKHJ1pleckstrin homology domain containing, family J member 1 (ENSG00000104886), score: 0.78
POLR2Lpolymerase (RNA) II (DNA directed) polypeptide L, 7.6kDa (ENSG00000177700), score: 0.68
POMGNT1protein O-linked mannose beta1,2-N-acetylglucosaminyltransferase (ENSG00000085998), score: 0.77
PRICKLE4prickle homolog 4 (Drosophila) (ENSG00000124593), score: 0.73
PRPF39PRP39 pre-mRNA processing factor 39 homolog (S. cerevisiae) (ENSG00000185246), score: -0.71
PSAPprosaposin (ENSG00000197746), score: 0.7
PSMD9proteasome (prosome, macropain) 26S subunit, non-ATPase, 9 (ENSG00000110801), score: 0.73
RAB11BRAB11B, member RAS oncogene family (ENSG00000185236), score: 0.71
RBM8ARNA binding motif protein 8A (ENSG00000131795), score: -0.82
RNF145ring finger protein 145 (ENSG00000145860), score: -0.7
RSPO1R-spondin homolog (Xenopus laevis) (ENSG00000169218), score: 0.82
SCNN1Dsodium channel, nonvoltage-gated 1, delta (ENSG00000162572), score: 0.69
SCRIBscribbled homolog (Drosophila) (ENSG00000180900), score: 0.69
SFRS12splicing factor, arginine/serine-rich 12 (ENSG00000153914), score: -0.75
SIVA1SIVA1, apoptosis-inducing factor (ENSG00000184990), score: 0.75
SLA2Src-like-adaptor 2 (ENSG00000101082), score: 0.71
SLC18A2solute carrier family 18 (vesicular monoamine), member 2 (ENSG00000165646), score: 0.84
SLC19A1solute carrier family 19 (folate transporter), member 1 (ENSG00000173638), score: 1
SNX13sorting nexin 13 (ENSG00000071189), score: -0.76
SNX17sorting nexin 17 (ENSG00000115234), score: 0.69
SNX22sorting nexin 22 (ENSG00000157734), score: 0.96
SR140U2-associated SR140 protein (ENSG00000163714), score: -0.71
SURF6surfeit 6 (ENSG00000148296), score: 0.7
TBC1D8TBC1 domain family, member 8 (with GRAM domain) (ENSG00000204634), score: 0.81
TH1LTH1-like (Drosophila) (ENSG00000101158), score: 0.85
THUMPD1THUMP domain containing 1 (ENSG00000066654), score: -0.81
TIMM10translocase of inner mitochondrial membrane 10 homolog (yeast) (ENSG00000134809), score: 0.72
TMEM115transmembrane protein 115 (ENSG00000126062), score: 0.71
TMEM199transmembrane protein 199 (ENSG00000244045), score: -0.7
TMEM79transmembrane protein 79 (ENSG00000163472), score: 0.91
TMEM85transmembrane protein 85 (ENSG00000128463), score: 0.69
TRAP1TNF receptor-associated protein 1 (ENSG00000126602), score: 0.71
TRIM69tripartite motif-containing 69 (ENSG00000185880), score: 0.75
TRIP6thyroid hormone receptor interactor 6 (ENSG00000087077), score: 0.86
TRNT1tRNA nucleotidyl transferase, CCA-adding, 1 (ENSG00000072756), score: -0.77
TSPAN16tetraspanin 16 (ENSG00000130167), score: 0.83
UTS2urotensin 2 (ENSG00000049247), score: 0.7
WDR13WD repeat domain 13 (ENSG00000101940), score: 0.76
ZC3H6zinc finger CCCH-type containing 6 (ENSG00000188177), score: -0.8
ZNF23zinc finger protein 23 (KOX 16) (ENSG00000167377), score: -0.7
ZNF248zinc finger protein 248 (ENSG00000198105), score: -0.73
ZNF292zinc finger protein 292 (ENSG00000188994), score: -0.73
ZNF518Bzinc finger protein 518B (ENSG00000178163), score: -0.72
ZNF599zinc finger protein 599 (ENSG00000153896), score: 0.71
Non-Entrez genes
ENSG00000196533Unknown, score: -0.94
ENSG00000167377Unknown, score: 0.71
HELP
Conditions in the module, given in the same order as on the expression
plot above. Red color means over-expression, green under-expression in
the given condition.
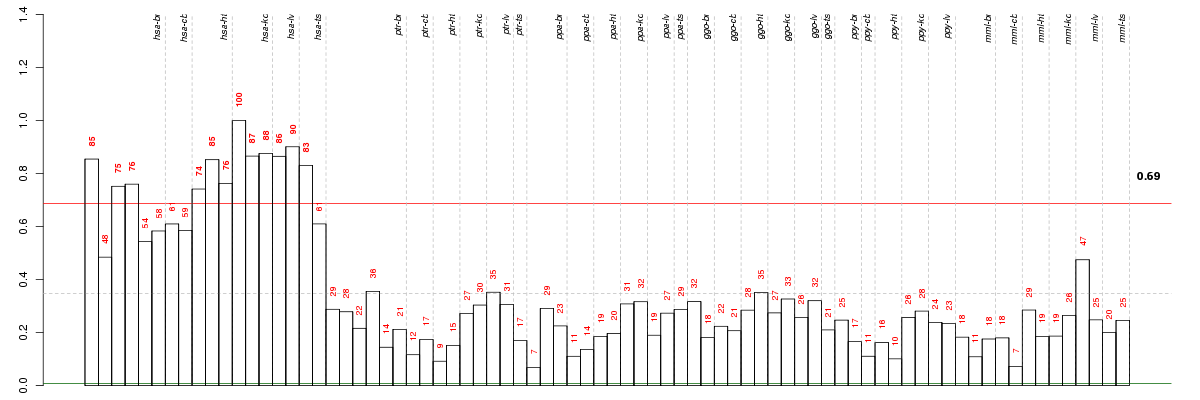
The barplot below shows the condition (sample) scores. A separate bar
is shown for each sample, its height is the corresponding score of the
sample in the module. The red and green numbers on the bars are the
sample scores expressed in percents, i.e. 100% is 1.0.
The height of each bar corresponds to the weighted
mean expression of the module genes. The weights are the gene scores
of the module and they are positive for the genes listed in
red above and they are negative for
the genes that are listed in
green.
Bars going up correspond to samples listed in
red (the ones that are different
enough to included in the module). In these samples
the red module genes are highly
expressed, and the green
module genes are lowly expressed. The behavior of the genes is the
opposite for bars going down.
The red and green lines show the module thresholds, samples above
the red line and below the green line are included in the module.
The different species and tissues that were part of the study, are separated
by dashed vertical lines.
— Click on the Help button again to close this help window.
| Id | species | tissue | sex | individual |
| hsa_ht_m2_ca1 | hsa | ht | m | 2 |
| hsa_br_m3_ca1 | hsa | br | m | 3 |
| hsa_br_m6_ca1 | hsa | br | m | 6 |
| hsa_ht_f_ca1 | hsa | ht | f | _ |
| hsa_ts_m1_ca1 | hsa | ts | m | 1 |
| hsa_ht_m1_ca1 | hsa | ht | m | 1 |
| hsa_br_m7_ca1 | hsa | br | m | 7 |
| hsa_lv_m1_ca1 | hsa | lv | m | 1 |
| hsa_kd_m2_ca1 | hsa | kd | m | 2 |
| hsa_kd_f_ca1 | hsa | kd | f | _ |
| hsa_lv_m2_ca1 | hsa | lv | m | 2 |
| hsa_kd_m1_ca1 | hsa | kd | m | 1 |


© 2008-2010 Computational Biology Group, Department of Medical Genetics,
University of Lausanne, Switzerland