Previous module |
Next module
Module #506, TG: 2, TC: 2, 137 probes, 137 Entrez genes, 8 conditions


HELP
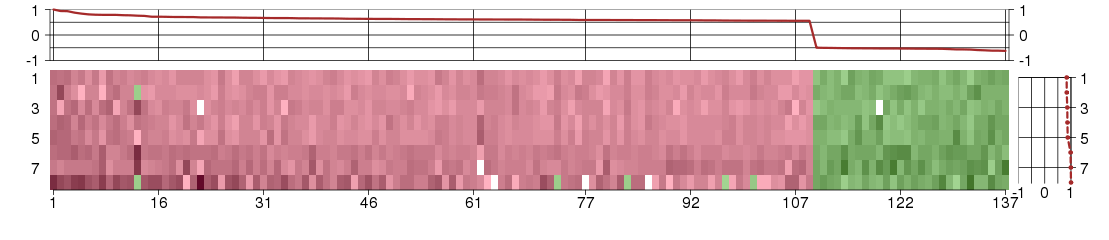
The image plot shows the color-coded level of gene expression, for the
genes and conditions in a given transcription module. The genes are on
the horizontal, the conditions on the vertical axis.
The genes are ordered according to their ISA gene scores, similarly
the conditions are ordered according to their condition scores. The
score of a gene means the «degree of inclusion» in
the module: a high score gene is essential in the module.
Condition scores can also be negative, that means that the genes of
the module are all down-regulated in the condition. Here the absolute
value of the score gives the «degree of inclusion».
The plots above and beside the expression matrix show the gene scores
and condition scores, respectively.
Note that the plot is interactive, you can see the name of the gene
and condition under the mouse cursor.
The expression matrix was normalized to have mean zero and standard
deviation one for every gene separately across all conditions
(i.e. not just for the conditions in the module).
— Click on the Help button again to close this help window.

Under-expression is coded with green,
over-expression with red color.
Help |
Hide |
Top
Help |
Show |
Top
The GO tree — Biological processes
HELP
This is one of three sections showing Gene Ontology enrichment of the
current module: in this case for biological processes.
The graph shows the hierarchy of the GO categories, their enrichment
for the current module is color coded, and the blue number beside the
category is the minus log ten p-value of the enrichment. (Calculated
using the standard hypergeometric test.) The color of the arrows code
«is a» (cyan) and «part of» relationships.
The tree was built the following way. First all GO terms with more
significant enrichment p-value than 0.05 were collected. Then all
paths from these terms to the root node of the GO tree were included
too. If a GO term is included more than once in the tree, then the
green numbers show 1) the id of the node, this makes it easier to find
other appereances of the term, and 2) the number of appearences.
Note that the same GO category might show up on the graph many
times. This is because the GO was «straightened» for this
graph, i.e. if there are more paths from a GO term to the root node of
the tree, all of them are included. The green numbers
Move the mouse cursor over the terms to get their definition. Clicking
on them takes you to the corresponding Gene Ontology web page.
If you cannot see a graph here at all, that means that there were no
significantly enriched GO categories, at the 0.05 level.
— Click on the Help button again to close this help window.
Help |
Hide |
Top
Help |
Show |
Top
The GO tree — Cellular Components
HELP
This is one of three sections showing Gene Ontology enrichment of the
current module: in this case for cellular components.
The graph shows the hierarchy of the GO categories, their enrichment
for the current module is color coded, and the blue number beside the
category is the minus log ten p-value of the enrichment. (Calculated
using the standard hypergeometric test.) The color of the arrows code
«is a» (cyan) and «part of» relationships.
The tree was built the following way. First all GO terms with more
significant enrichment p-value than 0.05 were collected. Then all
paths from these terms to the root node of the GO tree were included
too. If a GO term is included more than once in the tree, then the
green numbers show 1) the id of the node, this makes it easier to find
other appereances of the term, and 2) the number of appearences.
Note that the same GO category might show up on the graph many
times. This is because the GO was «straightened» for this
graph, i.e. if there are more paths from a GO term to the root node of
the tree, all of them are included. The green numbers
Move the mouse cursor over the terms to get their definition. Clicking
on them takes you to the corresponding Gene Ontology web page.
If you cannot see a graph here at all, that means that there were no
significantly enriched GO categories, at the 0.05 level.
— Click on the Help button again to close this help window.
cellular_component
The part of a cell or its extracellular environment in which a gene product is located. A gene product may be located in one or more parts of a cell and its location may be as specific as a particular macromolecular complex, that is, a stable, persistent association of macromolecules that function together.
cell
The basic structural and functional unit of all organisms. Includes the plasma membrane and any external encapsulating structures such as the cell wall and cell envelope.
myelin sheath
An electrically insulating fatty layer that surrounds the axons of many neurons. It is an outgrowth of glial cells: Schwann cells supply the myelin for peripheral neurons while oligodendrocytes supply it to those of the central nervous system.
cell part
Any constituent part of a cell, the basic structural and functional unit of all organisms.
all
NA
cell part
Any constituent part of a cell, the basic structural and functional unit of all organisms.
Help |
Hide |
Top
Help |
Show |
Top
The GO tree — Molecular Function
HELP
This is one of three sections showing Gene Ontology enrichment of the
current module: in this case for molecular function.
The graph shows the hierarchy of the GO categories, their enrichment
for the current module is color coded, and the blue number beside the
category is the minus log ten p-value of the enrichment. (Calculated
using the standard hypergeometric test.) The color of the arrows code
«is a» (cyan) and «part of» relationships.
The tree was built the following way. First all GO terms with more
significant enrichment p-value than 0.05 were collected. Then all
paths from these terms to the root node of the GO tree were included
too. If a GO term is included more than once in the tree, then the
green numbers show 1) the id of the node, this makes it easier to find
other appereances of the term, and 2) the number of appearences.
Note that the same GO category might show up on the graph many
times. This is because the GO was «straightened» for this
graph, i.e. if there are more paths from a GO term to the root node of
the tree, all of them are included. The green numbers
Move the mouse cursor over the terms to get their definition. Clicking
on them takes you to the corresponding Gene Ontology web page.
If you cannot see a graph here at all, that means that there were no
significantly enriched GO categories, at the 0.05 level.
— Click on the Help button again to close this help window.
Help |
Hide |
Top
Help |
Show |
Top
GO BP test for over-representation
HELP
List of all enriched GO categories (biological processes), at the 0.05
p-value level.
The columns:
- ExpCount is the expected count of genes in the
module annotated with the given GO term, just by chance.
- Count
is the number of genes in the module annotated with the given GO
term.
- Size is the total number of genes (in our universe)
annotated with the GO term.
Clicking on Count shows the genes that drive the
enrichment. You can also click on the individual numbers in
the Count column, to show the driving genes for that individual
GO category.
Clicking on the GO identifiers takes you to the Gene Ontology web
pages.
— Click on the Help button again to close this help window.
| Id | Pvalue | ExpCount | Count | Size | Term |
| GO:0000160 | 2.852e-02 | 0.04709 | 2
KCNH8, PDE8B | 2 | two-component signal transduction system (phosphorelay) |
Help |
Hide |
Top
Help |
Show |
Top
GO CC test for over-representation
HELP
List of all enriched GO categories (cellular components), at the 0.05
p-value level.
The columns:
- ExpCount is the expected count of genes in the
module annotated with the given GO term, just by chance.
- Count
is the number of genes in the module annotated with the given GO
term.
- Size is the total number of genes (in our universe)
annotated with the GO term.
Clicking on Count shows the genes that drive the
enrichment. You can also click on the individual numbers in
the Count column, to show the driving genes for that individual
GO category.
Clicking on the GO identifiers takes you to the Gene Ontology web
pages.
— Click on the Help button again to close this help window.
| Id | Pvalue | ExpCount | Count | Size | Term |
| GO:0043209 | 6.920e-03 | 0.1514 | 3
CNTN2, ERMN, PLP1 | 6 | myelin sheath |
Help |
Hide |
Top
Help |
Show |
Top
GO MF test for over-representation
HELP
List of all enriched GO categories (molecular function), at the 0.05
p-value level.
The columns:
- ExpCount is the expected count of genes in the
module annotated with the given GO term, just by chance.
- Count
is the number of genes in the module annotated with the given GO
term.
- Size is the total number of genes (in our universe)
annotated with the GO term.
Clicking on Count shows the genes that drive the
enrichment. You can also click on the individual numbers in
the Count column, to show the driving genes for that individual
GO category.
Clicking on the GO identifiers takes you to the Gene Ontology web
pages.
— Click on the Help button again to close this help window.
| Id | Pvalue | ExpCount | Count | Size | Term |
| GO:0008289 | 2.291e-02 | 3.403 | 11
EPB41, FNBP1L, HIP1R, MAP3K1, PHLDA3, PMP2, PREX1, RASAL1, RBP3, STARD3, STOML1 | 153 | lipid binding |
Help |
Hide |
Top
Help |
Show |
Top
KEGG Pathway test for over-representation
HELP
List of all enriched KEGG pathways, at the 0.05
p-value level.
The columns:
- ExpCount is the expected count of genes in the
module annotated with the given KEGG pathway, just by chance.
- Count
is the number of genes in the module annotated with the given KEGG
pathway.
- Size is the total number of genes (in our universe)
annotated with the KEGG pathway.
Clicking on Count shows the genes that drive the
enrichment. You can also click on the individual numbers in
the Count column, to show the driving genes for that individual
KEGG pathway.
Clicking on the KEGG identifiers takes you to the KEGG web site.
— Click on the Help button again to close this help window.
Help |
Hide |
Top
Help |
Show |
Top
miRNA test for over-representation
HELP
List of all enriched miRNA families, at the 0.05
p-value level.
The columns:
- ExpCount is the expected count of genes in the
module regulated by the given miRNA family, just by chance.
- Count
is the number of genes in the module regulated by the given miRNA
family.
- Size is the total number of genes (in our universe)
regulated with the given miRNA family.
Clicking on Count shows the genes that drive the
enrichment. You can also click on the individual numbers in
the Count column, to show the driving genes for that individual
miRNA family.
The miRNA regulation data was taken from the TargetScan database.
(Only the conserved sites were used for the current analysis.)
Clicking on the miRNA names takes you to the TargetScan web site.
— Click on the Help button again to close this help window.
Help |
Hide |
Top
Help |
Show |
Top
Chromosome test for over-representation
HELP
List of all enriched Chromosomes, at the 0.05
p-value level.
The columns:
- ExpCount is the expected number of genes in the
module on the given chromosome, just by chance.
- Count
is the number of genes in the module on the given chromosome.
- Size is the total number of genes (in our universe)
on the given chromosome.
Clicking on Count shows the genes that drive the
enrichment. You can also click on the individual numbers in
the Count column, to show the driving genes for that individual
chromosome.
— Click on the Help button again to close this help window.
HELP
A list of all genes in the current module, in alphabetical order. The
size of the text corresponds to the gene scores.
Text color indicates correlation and anti-correlation: genes of the
same color are correlated, both move up or down in the module samples
(listed below). Genes of different color are anti-correlated, they
have opposite behavior in the module samples.
Note, that text color of the individual genes should be interpreted
together with the coloring of the samples below. For
red samples,
red genes have a higher expression
(compared to the average gene expression level),
green genes have a lower
expression.
Green samples have opposite
behavior, in these red genes have a
lower expression, green genes
have a higher expression.
Note that some gene symbols may show up more than once, if many
probes match the same Entrez gene.
Genes with no Entrez mapping are given separately, with their
Affymetrics probe ID.
— Click on the Help button again to close this help window.
Entrez genes
ABHD12abhydrolase domain containing 12 (ENSG00000100997), score: 0.56
ADAMTS14ADAM metallopeptidase with thrombospondin type 1 motif, 14 (ENSG00000138316), score: 0.94
ADAMTS8ADAM metallopeptidase with thrombospondin type 1 motif, 8 (ENSG00000134917), score: 0.56
ANKRD24ankyrin repeat domain 24 (ENSG00000089847), score: 0.58
ANO4anoctamin 4 (ENSG00000151572), score: 0.61
ARHGAP22Rho GTPase activating protein 22 (ENSG00000128805), score: 0.67
ATL2atlastin GTPase 2 (ENSG00000119787), score: -0.57
ATP13A2ATPase type 13A2 (ENSG00000159363), score: 0.57
BCAS1breast carcinoma amplified sequence 1 (ENSG00000064787), score: 0.63
C1orf128chromosome 1 open reading frame 128 (ENSG00000057757), score: 0.63
C22orf9chromosome 22 open reading frame 9 (ENSG00000100364), score: 0.8
C8orf46chromosome 8 open reading frame 46 (ENSG00000169085), score: 0.65
C9orf16chromosome 9 open reading frame 16 (ENSG00000171159), score: 0.57
CALHM1calcium homeostasis modulator 1 (ENSG00000185933), score: 0.76
CAPN9calpain 9 (ENSG00000135773), score: 0.84
CCDC50coiled-coil domain containing 50 (ENSG00000152492), score: -0.52
CCM2cerebral cavernous malformation 2 (ENSG00000136280), score: 0.62
CD2APCD2-associated protein (ENSG00000198087), score: -0.51
CERCAMcerebral endothelial cell adhesion molecule (ENSG00000167123), score: 0.79
CLDND1claudin domain containing 1 (ENSG00000080822), score: 0.88
CNTN2contactin 2 (axonal) (ENSG00000184144), score: 0.62
CPNE2copine II (ENSG00000140848), score: 0.62
CSRP1cysteine and glycine-rich protein 1 (ENSG00000159176), score: 0.58
DAAM2dishevelled associated activator of morphogenesis 2 (ENSG00000146122), score: 0.78
DGKZdiacylglycerol kinase, zeta 104kDa (ENSG00000149091), score: 0.56
DLX1distal-less homeobox 1 (ENSG00000144355), score: 0.57
DNAJC7DnaJ (Hsp40) homolog, subfamily C, member 7 (ENSG00000168259), score: 0.61
DNMBPdynamin binding protein (ENSG00000107554), score: -0.53
DSCAML1Down syndrome cell adhesion molecule like 1 (ENSG00000177103), score: 0.6
ELOVL1elongation of very long chain fatty acids (FEN1/Elo2, SUR4/Elo3, yeast)-like 1 (ENSG00000066322), score: 0.63
EPB41erythrocyte membrane protein band 4.1 (elliptocytosis 1, RH-linked) (ENSG00000159023), score: -0.51
EPHB6EPH receptor B6 (ENSG00000106123), score: 0.61
ERMNermin, ERM-like protein (ENSG00000136541), score: 0.66
EVI2Aecotropic viral integration site 2A (ENSG00000126860), score: 0.75
EXOC7exocyst complex component 7 (ENSG00000182473), score: 0.58
FA2Hfatty acid 2-hydroxylase (ENSG00000103089), score: 0.68
FAM102Afamily with sequence similarity 102, member A (ENSG00000167106), score: 0.69
FAM124Afamily with sequence similarity 124A (ENSG00000150510), score: 0.69
FAM171A1family with sequence similarity 171, member A1 (ENSG00000148468), score: 0.58
FAM69Cfamily with sequence similarity 69, member C (ENSG00000187773), score: 0.65
FBLN7fibulin 7 (ENSG00000144152), score: 0.56
FBXO2F-box protein 2 (ENSG00000116661), score: 0.56
FEZF2FEZ family zinc finger 2 (ENSG00000153266), score: 0.69
FGF22fibroblast growth factor 22 (ENSG00000070388), score: 0.67
FNBP1Lformin binding protein 1-like (ENSG00000137942), score: -0.54
FNDC3Bfibronectin type III domain containing 3B (ENSG00000075420), score: -0.54
FOXG1forkhead box G1 (ENSG00000176165), score: 0.61
GJD4gap junction protein, delta 4, 40.1kDa (ENSG00000177291), score: 0.7
GLDNgliomedin (ENSG00000186417), score: 0.94
GOLGA4golgin A4 (ENSG00000144674), score: -0.53
GPR123G protein-coupled receptor 123 (ENSG00000197177), score: 0.65
GRID1glutamate receptor, ionotropic, delta 1 (ENSG00000182771), score: 0.62
GRM3glutamate receptor, metabotropic 3 (ENSG00000198822), score: 0.61
IDEinsulin-degrading enzyme (ENSG00000119912), score: -0.54
ITPK1inositol 1,3,4-triphosphate 5/6 kinase (ENSG00000100605), score: 0.62
JAM3junctional adhesion molecule 3 (ENSG00000166086), score: 0.65
KCNF1potassium voltage-gated channel, subfamily F, member 1 (ENSG00000162975), score: 0.68
KCNH8potassium voltage-gated channel, subfamily H (eag-related), member 8 (ENSG00000183960), score: 1
KCNMB4potassium large conductance calcium-activated channel, subfamily M, beta member 4 (ENSG00000135643), score: 0.63
KCNQ5potassium voltage-gated channel, KQT-like subfamily, member 5 (ENSG00000185760), score: 0.59
KCNS1potassium voltage-gated channel, delayed-rectifier, subfamily S, member 1 (ENSG00000124134), score: 0.6
KIAA0020KIAA0020 (ENSG00000080608), score: -0.59
KIAA1598KIAA1598 (ENSG00000187164), score: 0.59
LAPTM4Alysosomal protein transmembrane 4 alpha (ENSG00000068697), score: -0.57
LIMK1LIM domain kinase 1 (ENSG00000106683), score: 0.61
LMO4LIM domain only 4 (ENSG00000143013), score: 0.58
LNX2ligand of numb-protein X 2 (ENSG00000139517), score: -0.61
LOC100294412similar to KIAA0655 protein (ENSG00000130787), score: 0.67
LPPR3lipid phosphate phosphatase-related protein type 3 (ENSG00000129951), score: 0.58
LYSMD3LysM, putative peptidoglycan-binding, domain containing 3 (ENSG00000176018), score: -0.5
MAP3K1mitogen-activated protein kinase kinase kinase 1 (ENSG00000095015), score: -0.55
MATKmegakaryocyte-associated tyrosine kinase (ENSG00000007264), score: 0.59
MATN1matrilin 1, cartilage matrix protein (ENSG00000162510), score: 0.66
MIPEPmitochondrial intermediate peptidase (ENSG00000027001), score: -0.52
MMAAmethylmalonic aciduria (cobalamin deficiency) cblA type (ENSG00000151611), score: -0.54
MYO9Bmyosin IXB (ENSG00000099331), score: 0.6
NDPNorrie disease (pseudoglioma) (ENSG00000124479), score: 0.58
NINJ2ninjurin 2 (ENSG00000171840), score: 0.6
NIPA1non imprinted in Prader-Willi/Angelman syndrome 1 (ENSG00000170113), score: 0.65
NIPAL4NIPA-like domain containing 4 (ENSG00000172548), score: 0.72
PACS2phosphofurin acidic cluster sorting protein 2 (ENSG00000179364), score: 0.58
PDE6Bphosphodiesterase 6B, cGMP-specific, rod, beta (ENSG00000133256), score: 0.66
PDE8Bphosphodiesterase 8B (ENSG00000113231), score: 0.56
PEX13peroxisomal biogenesis factor 13 (ENSG00000162928), score: -0.62
PHLDA3pleckstrin homology-like domain, family A, member 3 (ENSG00000174307), score: 0.61
PIP4K2Aphosphatidylinositol-5-phosphate 4-kinase, type II, alpha (ENSG00000150867), score: 0.77
PLP1proteolipid protein 1 (ENSG00000123560), score: 0.6
PMP2peripheral myelin protein 2 (ENSG00000147588), score: 0.79
PREX1phosphatidylinositol-3,4,5-trisphosphate-dependent Rac exchange factor 1 (ENSG00000124126), score: 0.71
PRR5Lproline rich 5 like (ENSG00000135362), score: 0.68
PTK2PTK2 protein tyrosine kinase 2 (ENSG00000169398), score: 0.72
RAB40CRAB40C, member RAS oncogene family (ENSG00000197562), score: 0.64
RANGAP1Ran GTPase activating protein 1 (ENSG00000100401), score: 0.6
RAPGEF5Rap guanine nucleotide exchange factor (GEF) 5 (ENSG00000136237), score: 0.64
RASAL1RAS protein activator like 1 (GAP1 like) (ENSG00000111344), score: 0.62
RBP3retinol binding protein 3, interstitial (ENSG00000107618), score: 0.69
RGS11regulator of G-protein signaling 11 (ENSG00000076344), score: 0.56
ROBO3roundabout, axon guidance receptor, homolog 3 (Drosophila) (ENSG00000154134), score: 0.59
RP2retinitis pigmentosa 2 (X-linked recessive) (ENSG00000102218), score: -0.52
RRP15ribosomal RNA processing 15 homolog (S. cerevisiae) (ENSG00000067533), score: -0.52
RSPO2R-spondin 2 homolog (Xenopus laevis) (ENSG00000147655), score: 0.61
RSPO4R-spondin family, member 4 (ENSG00000101282), score: 0.57
SCRG1stimulator of chondrogenesis 1 (ENSG00000164106), score: 0.61
SCYL2SCY1-like 2 (S. cerevisiae) (ENSG00000136021), score: -0.53
SECISBP2LSECIS binding protein 2-like (ENSG00000138593), score: 0.56
SEMA6Asema domain, transmembrane domain (TM), and cytoplasmic domain, (semaphorin) 6A (ENSG00000092421), score: 0.64
SLC24A2solute carrier family 24 (sodium/potassium/calcium exchanger), member 2 (ENSG00000155886), score: 0.59
SLC25A30solute carrier family 25, member 30 (ENSG00000174032), score: -0.5
SLC31A2solute carrier family 31 (copper transporters), member 2 (ENSG00000136867), score: 0.62
SLC44A1solute carrier family 44, member 1 (ENSG00000070214), score: 0.71
SLC5A11solute carrier family 5 (sodium/glucose cotransporter), member 11 (ENSG00000158865), score: 0.7
SMNDC1survival motor neuron domain containing 1 (ENSG00000119953), score: -0.53
SOX8SRY (sex determining region Y)-box 8 (ENSG00000005513), score: 0.71
SSTsomatostatin (ENSG00000157005), score: 0.59
STARD3StAR-related lipid transfer (START) domain containing 3 (ENSG00000131748), score: 0.56
STOML1stomatin (EPB72)-like 1 (ENSG00000067221), score: 0.58
SYNJ2synaptojanin 2 (ENSG00000078269), score: 0.6
TJAP1tight junction associated protein 1 (peripheral) (ENSG00000137221), score: 0.79
TMC6transmembrane channel-like 6 (ENSG00000141524), score: 0.68
TMEM144transmembrane protein 144 (ENSG00000164124), score: 0.81
TMEM175transmembrane protein 175 (ENSG00000127419), score: 0.59
TMEM179transmembrane protein 179 (ENSG00000189203), score: 0.56
TMEM184Btransmembrane protein 184B (ENSG00000198792), score: 0.56
TMTC2transmembrane and tetratricopeptide repeat containing 2 (ENSG00000179104), score: 0.65
TPPPtubulin polymerization promoting protein (ENSG00000171368), score: 0.61
TRMT61AtRNA methyltransferase 61 homolog A (S. cerevisiae) (ENSG00000166166), score: 0.58
TRPM7transient receptor potential cation channel, subfamily M, member 7 (ENSG00000092439), score: -0.6
TSPAN15tetraspanin 15 (ENSG00000099282), score: 0.62
USP54ubiquitin specific peptidase 54 (ENSG00000166348), score: 0.59
WDR43WD repeat domain 43 (ENSG00000163811), score: -0.54
WEE1WEE1 homolog (S. pombe) (ENSG00000166483), score: -0.62
WRBtryptophan rich basic protein (ENSG00000182093), score: 0.57
XRN15'-3' exoribonuclease 1 (ENSG00000114127), score: -0.52
XRN25'-3' exoribonuclease 2 (ENSG00000088930), score: -0.57
ZEB2zinc finger E-box binding homeobox 2 (ENSG00000169554), score: 0.63
ZFAND6zinc finger, AN1-type domain 6 (ENSG00000086666), score: -0.53
ZNF536zinc finger protein 536 (ENSG00000198597), score: 0.63
Non-Entrez genes
Unknown, score:
HELP
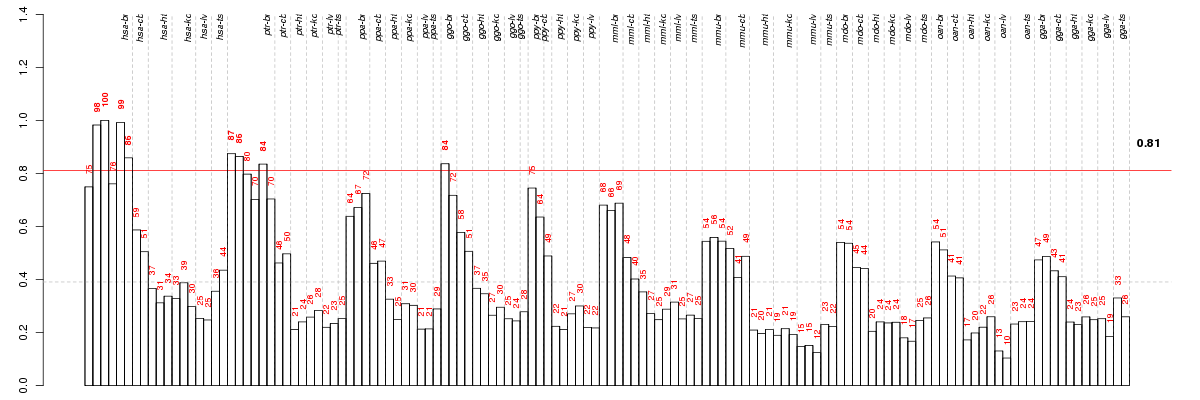
Conditions in the module, given in the same order as on the expression
plot above. Red color means over-expression, green under-expression in
the given condition.
The barplot below shows the condition (sample) scores. A separate bar
is shown for each sample, its height is the corresponding score of the
sample in the module. The red and green numbers on the bars are the
sample scores expressed in percents, i.e. 100% is 1.0.
The height of each bar corresponds to the weighted
mean expression of the module genes. The weights are the gene scores
of the module and they are positive for the genes listed in
red above and they are negative for
the genes that are listed in
green.
Bars going up correspond to samples listed in
red (the ones that are different
enough to included in the module). In these samples
the red module genes are highly
expressed, and the green
module genes are lowly expressed. The behavior of the genes is the
opposite for bars going down.
The red and green lines show the module thresholds, samples above
the red line and below the green line are included in the module.
The different species and tissues that were part of the study, are separated
by dashed vertical lines.
— Click on the Help button again to close this help window.
| Id | species | tissue | sex | individual |
| ptr_br_m5_ca1 | ptr | br | m | 5 |
| ggo_br_m_ca1 | ggo | br | m | _ |
| hsa_br_f_ca1 | hsa | br | f | _ |
| ptr_br_m2_ca1 | ptr | br | m | 2 |
| ptr_br_m3_ca1 | ptr | br | m | 3 |
| hsa_br_m3_ca1 | hsa | br | m | 3 |
| hsa_br_m7_ca1 | hsa | br | m | 7 |
| hsa_br_m6_ca1 | hsa | br | m | 6 |


© 2008-2010 Computational Biology Group, Department of Medical Genetics,
University of Lausanne, Switzerland