Difference between revisions of "ExpressionView"
| Line 11: | Line 11: | ||
<gallery widths="200px" heights="109px" perrow="3"> | <gallery widths="200px" heights="109px" perrow="3"> | ||
image:Expressionview.screenshot.1.png|Startup screen | image:Expressionview.screenshot.1.png|Startup screen | ||
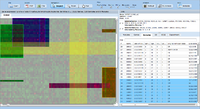
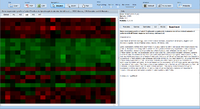
| − | image:Expressionview.screenshot.2.png| | + | image:Expressionview.screenshot.2.png|Global view after loading dataset |
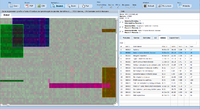
| − | image:Expressionview.screenshot.3.png| | + | image:Expressionview.screenshot.3.png|Highlighting modules |
| − | image:Expressionview.screenshot.4.png| | + | image:Expressionview.screenshot.4.png|Zoom functions |
| − | image:Expressionview.screenshot.5.png| | + | image:Expressionview.screenshot.5.png|Highlighting genes (probes) and samples |
| − | image:Expressionview.screenshot.6.png| | + | image:Expressionview.screenshot.6.png|GO and KEGG associations |
| − | image:Expressionview.screenshot.7.png| | + | image:Expressionview.screenshot.7.png|Modules view emphasizing the underlying gene expression data |
| − | image:Expressionview.screenshot.8.png| | + | image:Expressionview.screenshot.8.png|Global view without gene expression data |
| − | image:Expressionview.screenshot.9.png| | + | image:Expressionview.screenshot.9.png|Experiment description |
</gallery> | </gallery> | ||
Revision as of 08:47, 16 November 2009

ExpressionView is an R package that provides an interactive environment to explore biclusters identified in gene expression data. A sophisticated ordering algorithm is used to present the biclusters in a visually appealing layout that provides an intuitive summary of the results. From this overview, the user can select individual biclusters and access all the biologically relevant data associated with it. The package is aimed to facilitate the collaboration between bioinformaticians and life scientists who are not familiar with the R language.
Contents
Launch
- Launch ExpressionView
- Launch ExpressionView with ALL data (8 modules)
- Launch ExpressionView with ALL data (108 modules)
Screenshots
Startup screen
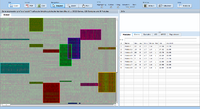
Global view after loading dataset
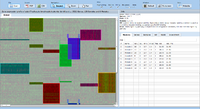
Highlighting modules
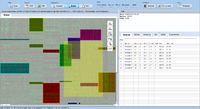
Zoom functions
Highlighting genes (probes) and samples
GO and KEGG associations
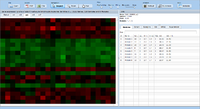
Modules view emphasizing the underlying gene expression data
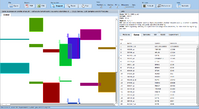
Global view without gene expression data
Experiment description


Download
Tutorials
There are several tutorials describing how to use ExpressionView:
R package
Flash applet
Additional documentation
- The ordering algorithm is described in more detail in pdf:Expressionview-ordering.
- The XML file structure is defined in pdf:Expressionview-xml.