File:Stats table.png
Size of this preview: 800 × 533 pixels. Other resolutions: 320 × 213 pixels | 930 × 620 pixels.
Original file (930 × 620 pixels, file size: 57 KB, MIME type: image/png)
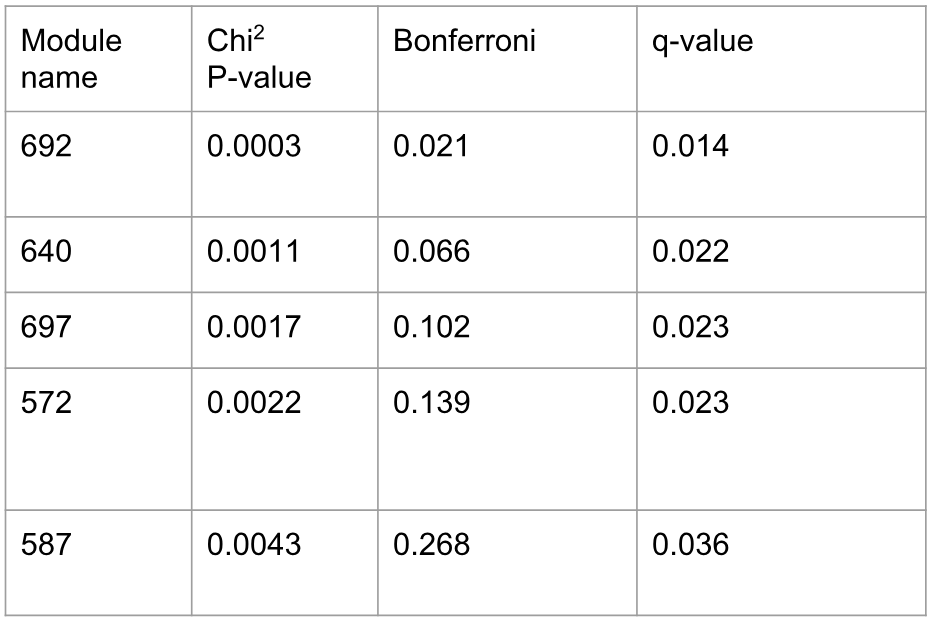
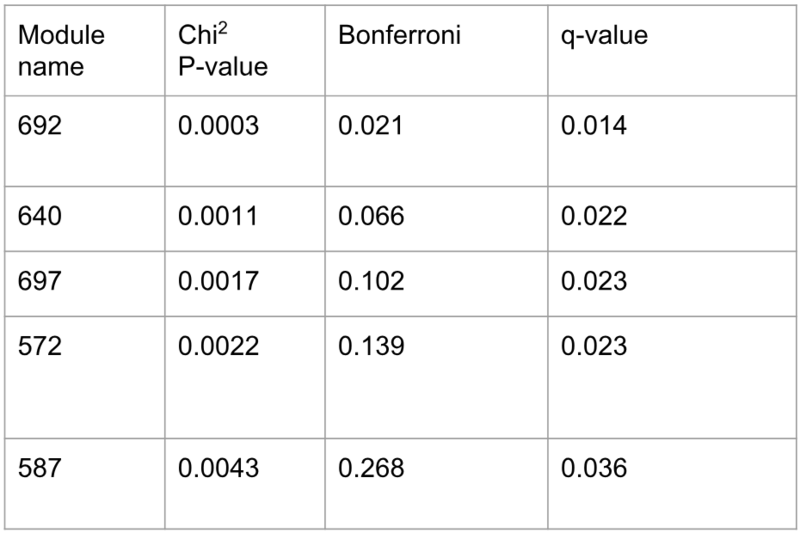
The numbers on the first column are the modules names that came out significant from Pascal after correction. The chi-squared p-values are returned by Pascal, so not corrected for multiple-testing. The third column represents the adjusted p-values after Bonferroni correction and the last column is the q-values. In the last case only the five modules are significant.
File history
Click on a date/time to view the file as it appeared at that time.
| Date/Time | Thumbnail | Dimensions | User | Comment | |
|---|---|---|---|---|---|
| current | 23:04, 29 May 2018 | | 930 × 620 (57 KB) | Sbprm2018 3 (talk | contribs) |
- You cannot overwrite this file.
File usage
There are no pages that link to this file.