In this article the authors describe an evolutionary convergence in mammals, birds, and reptiles, based on genomic data from NCBI. The evolution of different species and lineages is due to mutations that can appear and accumulate in organisms over time. Those mutations need a high functional potential and have to be conserved in time in order to form new species. The conservation of mutations can occur via selection pressure, mutational compensation, and/or by the separation of members from the same species by geological and environmental events.
In this comprehensive study, the authors describe, a genomic landscape of the parallel evolution by analysing functional nodal mutations (fNMs) by using different types of DNA (mitochondrial and nucleic), the thermostability of mtDNA encoding RNA genes, and the structural proximity of proteins, using the available 3D structures from PDB database. Functional nodal mutations (fNMs) can be separated in single nodal (fSNMs), recurrent nodal mutations (fRNMs), occured independently in unrelated lineages and recurrent combinations of nodal mutations (fRCNMs) recurred independently along with other nodal mutations in combinations in more than a single lineage. The recurrent ones can be taken in consideration the most when we are talking about the convergent adaptive responses, that means the parallel evolution of different species. In this study, one of the aim is to find the best candidate for this adaptive mutations that was present in the evolution of the amniotes. The compensated ones are used to identify the adaptive mutations. The main explanation for the convergent evolution is the presence of the recurrent nodal mutations. Many fNMs are in combination with potential compensatory mutations in RNA and protein-coding genes. The compensation of a functional mutation is the co-occurrence with additional mutations that are “affecting” the original function.
Results
In the article it is claimed that the evidence for parallel evolution is mainly due to the presence of a high number of uncompensated reccurent fNMs. The best candidate to show the parallel evolution is the emergence of body thermoregulation in mammals and birds, that seems to be independent.
The mtDNA, the maternal genetic information was used to identify the fNMs in the amniotes. The study is based on mtDNA from 1003 species and nDNA from 91 species. The mtDNA was used for the structure-base alignment for 24 mtDNA-encoded RNA genes (tRNA and rRNa) and 13 protein-coding gene. To this, they added 4 more mtDNA proteins with the 3D structure: CO1-3 and Cytb, as the cytochromes are highly conserved proteins across various species. The mtDNA genes are usually the same, but what seems to be different it is the order of the genes, that are changed by evolutionary rearrangements. Because of this, they first aligned the genes individually and after this, they concatenated the 37 proteins to the human mtDNA gene order.
The sequence alignment revealed a number of 25234 nodal non-synonimous and RNA gene mutations. To see the potential of this mutations, there were calculating a score that include: evolutionary conservation, physical-properties (of non-synonymous changes) and the molecular thermostability (the free estimated energy (?G) for the two RNA sequences was calculated before and after the mutational event). The score, from 1 to 9 is depending to the level of conservation and physico-chemical properties of the tested amino acid.After calculating the potential function score of all the nodal mutations, there were 3262 non-synonimous fNMs, mainly in RNA genes with mutations related to disease-causing.
The next step was to identify the best candidate for adaptive fNMs by studying the compensated and non-compensated mutations, but the approach chosen by the authors cannot reveal the exact order of compensation process. Meanwhile, there are some compensatory mutations that could gain lower functionality scores than the co-occurring fNMs. In the Figure 1, we can see a demonstration of the potential compensation and a possible adaptation in a protein-coding gene (COX2) through different species. The panel b shows the locations of the fNMs (S155T) and different other co-occurring compensatory mutations. The S155T mutation appears as independently re-occurrent as well as compensatory co-occurring mutations. As we can see, this approach is pure theoretical, because cannot show all the compensations, only the best ones, that got fixed in evolution. The Figure 2 shows the prevalence of different types of mutations that could be compensated or not. The predictive results reveal a high probability of fRCNMs to be compensated for RNA and protein-coding genes. Here are introduced also the information from the nDNA, that is compared with mtDNA in term of prevalence of the compensatory and non-compensatory mutations. Because there was a big difference of the number of species involved in this approach, the evolutionary resolution was reduced. So, the authors decided to analyze the same 91 species for mtDNA and nDNA and reducing the bias. Because of the reduction in the resolution, they redid the analysis by using the most ancient mutations, that occurs in deeper nodes in the case of mtDNA, but this revealed almost the same proccent as they were working with the 91 species (37% for the ancient mutations and 34% by including the younger ones) (Figure 2e & Supplementary 5b,c). So, the older mutations appear to be less compensated and this give more uncompensated mutations that are best candidates in the ancient adaptative mutations. In the supplementary Figures, the authors are using the OXPHOS complexes to compare the fNMs in mtDNA and nDNA by using 91 species. For the intra-mtDNA the albeit is less prominent (31%).
For the nDNA data is used the whole genome of the species. So, the information is much more comprehensive by the presence of a higher number of genes. In comparison with the mtDNA, the compensation prevalence is lower, having a difference of 10%, but in both case the proccent of possible compensation is higher than can be explained by the mutation rate or the chance.
In the end, to determine the best adaptive mutations over the evolution, they used the fRNMs from mtDNA, but maybe because of the low number of the samples, the result did not show any proof of the impact of non-compensated fRNMs in being the main reason for the convergent evolution. Instead, the nDNA revealed a significant pattern with highest number of potential non-compensated fRNMs shared between birds and mammals (N=51). The best candidates resulted by being the mutations in the genes related to the thermoregulation in the birds and mammals.
Conclusion
In this comprehensive study, the authors merged several information, including different types of DNA, from many species, with various physico-chemical parameters. The results of this work reveal, that the ancient functional mutation are the best for being studied, because of their possibility to overcome negative selective. The best candidates for the adaptive nodal mutations are in the end the non-compensated fNMs, that are in a higher presence in the case of old fNM. This seems to be the main helper for the evolution of the thermoregulation in birds and mammals. The protein analysis reinforces the main conclusion: for enriching the adaptative mutations, the non-compensated mutations are the best candidates.
Taken together this study provides new insights into how different lineages and species might have developed over time. It also shows a new way how to combine data from different sources. However, the authors fail in giving an adequate explanation for the fNMs, together with the fact that they lack references that describe this term makes the article difficult to understand, especially for people that are not from the field and this is in fact the contrary of how scientific writing should be done.
Levin & Mishmar, 2017, The genomic landscape of evolutionary convergence in mammals, birds and reptiles. Nature Ecology & Evolution 1: 0041
]]>
Introduction
Darwin’s finches from Galapagos and Cocos Island are classic example of young adaptive radiation, entirely intact because none of the species having become extinct as a result of human activity. They have diversified in beak sizes and shapes, feeding habits and diets in adapting to different food resources. Although traditional taxonomy of Darwin’s is based on morphology and has been largely supported by observations of breeding birds finches, in this paper, authors showed the results of whole-genome re-sequencing of 120 individuals representing all of the Darwin’s finch species inhabiting Galapagos archipelago (Fig. 1a) and two close relatives, trying to analyse patterns of intra-and interspecific genome diversity and phylogenetic relationships among the species.
Figure 1a. Sample location of Darwin’s finches

Summary and comments of the paper
The authors analyzed location and phylogeny of Darwin’s finches and found widespread evidence of interspecific gene flow that may have enhanced evolutionary diversification throughout phylogeny. They also reported discovery of a locus with the major effect on beak shape. They generated 10x sequence coverage per individual bird and using 2×100 base-pair (bp) paired-end reads and found evidence of introgression from three sources: ABBA-BABA tests, discrepancies between phylogenetic trees based on autosomal and sex linked loc, and mtDNA. Extensive sharing of genetic variation among populations was evident, particularly among ground and tree finches, with almost no fixed differences between species in each group. Their maximum-likelihood phylogenetic tree based on autosomal genome sequences is generally consistent with current taxonomy showing several interesting deviations (Fig. 1b).
Figure 1b. Phylogeny of Darwin’s finches

Revised and dated phylogeny of Darwin’s finches shows that the adaptive radiation took place in the past million years, with a rapid accumulation of species recently. Genomic characterization of the entire radiation revealed a striking connection between past and present evolution. Evidence of introgressive hybridization is found throughout the radiation, showing that hybridization always gives rise to species of mixed ancestry, which is explained in detail (species and location) in this paper. The most obvious morphological difference among Darwin’s finches concerns beak shape. The authors performed a genome wide scan on the basis of populations that are closely related but show different beak morphology. In this study, they indicated a polygenic basis for beak diversity, discovering 15 regions with strong genetic differentiation between groups of finches with blunt or pointed beaks. Their analysis revealed that ALX homeobox 1 is an excellent candidate for variation in beak morphology, because it encodes a paired-type homeodomain protein (transcription factor), that plays a crucial role in development of structures derived from craniofacial mesenchyme, the first branchial arch and the limb bud, and have influence on migration of cranial neural crest cells, highly relevant to beak development. They observed single nucleotide polymorphisms (SNPs) in ALX1 gene of various finch species and concluded that blunt haplotype has a long evolutionary history because it’s origin predates the radiation of vegetarian, tree and ground finches. The haplotype might have evolved by accumulating both coding and regulatory changes affecting ALX1 function. Natural selection and introgression affecting this locus have contributed to the diversification of beak shapes among Darwin’s finches and hence to their expanded utilization of food resources on different Galapagos islands.
Lamichhaney, S., Berglund, J., Almén, M., Maqbool, K., Grabherr, M., Martinez-Barrio, A., Promerová, M., Rubin, C., Wang, C., Zamani, N., Grant, B., Grant, P., Webster, M., & Andersson, L. (2015). Evolution of Darwin’s finches and their beaks revealed by genome sequencing Nature, 518 (7539), 371-375 DOI: 10.1038/nature14181
]]>Meiosis is an important biological process by which combination of various types of the genes called alleles, are segregated and packed in each germ cell waiting to be transferred and expressed in descendants. This combinations of alleles are products of chromosomal crossovers (COs) during meiotic recombination, which increases the genetic diversity of gametes. Recombination may cause local mutagenic effect at crossover sites with recurrent double strand breaks (DSBs) and thus be the source of sequence variation too.
SUMMARY OF THE PAPER
By sequencing a large number of single sperm DNA molecules, the authors showed that meiosis is an important source of germline mutations and consequently gene variation. They found more de novo mutations in molecules with COs then in molecules without a recombination event by amplifying single CO products, using allele-specific PCR, at two previously identified recombination hotspots (HSI and HSII) from a pool of sperm. The binding site used by the human recombination machinery contains PRDM9 (PR Domain Containing 9), very polymorphic in humans. In order to investigate why sequence diversity positively correlates with high recombination activity regions, the authors sequenced 5,796 COs in total, including both reciprocal recombination products from 6 Caucasian donors. As a control they screened single nonrecombinants (NRs) in the same region and subset of donors using the same experimental conditions.
To adjust CO mutation frequencies, authors used mutation frequency of NRs as a control, which are combination of rare de novo mutations and PCR artefacts. COs had a mutation frequency nearly 3.6 times higher than NR control (0.29% de novo mutations per CO of which 50% occurred between the DSB and the CO breakpoint, 348 nucleotides away from hotspot center (Fig. 1A), and it was similar for both hotspots (HSI and HSII), but most of the donors actually came from HSI, so the authors focused more on data analysis of this hotspot.
Figure 1. COs, mutations, and CCOs in HSI.

This also suggests that the observed mutations are associated with CO formation and they are independent of other site-specific factors such as base composition. Mutation rate at hotspots (? HS) showed that more active hotspots exert a stronger mutagenic effect than weaker hotspots. All the observed de novo mutations changed strong (S) CG into weak (W) TA base pairs and they all occurred mainly at CpG sites. This strong mutational bias at CpGs are not exclusive to COs. CpG dinucleotides generally have high mutation rates, but what explains high mutation level at COs containing CpG sites is that single stranded DNA arised from double strand break (DSB), is more susceptible for chemical modification leading to G ? T conversion on single-stranded DNA, and repair of those mismatched base pairs is only possible by the recognition from repair machinery bounded for double stranded, which is not the case for single stranded resected DNA 3’-ends created after DSB (Fig. 2A). If the formation of single-stranded DNA at methylated CpG sites is the main driver for de novo mutations, then DSBs resolved alternatively as noncrossovers (NCOs) might also have a higher frequency of the mutations.
Figure 2. Model of CO-driven evolution.

Considering hotspot CpG sites, the authors also observed very high methylation level (83-88%), both, in testis and in sperm, pointing on the cellular states before and after meiosis, respectively. The authors also suggested that non-Mendelian segregation of alleles at hotspots, arised during DSB repair could be either a result of an initiation bias, in which DSB-suppressing alleles are used to repair the broken homolog, or gene conversion favoring GC-alleles leading to GC-biased gene conversion (g-BGC).
Biased transmission is favorised for GC alleles representative for g-BGC, rather than for an initiation bias. In the authors data it is shown that all of the donors are homozygous at the DSB site which makes initiation bias unlikely. Sites with the strongest evidence for unequal transmission favor strong (GC) vs weak (AT) alleles (Fig 1B). Authors observed that transmission bias affects also single nucleotide polymorphisms (SNPs), which can be preferentially transferred, regardless of whether they are near or away from DSB (Fig.1C). Initiation bias do not favor strong over weak alleles in humans and yeast, whereas gBGC does. Another potential source of gBGC in the 6,085 mapped COs is the formation of COs with rare, discontinuous conversion tracks containing two CO breakpoints, and it is called complex COs (CCOs). Heteroduplex tracts are formed in polymorphic regions during DSB. If there acts gBGC, COs will tend to include strong alleles and exclude weak alleles (Fig. 2B). How fast crossing over drives the decimation of a hotspot via mutagenesis and gBGC depends on how sequence changes affect CO frequencies, which is still a mystery.
CONCLUSIONS
This study contributes to the understanding of the sequence evolution at recombination hotspots. Authors suggested that GC-biased gene conversion (gBGC) is the dominant force shaping the nucleotide composition at hotspots during crossing over, and potentially in other recombination products, which might explain the high GC content associated with recombination. It is possible that gBGC is an adaptation to reduce the mutational load of recombination, knowing that mutation favors weak over strong nucleotides. Still, small sample size gives a little power for detecting potential differences between COs and NCOs.
Arbeithuber, B., Betancourt, A., Ebner, T., & Tiemann-Boege, I. (2015). Crossovers are associated with mutation and biased gene conversion at recombination hotspots Proceedings of the National Academy of Sciences DOI: 10.1073/pnas.1416622112
]]>The monarch butterfly (Danaus plexippus) has a large distribution worldwide. It occurs in North, Central, and South America, Caribbean, and it has recently dispersed to other locations, such as Oceania and Africa. Two traits of this butterfly are incredibly intriguing: their annual migration in North America, and their warning coloration.
Among the populations spread out around the globe, only the population of North America has a migrant behavior. Monarchs migrate thousands of kilometers from northern United States and southern Canada to overwinter in Mexico. In Spring, they begin mating and flying back to the North. This long annual migration process happens throughout the life time of more than one generation. Regarding their warning coloration, what is intriguing about it is the occurrence of an intense polymorphism in this trait when compared to other butterflies of the same genus. Monarchs and other Danaus butterflies have by default bright orange wings. This bold coloration warns predators about their toxicity. However, in a monarch population from Hawaii, some butterflies have white instead of orange wings.
In this paper, authors investigate, through comparative population genomics, the genetic base for such migration and color polymorphisms of the monarch butterfly.
The migration of the monarchs
By comparing around 32 million SNPs (single nucleotide polymorphisms) of 89 butterflies of both the migrant North American population and non-migrant populations around the world, authors first determined what is the evolutionary origin of the monarchs and its dispersal history. Second, they screened for regions of the genome that are possibly associated with the migration behavior of monarchs. Lastly, they explored one of the screened genes to investigate if it has, in fact, functions related to migration.
The evolutionary history of the monarchs: The authors suggested that, contrary to a priori expectations, the basal lineage of the monarch is the North American lineage and that it has dispersed worldwide in subsequent three independent dispersal events. This is supported by a consensus neighbor-joining tree based on 1000 bootstraps (fig. 1d). In my opinion, authors could have chosen to display such tree as a rooted tree. This would make clearer the idea that the North American population is the basal lineage. By using a PCA (principal component analysis) plot of the genetic data among populations, they also showed that the different populations (North America, Pacific crossing, Central America and Atlantic crossing) differ genetically, i.e. sample locations are clearly grouped per populations (fig. 1e). The genetic structure and individual ancestry analysis of populations was tested across varying cluster numbers and also provides support that the North American population is the monarch basal lineage (fig. 1f).
Screening of genome regions associated with migratory behavior: The authors identified a genomic region highly divergent between migratory and non-migratory populations and likely to be under natural selection. This is supported by figure 2a, in which they compared genome-wide population divergence using an adaptation of a statistical model called Population-Branch Statistic (PBS). More information about PBS can be found here. By constraining the search to DNA windows with a negative Tajima’s D (that indicates genomic regions evolving under a non-random process) and that are highly conserved in the migratory population, they found a genomic region of 21 Kb highly divergent between migratory and not migratory populations and likely to be under selection (fig. 2a). The authors found multiple signatures of selection in this genome region using diverse population genetic statistics (fig. 2b), which gives further support to their screen. By investigating which annotated genes are present in this 21 Kb DNA region, the authors found three genes: F-box protein, an uncharacterized transmembrane protein, and collagen type IV subunit alpha-1 (fig. 2c). Out of these three screened genes, the authors discussed only the possible function of the collagen IV to the migratory behavior of the monarchs. Surprisingly, they do not further discuss the other two genes found by their screening, although these genes were also found to be highly divergent and under selection.
Exploring the function of collagen IV subunit alpha 1: The gene collagen IV is believed to be linked to the migratory behavior given its importance for muscle morphogenesis and function. Furthermore, this gene showed signals of divergent selection between migratory and non-migratory populations, with high fixation index (Fst) and sequence divergence (Dxy) (fig. 3a). Haplotype divergence between migrant and non-migrant population was also remarkably elevated for the collagen IV, despite the fact that this is a comparison of haplotypes of the same species (fig. 3b). Interestingly, the ancient version of the collagen IV haplotype seems to be the non-migratory one (fig. 3c). This suggest that, if this haplotype is indeed strongly related to migration, the species was originated in North America from a non-migrant ancestor, evolved the current migration behavior, and when it further dispersed worldwide, it has reverted to the ancient non-migratory behavior. In order to test for the function of the collagen IV gene, the authors measured the expression of this gene in adult monarch from migrant and non-migrant populations. Contrary to logic expectations, this gene was down regulated in migrant populations (fig. 3e). This led the authors to hypothesize that it would be acting on aspects of flight efficiency, i.e. that flying would be less demanding for migrant than non-migrant populations. To further investigate this hypothesis, they tested the metabolic rates of both migrants and non-migrant monarchs. As predicted, they found the flight metabolic rates of the migrant butterflies to be significantly lower than the non-migrant ones, but the resting metabolic rates to be similar among individuals of the two migratory behaviors (fig. 3f).
The take home-message of this part of the paper is that after a genome-wide screening they found one gene, the collagen IV subunit 1, which is highly divergent between migratory and non-migratory populations. Also, this gene seems to be under divergent selection and to affect flight function, and therefore, might be part of the genetic base behind the migration polymorphism of the monarch butterfly.
The color polymorphism of the monarchs
In order to investigate the genetic basis of the color polymorphism, the authors sequenced the genome of 12 additional monarch butterflies from a population in Hawaii where the white type occurs. The white type is believed to be caused by a deleterious mutation in a color production pathway (the ommochrome biosynsthesis). The authors, therefore, scanned the genomes of wild and white type monarch butterflies looking for association patterns between SNPs and wing coloration. In figure 4b, they highlighted a genomic region in which there was a high association between SNPs and wing color. This region contains a myosin gene (that is believed to be associated with pigment transportation) under strong purifying selection (fig. 4c), suggesting that the genetic basis of the white type is associated to pigment transportation rather than pigment production. As a drawback of this analysis I would mention that some SNPs with high probability of association with the color polymorphism (particularly two of them, just on the left side of the top ones highlighted by the authors in fig. 4b) were ignored by the authors without any explanation/discussion.
Wrapping up…
In this paper the authors revealed part of the genetic basis of two intriguing traits of monarch butterflies. Also interestingly they re-wrote the evolutionary history of this species and suggested that, contrary to expectations, the species has most likely originated in North America from a non-migrant ancestor. Later they became migratory in North America, and when they dispersed worldwide, they reverted to the original non-migratory behavior. The North American population of monarch butterflies is endangered, and as it is the basal lineage, it contains higher genetic diversity than the dispersed lineages. The data of this paper show that a disappearance of the monarchs in North America would represent a significant reduction in the genetic diversity of this species and a complete loss of the migratory behavior. This paper is, therefore, a good example of how powerful genomic analyses are and how useful they can be to answer evolutionary, ecological and even conservation biology questions!
Zhan, S., Zhang, W., Niitepõld, K., Hsu, J., Haeger, J., Zalucki, M., Altizer, S., de Roode, J., Reppert, S., & Kronforst, M. (2014). The genetics of monarch butterfly migration and warning colouration Nature, 514 (7522), 317-321 DOI: 10.1038/nature13812
]]>Development and homeostasis of all organisms is tightly controlled by transcription regulatory factors that are often highly conserved across deep phylogenies. However, it is unclear to what extend the basic components of these networks (e.g. network motifs and structure, binding frequencies, factor interactions) are preserved in distantly related species. Boyle and colleagues try to shed light on this question in a recent study published by nature in August 2014 (doi:10.1038/nature13668).
Paper summary
The scientists compare genome-wide binding locations of 165 human, 93 worm and 52 fly transcription regulatory factors in different cellular contexts (developmental stages and tissues) to identify the common properties of their underlying networks (data overview shown in Figure 1, taken from original publication).

As already described in smaller-scale studies, they see that DNA binding motifs of orthologous regulatory factors remain similar in distantly related species. Furthermore, these orthologous factors are expressed in similar contexts. However, expression of the orthologous targets is only weakly correlated suggesting an extensive re-wiring of regulatory networks across human, worm and fly. Reconstructions of regulatory networks point to a higher number of master-regulators and upward-flowing edges in human when compared to worm and fly. In all three species, the most abundant network motif is the feed-forward loop while cascade, divergent and convergent network motifs are underrepresented. Investigation of co-associations of regulatory factors shows that co-associations are local and contextual and that co-associations occurring at promoters have stronger conservation than co-associations in more distal regions.
The authors conclude that the overall structure of regulatory networks, in terms of network motif usage and context of the genomic binding event (high-occupancy target regions, enhancer, promoter), is strongly conserved. However, the regulatory targets are quite divergent and may account for the phenotypic differences among species.
Personal comment
Boyle and colleagues have created a big data set of transcription factor binding events in different cell lines and tissues for human, worm and fly. Doubtless, this resource will be of high interest for many researchers. But in my opinion, there are a couple of points that the reader should keep in mind when interpreting this data in light of the papers’ research aim – the comparison of regulatory circuits across species:
1) Tissue sampling
Without any question, cell lines are a good tool to study basic principles of cell homeostasis. But how well does a cell line, which has undergone many cell divisions and freezing/thawing cycles in an artificial lab environment, represent its in vivo counterpart? Is it reasonable to compare highly specialized human cell lines to entire worm and fly embryos? Why not use mouse instead of human? From an evolutionary perspective, mice are as close to worms or flies as humans are, and samples from an in vivo organ would probably reflect “reality” much better…
2) Genome size and complexity
The authors detect a higher number of master-regulators and upward edges in human regulatory networks when comparing human to worm and fly. But again, we are comparing highly specialized cell lines to whole embryos and larvae. Any signal created by specific tissues in an embryo or a larva has probably been strongly diluted and as a consequence, may be difficult to pick up! And not to forget: Human, worm and fly have different genome sizes and gene numbers. Anything we compare should be scaled and discussed in light of these numbers.
Big science can be helpful, but interpretation needs to be done carefully. Data is often generated based on very broad and general research questions and the generated data may not necessarily be the best to answer these questions. I am not against big consortia such as ENCODE and modENCODE, but I think that many of the findings can only be discussed from a very general perspective and often require a more redefined analysis.
Reference
Boyle, A., Araya, C., Brdlik, C., Cayting, P., Cheng, C., Cheng, Y., Gardner, K., Hillier, L., Janette, J., Jiang, L., Kasper, D., Kawli, T., Kheradpour, P., Kundaje, A., Li, J., Ma, L., Niu, W., Rehm, E., Rozowsky, J., Slattery, M., Spokony, R., Terrell, R., Vafeados, D., Wang, D., Weisdepp, P., Wu, Y., Xie, D., Yan, K., Feingold, E., Good, P., Pazin, M., Huang, H., Bickel, P., Brenner, S., Reinke, V., Waterston, R., Gerstein, M., White, K., Kellis, M., & Snyder, M. (2014). Comparative analysis of regulatory information and circuits across distant species Nature, 512 (7515), 453-456 DOI: 10.1038/nature13668
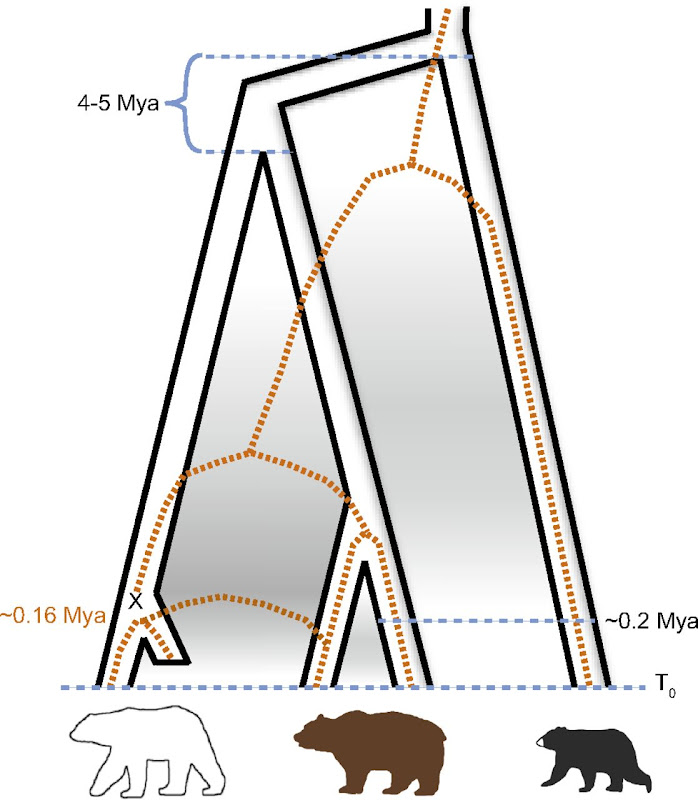
]]>- Polar bear underwent a very rapid and recent (less than 200 ky ago) adaptation to extreme environment (previously not seen in mammals)
- Brown bear is a paraphyletic taxon, as polar bear is the sister specie of the ABC bears (see Fig. 1)
 |
||
| Fig. 1: Miller et al., Polar and brown bear genomes reveal ancient admixture and demographic footprints of past climate change, PNAS 2012 |
| Fig. 2: Miller et al., Polar and brown bear genomes reveal ancient admixture and demographic footprints of past climate change, PNAS 2012 |
 |
||
| Fig. 3: Miller et al., Polar and brown bear genomes reveal ancient admixture and demographic footprints of past climate change, PNAS 2012 |
 |
|
| Fig. 4: Miller et al., Polar and brown bear genomes reveal ancient admixture and demographic footprints of past climate change, PNAS 2012 |
 |
| Fig. 5: Miller et al., Polar and brown bear genomes reveal ancient admixture and demographic footprints of past climate change, PNAS 2012 |
 |
||
| Fig. 5: Miller et al., Polar and brown bear genomes reveal ancient admixture and demographic footprints of past climate change, PNAS 2012 |
 |
| Fig. 6: Miller et al., Polar and brown bear genomes reveal ancient admixture and demographic footprints of past climate change, PNAS 2012 |
I think that to address the subject of adaptation in polar bear, a study of positive selection in protein-coding gene is lacking. As authors already conducted transcriptome sequencing of polar and brown bears, annotating gene in their genome, selecting orthologous genes together with other copies from completely sequenced genomes, as dog, panda and other mammals, and then using a model to test for positive selection such as implemented in PAML would be an efficient way to identify genes of interest in the polar (or ABC) bears. Nevertheless, I am very well aware of the tremendous amount of work already performed in this PNAS paper.
 |
| Fig. 6: Miller et al., Polar and brown bear genomes reveal ancient admixture and demographic footprints of past climate change, PNAS 2012 |
- The bump in the polar bear curve signified as the “Post Eemian increase” was not significant when looking at the 95% interval range in the supplementary material
- Knowing from the previous part of the article the extended hybridization between ABC and polar bears, would not the diversity introduced during those event affect the effective population size reconstruction ?
Hailer F, Kutschera VE, Hallström BM, Klassert D, Fain SR, Leonard JA, Arnason U, & Janke A (2012). Nuclear genomic sequences reveal that polar bears are an old and distinct bear lineage. Science (New York, N.Y.), 336 (6079), 344-347 PMID: 22517859
Miller W, Schuster SC, Welch AJ, Ratan A, Bedoya-Reina OC, Zhao F, Kim HL, Burhans RC, Drautz DI, Wittekindt NE, Tomsho LP, Ibarra-Laclette E, Herrera-Estrella L, Peacock E, Farley S, Sage GK, Rode K, Obbard M, Montiel R, Bachmann L, Ingólfsson O, Aars J, Mailund T, Wiig O, Talbot SL, & Lindqvist C (2012). Polar and brown bear genomes reveal ancient admixture and demographic footprints of past climate change. Proceedings of the National Academy of Sciences of the United States of America, 109 (36) PMID: 22826254