Mexico, hosted many cultures such as the Olmec, the Toltec, the Maya and the Aztec, conquered and colonized by the Spanish Empire in 1521. The country harbors a large source of pre-Columbian diversity and their genetic contributions to today’s population.
In a recent paper, Moreno-Estrada et al. 2014 performed a detailed genetic study of Mexican genetic diversity. The results showed the genetic stratification among indigenous populations and an association between subcontinental ancestry and lung function.
In the first part of the study, to estimate the genetic diversity, researchers examined autosomal single-nucleotide polymorphisms for more than 500 Native Mexican individuals from all around Mexico. Statistical analysis of genomic data showed that some populations within Mexico are more differentiated than European and East Asian populations. This extreme differentiation thought to be a result of isolation followed by a bottleneck and small effective population sizes.
The data was analyzed in various ways (ROH and IBD analysis, PCA etc.) and revealed the population substructure of Mexico. In all of the analysis, the results confirmed that Seri (northernmost) and Lacandon (southernmost) have the highest level of differentiation. Also, the differentiation between Seri and Lacandon was greater than average differentiation between human populations. The relationships between other populations were accordance with geography, migration and language history. When African and European genetic data were included in the analysis of native Mexicans, it had been shown that most individuals have the genetic composition of Native and European ancestry. Further analysis indicated the ancient Native American substructure was recapitulated even after postcolonial admixture.
In the second part of the study, Moreno-Estrada et al. 2014 investigated the potential biomedical applications of genetic substructure information. Previous studies indicated the relationship between forced expiratory volume in 1 second (FEV1) could be an indicative of pulmonary disease and another study suggested that the proportion of European ancestry was associated with FEV1 in Mexicans. Researchers measured the lung function in Mexican and Mexican-American children with asthma and correlated these findings with native ancestry. Results showed 7.3% change in FEV1 moving from Sonora to Yucatan and researchers proposed that native ancestry could alone have effects on lung function in admixed individuals within Mexico.
Personal Comments
This paper provides novel insights to Mexican genetic diversity and proposes the biomedical applications of genetic data. The sampling locations cover most of the country and the analysis of the data in various methods gives confidence to reader. The paper is easy to follow and the figures are quite helpful.
However, I think there is a critical point that needs to be discussed from a medical point of view. As far as I know, asthma is a complex disease and thought to be caused by both genetic and environmental factors. In this study, I could not find any information about the developmental and medical history of patients. I think this is a critical point because of heterogeneous geography of the county. Where were they raised – in volcano towns, Pacific shores, Sumidero Canyon, Laguna Salada (-10m) or piedmont plains of Pico de Orizaba (5636m)? Did their mothers smoke during pregnancy? Were they born in Mexico City – the city named as “the most polluted city on the planet” by United Nations in 1992? I hope the researchers have already checked for this type information and found them unnecessary to include.
Nevertheless, this is an interesting paper and shows the genetic history of Mexico – before and after 16th century. I recommend reading this paper and discussing with a medical doctor 
Moreno-Estrada, A., Gignoux, C., Fernandez-Lopez, J., Zakharia, F., Sikora, M., Contreras, A., Acuna-Alonzo, V., Sandoval, K., Eng, C., Romero-Hidalgo, S., Ortiz-Tello, P., Robles, V., Kenny, E., Nuno-Arana, I., Barquera-Lozano, R., Macin-Perez, G., Granados-Arriola, J., Huntsman, S., Galanter, J., Via, M., Ford, J., Chapela, R., Rodriguez-Cintron, W., Rodriguez-Santana, J., Romieu, I., Sienra-Monge, J., Navarro, B., London, S., Ruiz-Linares, A., Garcia-Herrera, R., Estrada, K., Hidalgo-Miranda, A., Jimenez-Sanchez, G., Carnevale, A., Soberon, X., Canizales-Quinteros, S., Rangel-Villalobos, H., Silva-Zolezzi, I., Burchard, E., & Bustamante, C. (2014). The genetics of Mexico recapitulates Native American substructure and affects biomedical traits Science, 344 (6189), 1280-1285 DOI: 10.1126/science.1251688
]]>Electric organs – organs that are capable of creating and discharging electricity – have evolved independently in at least six different lineages of fish (Torpediniformes, Rajiformes, Mormyroidea, Euteleostei, Siluriformes, Gymnotiformes) and play an important role in communication, navigation, defense and predation.
To investigate whether the convergent evolution of these organs has a common genetic basis, Jason Gallant and his coworkers studied the transcriptome of five species of electrogenic fish in three different lineages: Electrophorus electricus, Sternopygus macrurus, Eigenmannia virescens (Gymnotiforme), Malapterurus electricus (Siluriforme) and Brienomyrus brachyistius (Mormyroidea).
Electric organs are comprised of arrays of electrocytes – asymmetric cells that are enriched in cation-specific ion channels on one and sodium pumps on the opposing side. The resulting ion flux slowly charges the electrocyte membrane and upon activation by a neuronal stimulus, the voltage is discharged, generating an electrical pulse from the fish.
Although the morphology of electric organs and electrocytes varies substantially amongst these species, they are all muscle-derived tissue and originate developmentally from muscle progenitor cells.
Since this evolution of muscular to electrogenic tissue has occurred several times independently, the authors investigated, whether the underlying genetic mechanisms are shared.
To address this question, Gallant et al. first sequenced and assembled the genome of the electric eel, E. electricus. The authors further performed transcriptome analysis on multiple tissues of E. electricus as well as on pairs of skeletal muscle and electric organ tissue of two species within the same lineage (S. macrurus and E. virescens) and two species of distinct lineages (B. brachyistius, M. electricus).
Main findings
Across the species they observed common patterns of differential gene expression between electric organs versus skeletal muscles, which they attributed to the following five key mechanisms for the evolution of electrogenic tissue:
- Alteration of the expression of myogenic transcription factors
- Increased excitability by upregulation of transporters and ion channels
- Enhanced isolation and direction of electrical currents by the upregulation of proteins in the connective tissue
- Decrease in contractility by down-regulation of sarcomere associated genes
- Increase of cell size by up-regulation of factors in the Insulin-like growth factor signaling pathway
Gallant et al. propose a convincing set of changes in gene expression to explain the functional differences between electric organ and muscle tissue. The fact that these mechanisms seem to be conserved in five species of electrogenic fish is an intriguing, yet not entirely surprising observation: presumably there are strong constraints on keeping muscle function intact while opening the potential for specialization to electric tissue – it would be interesting to inquire if – and to what extent – these shared expression differences are reflected on the genetic level.
Given the ambitious goal of uncovering the basis of electric organ evolution, I think the sampling of only one individual per species is problematic, despite the authors´ main interest in inter-species similarities. For an evolutionary approach the importance of intra-species variations should not be neglected and certainly requires a larger number of individuals. Including specimens from the other electrogenic lineages (e.g. Torpediniformes, Rajiformes) or (genetic) comparisons between electrogenic and non-electrogenic descendants within a lineage would have further strengthened the evolutionary aspect.
Lastly one could suspect that phylogenetically “older” electric organs have undergone a more advanced tissue specialization, resulting in a reduced “muscle profile” but the authors do neither raise this question, nor provide any information on this aspect.
Nevertheless I can highly recommend reading and discussing the paper – the ideas and methodology are presented in a clear language, the figures are appealing and – apart from the histological pictures – informative and well explained.
Although the results on what is in charge of the evolution of electric organs holds no shocking surprise yet, the research is still electrifying.
Gallant, J., Traeger, L., Volkening, J., Moffett, H., Chen, P., Novina, C., Phillips, G., Anand, R., Wells, G., Pinch, M., Guth, R., Unguez, G., Albert, J., Zakon, H., Samanta, M., & Sussman, M. (2014). Genomic basis for the convergent evolution of electric organs Science, 344 (6191), 1522-1525 DOI: 10.1126/science.1254432
]]>Electric organs in fish have evolved independently in six lineages and are an interesting example of convergent evolution. However, the genetic basis underlying the convergence of this trait is poorly understood. By sequencing and assembling the transcriptomes from the electric organ (EO) and skeletal muscle of three of those lineages of electric fish, Galant et al. showed the presence of shared patters of gene expression in pathways related to differentiation from muscle cell, increased cell size, reduced contractility and increased excitability.
Paper summary
Electric organs allow fish to communicate, navigate and cope with predators and preys. They have evolved rather recently: less than 100 million years ago in the Cenozoic (as shown in Figure 1A). Importantly they have evolved independently in at least six taxonomically diverse lineages, constituting a clear example of convergent evolution.
Electrocytes are thought to be developmentally derived from myogenic precursors and are morphologically very different among fish lineages. This is illustrated in Figure 1B, where the authors show micrographs of electrocytes in two lineages of electric fish: gymnotiformes, such as Electrophorus electricus and Sternopygus macrurus, present electrocytes devoid of sarcomere, the contractile unit of muscle cells. In contrast, in mormiroids like Paramormyrops kingsleyae a disorganized and non-functional sarcomere can be found in electrocytes.
In order to understand the genetic programme that led to the common function of electrocytes in such morphologically different cells among lineages, Gallant et al. assembled the genome of the gymnotiform E. electricus and use RNA-seq reads from eight tissues for gene prediction, giving rise to 29,363 gene models. Genes co-expressed between tissues in E. electricus were subjected to k-means clustering analysis to reveal groups of genes that are either up-regulated (211 genes) or down-regulated (186 genes) in the EO as compared to skeletal muscle (Figure S1).
They sequenced and assembled the transcriptomes from EO and skeletal muscle of two other gymnotiforms (S. macrurus and E. virescens) and two species with an independently-evolved electric organ: M. electricus and the mormyroid B. brachyistius. In this four species they looked for the orthologs of those transcripts found up/donw-regulated in the cluster analysis of E. electricus to detect shared patterns of gene expression. Finally they focused on genes that might explain the convergent features of electrocytes versus muscle cells by selecting pathways related to down-regulation of muscle differentiation, increased excitability and insulation, decreased contractility and larger cell size.
A summary of the results is presented in figure 2A. Consistent with their idea that electrocytes derived from muscle cells, they found that transcription factors typically down-regulated in mature muscle cells are highly expressed in electrocytes (e.g. six2a, hey1), together with the down-regulation of transcription factors specifically involved in muscle cell differentiation (e.g. six4b, myogenin), except in S. macrurus.
They also showed that the increased excitability of electrocytes compared to muscle cells could be explained by the enhanced expression of certain genes involved in ion pumps and transporters (e.g. atp1a2a, scn4aa), with the notable exception of atp1a3a in E.electricus.
Similarly, they found a general down-regulation of genes related to the assembly of sarcomeres (e.g. smyd1a. cacna1sa), again with milder results in the EO of S. macrurus., that would account for the lack of functional sarcomeres and thus reduced contractility of these cells as opposed to muscle cells.
Finally, they found a general enhancement of the insulin-like growth factor (IGF) signalling pathway (e.g. igf2b, net-37, further illustrated in figure 2B), which would contribute to the larger cell size of electrocytes. An overview of the combined contribution of the studied pathways to the characteristic phenotype of electrocytes is proposed in figure 2C.
Personal comment
In the present study, Gallant et al. use transcriptome sequencing to elucidate the genetic basis of the convergent function of independently-evolved and morphologically diverse EO. However, in spite of this transcription-wide approach, the authors focused on a very selected and relatively small number of genes and transcription factors, potentially ignoring other genetic contributions that could be provided with the rich and large dataset generated.
Based on the notion that electrocytes are derived from muscle cells, they first selected genes that are up/down-regulated in the EO compared to skeletal muscle solely in E. electricus, disregarding the implications of genes that do not show differential expression, or genes up/down-regulated in EO of the other species but not in E. electricus.
Secondly, they selected certain pathways that they considered a priori to be likely responsible for the distinct phenotype of electrocytes, and for each of those pathway they presented in the main text results for only 5 genes that strongly supports their hypothesis. However in the supplementary figures S2-4 they extended their findings with other genes within the selected pathways that show more variable and unconserved patterns among species and that are nor further discussed. One particular case, atp1a3a shown in figure 2A, do not follow the pattern of enhanced expression in EO of E. electricus as they claim in the text for ion transporters responsible for increased excitability, but the unexpected result is not justified.
The presence of vestiges of disarrayed and non-functional sarcomeres in the electrocytes of the mormiroid S. macrurus that nevertheless might be energetically expensive to keep could suggest a more recent evolution of electric organs in this species. Consistent with this idea would be the milder up/down-regulation reported for some of the studied genes in S. macrurus compared to the other electric fish.
However it is important to notice the lack of biological and/or technical replicates in the study, a caveat that weakens its conclusions and questions its presence in a high-impact journal like Science. Given that the used animals were not wild but commercially obtained, increasing the sample size to a minimum of 3 animals per lineage studied could be feasible and would eliminate potential undesired technical or biological variability and provide more robust and conclusive results.
Reference
Gallant, J., Traeger, L., Volkening, J., Moffett, H., Chen, P., Novina, C., Phillips, G., Anand, R., Wells, G., Pinch, M., Guth, R., Unguez, G., Albert, J., Zakon, H., Samanta, M., & Sussman, M. (2014). Genomic basis for the convergent evolution of electric organs Science, 344 (6191), 1522-1525 DOI: 10.1126/science.1254432
]]>Amborella trichopoda, an endemic species to New Caledonia, is the most early-diverging taxa of flowering plants (angiosperms, Figure 1). As such, the sequencing of its genome was of considerable interest for the investigation of the emergence and evolution of this highly diverse lineage presenting at least 350’00 species.
In this work, the Amborella genome project (http://www.amborella.org/) reports the draft genome sequence for A. trichopoda. Notably, it was used as reference for the reconstruction of genomic features and architecture of the most recent common ancestor of living angiosperms, the investigation of gene families specific to flowering plants, and the investigation of the Amborella population structure.

Genome structure
The identification of frequent duplicated collinear genes (Figure 2a) within A. trichopoda genome provides evidence of an a ancient whole genome duplication (WGD). WGD is known to be a pervasive feature in the evolution of plants, with modern plants frequently presenting traces of multiple past duplication events. Thus, a comparison with Vitis vinifera (grape) showed that the genome of A. trichopoda is almost entirely covered by three syntenic grape regions (Figure 2b and 2c). This 1:3 relationship between those two genomes indicates that the WGD detected in A. trichopoda occurred in the common ancestor of the two species (an event referred as Epsilon, Figure 1), and confirms that the divergence of A. trichopoda at least 160 Ma ago predates the observed genome triplication of Vitis vinifera (referred as Gamma, Figure 1). In addition, the A. trichopoda genome shows no evidence of more recent duplication event.
A phylogenomic approach was then used to confirm results based on synteny analysis. First, with the reconstruction of the phylogeny of 11,519 gene families supporting the fact that duplicated genes specific to A. trichopoda are unfrequent. Inference of the duplication time significantly supported two divergence times of respectively 244 and 341 mya, corresponding to the previously identified Zeta and Epsilon WGD (Figure1). The fact that the Zeta duplication was not supported by syntenic analysis is probably due to extensive gene loss and rearrangements that occurred since this ancient event. A second phylogenetic analysis of 155 syntenic genes pairs from six manually curated duplicated blocks supports as well that Epsilon WGD predates the divergence of A. trichopoda.

The ancestral gene order of the eudicot ancestor was reconstructed based on three eudicot genomes presenting structurally similar genomes and clear patterns of paralogy among gene copies: grape (V. vinifera), peach (Prunus persica), and cacao (Theobroma cacao). A. trichopoda was used as an outgroup. Seven hypothetical ancestral chromosomes were reconstructed. This reconstruction will help to understand the evolution of eudicot lineages after the Gamma hexaploidy event. Figure 2c presents the alignment of one ancestral chromosome and triplicates blocks of genes in the three rosid genomes.
Ancestral gene family content, origin and history of angiosperm genes
To investigate the ancestral gene content and evolution of genes families in the different lineages of the land plant phylogeny, protein coding genes from 22 sequenced land-plants were clustered into 53,136 orthogroups. Subsequent clustering merged those orthogroups into 6054 super-orthogroups. Changes in genes families are more important for terminal branches, and the branch leading to all angiosperms. Additional analysis including spruce genome, gymnosperm and basal angiosperm transcript assemblies led to the identification of 1179 orthogroups which seems to be specific to angiosperms.
We discussed the fact that this clustering method is based on BLASTp analyses. Amino acid sequences are not necessarily well conserved between distantly related proteins, and cutoffs used for clustering influence the number of inferred unique gene families. Most genes lineages (70%) with function linked to flowering were present in the most recent common ancestor of all seed plants, highlighting the fact that novelty is generally not linked with the emergence of drastically new gene families.
They further detailed gene family expansions linked with flowering, such as the MADS-box transcription factors, seed storage globulins and cell wall and lignin genes.
Transposable elements
One striking feature of the A. trichopoda genome is that average age of identifiable transposable elements (TEs) in A. trichopoda is considerably older than that of other angiosperm genomes. Terminal repeats of LTR retrotransposons presented extensive degree of divergence. Endogenous pararetroviruses (EPRVs) and TEs still account for 57.2% of the nonambiguous nucleotides in the A. trichopoda genome (668 Mb), but only few TEs families presented signal of recent activity, with an estimated insertion date of more than 10Ma for most of the TEs. The lack of recent transposon activity in the A. trichopoda genome may be due to very effective silencing or the loss of active transposases.
Population genomics and conservation
They finally investigated population history and structure of Amborella. Twelve genomes of 12 individuals sampled from nearly all known populations from New Caledionia were resequenced. The Pairwise Sequentially Markovian Coalescent (PSMC) method, which uses Single Nucleotide Polymorphism (SNP) data to infer past changes in effective population size, was used to investigate population history of the 12 Amborella populations (Figure 3). The coalescent time of the 12 genomes was estimated to be 9.0-2Ma. They discussed evidences suggesting population bottlenecks, sub-lineages admixture and reduction in effective population size in recent past. Nevertheless, given the boostrap clouds visible on Figure 2, those results are not strongly supported by the data. The number of identified SNP varied importantly depending the parameters used for the SNP calling: from 1,903,437 SNP with stringent parameters to 5,131,595 SNP with less stringent parameters. As the median read depth was quite low for some samples (6X for several samples), the less stringent analysis was retained to perform the subsequent PSMC and population structure analysis, casting doubt on the value of those results.

In conclusion, the analysis of the draft genome sequence of this basal Angiosperm gave first hints of the genome architecture and gene content of ancestral flowering plants, and promises to be a valuable tool for the investigation of the evolution of flowering plants.
., Albert, V., Barbazuk, W., dePamphilis, C., Der, J., Leebens-Mack, J., Ma, H., Palmer, J., Rounsley, S., Sankoff, D., Schuster, S., Soltis, D., Soltis, P., Wessler, S., Wing, R., Albert, V., Ammiraju, J., Barbazuk, W., Chamala, S., Chanderbali, A., dePamphilis, C., Der, J., Determann, R., Leebens-Mack, J., Ma, H., Ralph, P., Rounsley, S., Schuster, S., Soltis, D., Soltis, P., Talag, J., Tomsho, L., Walts, B., Wanke, S., Wing, R., Albert, V., Barbazuk, W., Chamala, S., Chanderbali, A., Chang, T., Determann, R., Lan, T., Soltis, D., Soltis, P., Arikit, S., Axtell, M., Ayyampalayam, S., Barbazuk, W., Burnette, J., Chamala, S., De Paoli, E., dePamphilis, C., Der, J., Estill, J., Farrell, N., Harkess, A., Jiao, Y., Leebens-Mack, J., Liu, K., Mei, W., Meyers, B., Shahid, S., Wafula, E., Walts, B., Wessler, S., Zhai, J., Zhang, X., Albert, V., Carretero-Paulet, L., dePamphilis, C., Der, J., Jiao, Y., Leebens-Mack, J., Lyons, E., Sankoff, D., Tang, H., Wafula, E., Zheng, C., Albert, V., Altman, N., Barbazuk, W., Carretero-Paulet, L., dePamphilis, C., Der, J., Estill, J., Jiao, Y., Leebens-Mack, J., Liu, K., Mei, W., Wafula, E., Altman, N., Arikit, S., Axtell, M., Chamala, S., Chanderbali, A., Chen, F., Chen, J., Chiang, V., De Paoli, E., dePamphilis, C., Der, J., Determann, R., Fogliani, B., Guo, C., Harholt, J., Harkess, A., Job, C., Job, D., Kim, S., Kong, H., Leebens-Mack, J., Li, G., Li, L., Liu, J., Ma, H., Meyers, B., Park, J., Qi, X., Rajjou, L., Burtet-Sarramegna, V., Sederoff, R., Shahid, S., Soltis, D., Soltis, P., Sun, Y., Ulvskov, P., Villegente, M., Xue, J., Yeh, T., Yu, X., Zhai, J., Acosta, J., Albert, V., Barbazuk, W., Bruenn, R., Chamala, S., de Kochko, A., dePamphilis, C., Der, J., Herrera-Estrella, L., Ibarra-Laclette, E., Kirst, M., Leebens-Mack, J., Pissis, S., Poncet, V., Schuster, S., Soltis, D., Soltis, P., & Tomsho, L. (2013). The Amborella Genome and the Evolution of Flowering Plants Science, 342 (6165), 1241089-1241089 DOI: 10.1126/science.1241089
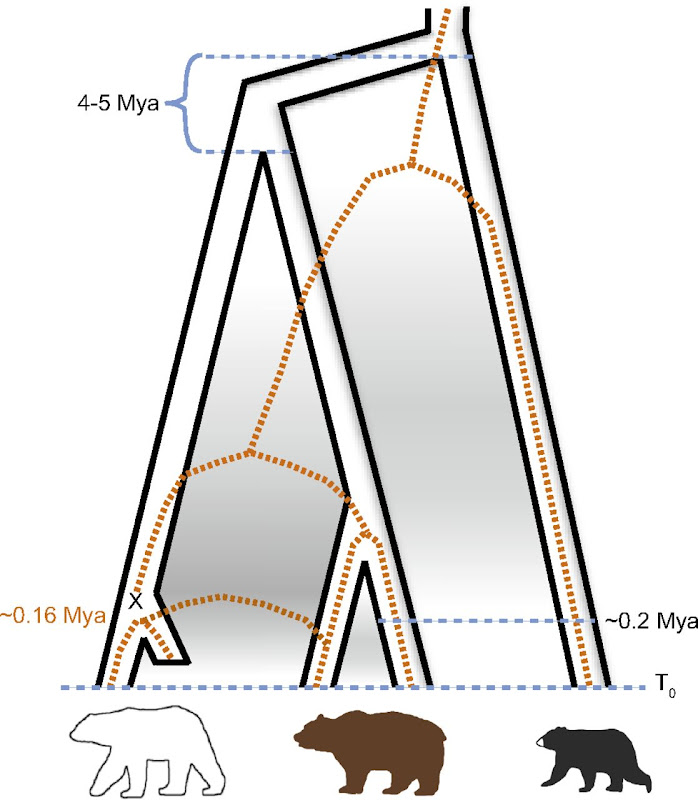
]]>- Polar bear underwent a very rapid and recent (less than 200 ky ago) adaptation to extreme environment (previously not seen in mammals)
- Brown bear is a paraphyletic taxon, as polar bear is the sister specie of the ABC bears (see Fig. 1)
 |
||
| Fig. 1: Miller et al., Polar and brown bear genomes reveal ancient admixture and demographic footprints of past climate change, PNAS 2012 |
| Fig. 2: Miller et al., Polar and brown bear genomes reveal ancient admixture and demographic footprints of past climate change, PNAS 2012 |
 |
||
| Fig. 3: Miller et al., Polar and brown bear genomes reveal ancient admixture and demographic footprints of past climate change, PNAS 2012 |
 |
|
| Fig. 4: Miller et al., Polar and brown bear genomes reveal ancient admixture and demographic footprints of past climate change, PNAS 2012 |
 |
| Fig. 5: Miller et al., Polar and brown bear genomes reveal ancient admixture and demographic footprints of past climate change, PNAS 2012 |
 |
||
| Fig. 5: Miller et al., Polar and brown bear genomes reveal ancient admixture and demographic footprints of past climate change, PNAS 2012 |
 |
| Fig. 6: Miller et al., Polar and brown bear genomes reveal ancient admixture and demographic footprints of past climate change, PNAS 2012 |
I think that to address the subject of adaptation in polar bear, a study of positive selection in protein-coding gene is lacking. As authors already conducted transcriptome sequencing of polar and brown bears, annotating gene in their genome, selecting orthologous genes together with other copies from completely sequenced genomes, as dog, panda and other mammals, and then using a model to test for positive selection such as implemented in PAML would be an efficient way to identify genes of interest in the polar (or ABC) bears. Nevertheless, I am very well aware of the tremendous amount of work already performed in this PNAS paper.
 |
| Fig. 6: Miller et al., Polar and brown bear genomes reveal ancient admixture and demographic footprints of past climate change, PNAS 2012 |
- The bump in the polar bear curve signified as the “Post Eemian increase” was not significant when looking at the 95% interval range in the supplementary material
- Knowing from the previous part of the article the extended hybridization between ABC and polar bears, would not the diversity introduced during those event affect the effective population size reconstruction ?
Hailer F, Kutschera VE, Hallström BM, Klassert D, Fain SR, Leonard JA, Arnason U, & Janke A (2012). Nuclear genomic sequences reveal that polar bears are an old and distinct bear lineage. Science (New York, N.Y.), 336 (6079), 344-347 PMID: 22517859
Miller W, Schuster SC, Welch AJ, Ratan A, Bedoya-Reina OC, Zhao F, Kim HL, Burhans RC, Drautz DI, Wittekindt NE, Tomsho LP, Ibarra-Laclette E, Herrera-Estrella L, Peacock E, Farley S, Sage GK, Rode K, Obbard M, Montiel R, Bachmann L, Ingólfsson O, Aars J, Mailund T, Wiig O, Talbot SL, & Lindqvist C (2012). Polar and brown bear genomes reveal ancient admixture and demographic footprints of past climate change. Proceedings of the National Academy of Sciences of the United States of America, 109 (36) PMID: 22826254
 |
| An example of classic selective sweep pattern. As the distance from the selected nucleotide increases, diversity increases. Fig. 2 from Hernandez et al. 2011. |
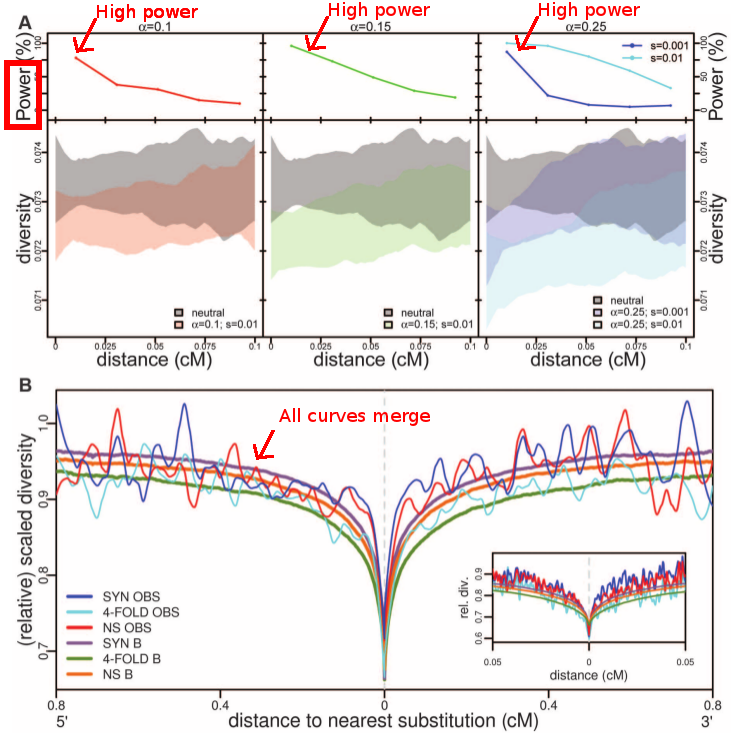 |
| Comparison of simulations under a neutral model with a model with selection, and the actual human genomes data. What is interesting in panel A is that the power is strong for all fractions of the genome under selection the authors tested (alpha parameter). Therefore the authors claim that if classic selective sweeps are frequent in the population, we should be able to detect a significant departure from neutrality. Panel B completes the argument as we can see that all curves (neutral model and human genome data) are merged. Considering that we should have the power to detect a departure from neutrality, the authors claim that the neutral scenario cannot be rejected. Fig. 3 from Hernandez et al. 2011. |
Hernandez, R., Kelley, J., Elyashiv, E., Melton, S., Auton, A., McVean, G., , ., Sella, G., & Przeworski, M. (2011). Classic Selective Sweeps Were Rare in Recent Human Evolution Science, 331 (6019), 920-924 DOI: 10.1126/science.1198878
]]>