Difference between revisions of "Control of mitosis in fission yeast"
| (16 intermediate revisions by the same user not shown) | |||
| Line 13: | Line 13: | ||
- The same diffusion constant "D" | - The same diffusion constant "D" | ||
| − | |||
| + | Equations: | ||
| − | |||
| − | + | [[File:capture.JPG]] | |
| + | M(x) is the concentration and S(x) the source. The constants are: the diffusion term "D", the phosphorylation rate "k", the degradation term "α" | ||
| + | |||
| + | Graphs: | ||
| + | |||
| + | blue = M0 ; red = M1 ; black = M0+M1 = Mtot | ||
| + | |||
| + | [[File:plotk43.png]] | ||
| + | |||
| + | [[File:kapa2.png]] | ||
| + | |||
| + | [[File:plotk4.png]] | ||
| + | |||
| + | |||
| + | |||
| + | '''Conclusion''': These graphs show the effects of the phosphorylation rate k on the concentration of Pom1. We fixe the others terms to fit the curve with the observed Pom1 gradient. We can see that Mtot does not differ from a graph to another. This means that kappa has no influence on the final gradient in the model. Kappa only influences the contribution of each curve M0 and M1 to the final gradient. As we can see, with a small kappa value (kappa = 1/3), we have M1 > M0 and with a big kappa value (kappa = 4), we have M0>M1. It is consistent with biological facts: if the phosphorylation rate is small, the molecules will diffuse principally in the non-phosphorylated state an the ones which are phosphorlyted are rapidly detached from the membrane. Whereas the phosphorylation rate is high, the molecules will diffuses principally in the phosphorylation state, but this mass of molecules will not be removed rapidly from the membrane because of their numbers. | ||
'''Supervisor''': [[User:Sascha|Sascha Dalessi]] | '''Supervisor''': [[User:Sascha|Sascha Dalessi]] | ||
| Line 26: | Line 40: | ||
'''Students''': Degrugillier Lucas, Delapierre Fabien, Merçay Johan. | '''Students''': Degrugillier Lucas, Delapierre Fabien, Merçay Johan. | ||
| − | '''Presentations''': [ | + | '''Presentations''': |
| − | + | [[File:Présentation_midterm.ppt]],[[File:Présentation_Finale.ppt]] | |
Latest revision as of 22:59, 31 May 2012
Background: Fission yeast cells growth up to a given size and then enters mitosis. The question this project addresses is how does the cell knows it has reached to right size for division. This is achieved by a gradient of the pom1 protein along the cortex.
Biological aspects: Pom1 is a protein which forms a cortical intracellular gradient that permits to control the entry of mitosis of the fission yeast, Schizosaccharomyces pombe. The fact is that interaction of Pom1 with Cdr2 induces a cell cycle delay following to a gene activation cascade. Microtubules recruits proteins Pom1 parts of the membrane and bind to the cell poles. Then Pom1 will migrate along the membrane. They undergo five autophosphorylation cycles, which increases the probability of detachment of them. When the cells are large enough, the quantity at the equator of Pom1 attached to the membrane is not sufficient to inhibits mitosis and thus Cdr2.
Goal: The goal is to mathematically describe the mechanism by which such a gradient is achieved using differential equation and analyze such gradients from fluorescence microscopy images.
Mathematical tools: We use a diffusion equation based on partial differential equation to modelize Pom1 gradient. We use first mathematica to resolve a simple case. We use then matlab for numerical analysis of more complex cases.
Results: Here we show the results we obtain for the following model :
- Two steps of phosphorylation (phosphorylated and non-phosphorylated)
- The same diffusion constant "D"
Equations:
M(x) is the concentration and S(x) the source. The constants are: the diffusion term "D", the phosphorylation rate "k", the degradation term "α"
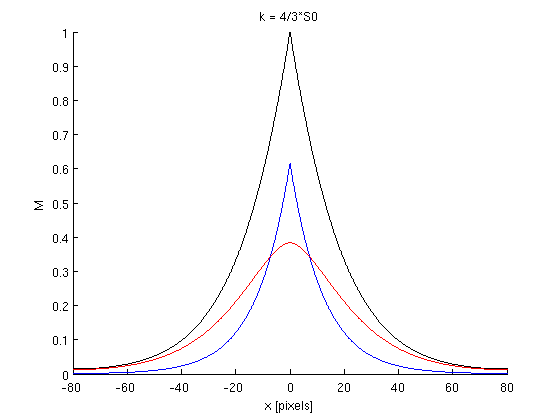
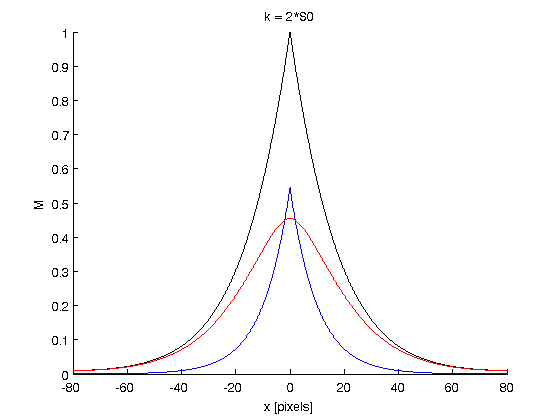
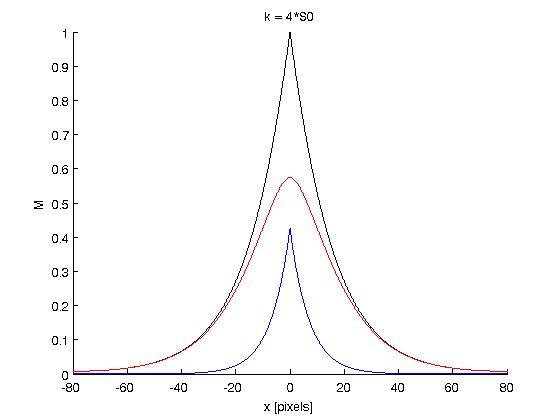
Graphs:
blue = M0 ; red = M1 ; black = M0+M1 = Mtot
Conclusion: These graphs show the effects of the phosphorylation rate k on the concentration of Pom1. We fixe the others terms to fit the curve with the observed Pom1 gradient. We can see that Mtot does not differ from a graph to another. This means that kappa has no influence on the final gradient in the model. Kappa only influences the contribution of each curve M0 and M1 to the final gradient. As we can see, with a small kappa value (kappa = 1/3), we have M1 > M0 and with a big kappa value (kappa = 4), we have M0>M1. It is consistent with biological facts: if the phosphorylation rate is small, the molecules will diffuse principally in the non-phosphorylated state an the ones which are phosphorlyted are rapidly detached from the membrane. Whereas the phosphorylation rate is high, the molecules will diffuses principally in the phosphorylation state, but this mass of molecules will not be removed rapidly from the membrane because of their numbers.
Supervisor: Sascha Dalessi
Students: Degrugillier Lucas, Delapierre Fabien, Merçay Johan.
Presentations: File:Présentation midterm.ppt,File:Présentation Finale.ppt
References: <biblio>
- hachet10 pmid=21703453
- Martin SG, Berthelot-Grosjean M. Polar gradients of the DYRK-family kinase Pom1 couple cell length with the cell cycle. Nature. 2009 Jun 11;459(7248):852-6. Epub 2009 May 27. pmid:19474792. PubMed
- Wartlick O, Kicheva A, González-Gaitán M. Morphogen gradient formation. Cold Spring Harb Perspect Biol. 2009 Sep;1(3):a001255. pmid:20066104 PubMed
</biblio>
Back to UNIL BSc course: "Solving Biological Problems that require Math 2012"


