
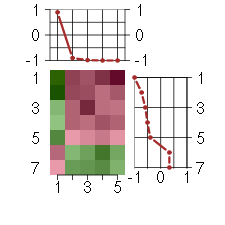

Under-expression is coded with green,
over-expression with red color.
CYP3A4cytochrome P450, family 3, subfamily A, polypeptide 4 (205998_x_at), score: 0.89 EMCNendomucin (219436_s_at), score: -1 OLFML2Bolfactomedin-like 2B (213125_at), score: -0.99 RASGRP3RAS guanyl releasing protein 3 (calcium and DAG-regulated) (205801_s_at), score: -1 SDPRserum deprivation response (phosphatidylserine binding protein) (218711_s_at), score: -0.9
| Id | sample | Experiment | ExpName | Array | Syndrome | Cell.line |
|---|---|---|---|---|---|---|
| E-TABM-263-raw-cel-1515485871.cel | 12 | 6 | Cycle | hgu133a2 | none | Cycle 1 |
| E-TABM-263-raw-cel-1515485691.cel | 3 | 6 | Cycle | hgu133a2 | none | Cycle 1 |
| E-TABM-263-raw-cel-1515486211.cel | 29 | 6 | Cycle | hgu133a2 | none | Cycle 1 |
| E-TABM-263-raw-cel-1515485711.cel | 4 | 6 | Cycle | hgu133a2 | none | Cycle 1 |
| E-TABM-263-raw-cel-1515485951.cel | 16 | 6 | Cycle | hgu133a2 | none | Cycle 1 |
| E-TABM-263-raw-cel-1515486351.cel | 36 | 6 | Cycle | hgu133a2 | none | Cycle 1 |
| E-TABM-263-raw-cel-1515485811.cel | 9 | 6 | Cycle | hgu133a2 | none | Cycle 1 |
![]()

