Previous module |
Next module
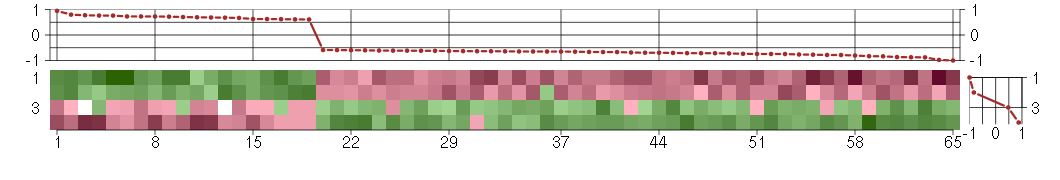
Module #324, TG: 3.4, TC: 1.8, 65 probes, 65 Entrez genes, 4 conditions


HELP
The image plot shows the color-coded level of gene expression, for the
genes and conditions in a given transcription module. The genes are on
the horizontal, the conditions on the vertical axis.
The genes are ordered according to their ISA gene scores, similarly
the conditions are ordered according to their condition scores. The
score of a gene means the «degree of inclusion» in
the module: a high score gene is essential in the module.
Condition scores can also be negative, that means that the genes of
the module are all down-regulated in the condition. Here the absolute
value of the score gives the «degree of inclusion».
The plots above and beside the expression matrix show the gene scores
and condition scores, respectively.
Note that the plot is interactive, you can see the name of the gene
and condition under the mouse cursor.
The expression matrix was normalized to have mean zero and standard
deviation one for every gene separately across all conditions
(i.e. not just for the conditions in the module).
— Click on the Help button again to close this help window.

Under-expression is coded with green,
over-expression with red color.
Help |
Hide |
Top
Help |
Show |
Top
The GO tree — Biological processes
HELP
This is one of three sections showing Gene Ontology enrichment of the
current module: in this case for biological processes.
The graph shows the hierarchy of the GO categories, their enrichment
for the current module is color coded, and the blue number beside the
category is the minus log ten p-value of the enrichment. (Calculated
using the standard hypergeometric test.) The color of the arrows code
«is a» (cyan) and «part of» relationships.
The tree was built the following way. First all GO terms with more
significant enrichment p-value than 0.05 were collected. Then all
paths from these terms to the root node of the GO tree were included
too. If a GO term is included more than once in the tree, then the
green numbers show 1) the id of the node, this makes it easier to find
other appereances of the term, and 2) the number of appearences.
Note that the same GO category might show up on the graph many
times. This is because the GO was «straightened» for this
graph, i.e. if there are more paths from a GO term to the root node of
the tree, all of them are included. The green numbers
Move the mouse cursor over the terms to get their definition. Clicking
on them takes you to the corresponding Gene Ontology web page.
If you cannot see a graph here at all, that means that there were no
significantly enriched GO categories, at the 0.05 level.
— Click on the Help button again to close this help window.
Help |
Hide |
Top
Help |
Show |
Top
The GO tree — Cellular Components
HELP
This is one of three sections showing Gene Ontology enrichment of the
current module: in this case for cellular components.
The graph shows the hierarchy of the GO categories, their enrichment
for the current module is color coded, and the blue number beside the
category is the minus log ten p-value of the enrichment. (Calculated
using the standard hypergeometric test.) The color of the arrows code
«is a» (cyan) and «part of» relationships.
The tree was built the following way. First all GO terms with more
significant enrichment p-value than 0.05 were collected. Then all
paths from these terms to the root node of the GO tree were included
too. If a GO term is included more than once in the tree, then the
green numbers show 1) the id of the node, this makes it easier to find
other appereances of the term, and 2) the number of appearences.
Note that the same GO category might show up on the graph many
times. This is because the GO was «straightened» for this
graph, i.e. if there are more paths from a GO term to the root node of
the tree, all of them are included. The green numbers
Move the mouse cursor over the terms to get their definition. Clicking
on them takes you to the corresponding Gene Ontology web page.
If you cannot see a graph here at all, that means that there were no
significantly enriched GO categories, at the 0.05 level.
— Click on the Help button again to close this help window.
Help |
Hide |
Top
Help |
Show |
Top
The GO tree — Molecular Function
HELP
This is one of three sections showing Gene Ontology enrichment of the
current module: in this case for molecular function.
The graph shows the hierarchy of the GO categories, their enrichment
for the current module is color coded, and the blue number beside the
category is the minus log ten p-value of the enrichment. (Calculated
using the standard hypergeometric test.) The color of the arrows code
«is a» (cyan) and «part of» relationships.
The tree was built the following way. First all GO terms with more
significant enrichment p-value than 0.05 were collected. Then all
paths from these terms to the root node of the GO tree were included
too. If a GO term is included more than once in the tree, then the
green numbers show 1) the id of the node, this makes it easier to find
other appereances of the term, and 2) the number of appearences.
Note that the same GO category might show up on the graph many
times. This is because the GO was «straightened» for this
graph, i.e. if there are more paths from a GO term to the root node of
the tree, all of them are included. The green numbers
Move the mouse cursor over the terms to get their definition. Clicking
on them takes you to the corresponding Gene Ontology web page.
If you cannot see a graph here at all, that means that there were no
significantly enriched GO categories, at the 0.05 level.
— Click on the Help button again to close this help window.
protein binding
Interacting selectively with any protein or protein complex (a complex of two or more proteins that may include other nonprotein molecules).
molecular_function
Elemental activities, such as catalysis or binding, describing the actions of a gene product at the molecular level. A given gene product may exhibit one or more molecular functions.
receptor binding
Interacting selectively with one or more specific sites on a receptor molecule, a macromolecule that undergoes combination with a hormone, neurotransmitter, drug or intracellular messenger to initiate a change in cell function.
MAP-kinase scaffold activity
Functions as a physical support for the assembly of a multiprotein mitogen-activated protein kinase (MAPK) complex. MAPK scaffold proteins have binding sites for MAPK pathway kinases as well as for upstream signaling proteins.
hormone activity
The action characteristic of a hormone, any substance formed in very small amounts in one specialized organ or group of cells and carried (sometimes in the bloodstream) to another organ or group of cells in the same organism, upon which it has a specific regulatory action. The term was originally applied to agents with a stimulatory physiological action in vertebrate animals (as opposed to a chalone, which has a depressant action). Usage is now extended to regulatory compounds in lower animals and plants, and to synthetic substances having comparable effects; all bind receptors and trigger some biological process.
structural molecule activity
The action of a molecule that contributes to the structural integrity of a complex or assembly within or outside a cell.
binding
The selective, often stoichiometric, interaction of a molecule with one or more specific sites on another molecule.
receptor signaling complex scaffold activity
Functions to provide a physical support for the assembly of a multiprotein receptor signaling complex.
protein complex scaffold
Functions to provide a physical support for the assembly of a multiprotein complex.
all
This term is the most general term possible
protein complex scaffold
Functions to provide a physical support for the assembly of a multiprotein complex.
Help |
Hide |
Top
Help |
Show |
Top
GO BP test for over-representation
HELP
List of all enriched GO categories (biological processes), at the 0.05
p-value level.
The columns:
- ExpCount is the expected count of genes in the
module annotated with the given GO term, just by chance.
- Count
is the number of genes in the module annotated with the given GO
term.
- Size is the total number of genes (in our universe)
annotated with the GO term.
Clicking on Count shows the genes that drive the
enrichment. You can also click on the individual numbers in
the Count column, to show the driving genes for that individual
GO category.
Clicking on the GO identifiers takes you to the Gene Ontology web
pages.
— Click on the Help button again to close this help window.
| Id | Pvalue | ExpCount | Count | Size | Term |
| GO:0042541 | 1.938e-02 | 0.02613 | 2
EPO, INHA | 4 | hemoglobin biosynthetic process |
| GO:0006978 | 2.804e-02 | 0.03266 | 2
HIPK2, RBM38 | 5 | DNA damage response, signal transduction by p53 class mediator resulting in transcription of p21 class mediator |
| GO:0020027 | 2.804e-02 | 0.03266 | 2
EPO, INHA | 5 | hemoglobin metabolic process |
| GO:0042772 | 2.804e-02 | 0.03266 | 2
HIPK2, RBM38 | 5 | DNA damage response, signal transduction resulting in transcription |
| GO:0007165 | 4.101e-02 | 11.55 | 22
ADORA1, ADRA1D, AMELX, BCAM, BRAF, CD79B, CNTLN, CYTH4, EPO, GARNL1, GAST, HIPK2, INHA, ITGAL, ITPR1, KRT8, LILRB3, MAPK8IP2, OPRL1, RBM38, RLN1, TMPRSS6 | 1768 | signal transduction |
| GO:0007154 | 4.388e-02 | 12.46 | 23
ADORA1, ADRA1D, AMELX, BCAM, BRAF, CD79B, CNTLN, CYTH4, EPO, GARNL1, GAST, HIPK2, INHA, ITGAL, ITPR1, KRT8, LILRB3, MAPK8IP2, OPRL1, RBM38, RLN1, SEPT5, TMPRSS6 | 1908 | cell communication |
Help |
Hide |
Top
Help |
Show |
Top
GO CC test for over-representation
HELP
List of all enriched GO categories (cellular components), at the 0.05
p-value level.
The columns:
- ExpCount is the expected count of genes in the
module annotated with the given GO term, just by chance.
- Count
is the number of genes in the module annotated with the given GO
term.
- Size is the total number of genes (in our universe)
annotated with the GO term.
Clicking on Count shows the genes that drive the
enrichment. You can also click on the individual numbers in
the Count column, to show the driving genes for that individual
GO category.
Clicking on the GO identifiers takes you to the Gene Ontology web
pages.
— Click on the Help button again to close this help window.
| Id | Pvalue | ExpCount | Count | Size | Term |
| GO:0005576 | 4.785e-02 | 4.737 | 12
ADAMTS7, AMELX, APOC4, EPO, GAST, IGHG1, IL23A, INHA, LILRA5, MUC5AC, RLN1, WFDC8 | 673 | extracellular region |
Help |
Hide |
Top
Help |
Show |
Top
GO MF test for over-representation
HELP
List of all enriched GO categories (molecular function), at the 0.05
p-value level.
The columns:
- ExpCount is the expected count of genes in the
module annotated with the given GO term, just by chance.
- Count
is the number of genes in the module annotated with the given GO
term.
- Size is the total number of genes (in our universe)
annotated with the GO term.
Clicking on Count shows the genes that drive the
enrichment. You can also click on the individual numbers in
the Count column, to show the driving genes for that individual
GO category.
Clicking on the GO identifiers takes you to the Gene Ontology web
pages.
— Click on the Help button again to close this help window.
| Id | Pvalue | ExpCount | Count | Size | Term |
| GO:0005179 | 5.665e-03 | 0.1912 | 4
EPO, GAST, INHA, RLN1 | 27 | hormone activity |
| GO:0005078 | 7.341e-03 | 0.01416 | 2
MAPK8IP1, MAPK8IP2 | 2 | MAP-kinase scaffold activity |
Help |
Hide |
Top
Help |
Show |
Top
KEGG Pathway test for over-representation
HELP
List of all enriched KEGG pathways, at the 0.05
p-value level.
The columns:
- ExpCount is the expected count of genes in the
module annotated with the given KEGG pathway, just by chance.
- Count
is the number of genes in the module annotated with the given KEGG
pathway.
- Size is the total number of genes (in our universe)
annotated with the KEGG pathway.
Clicking on Count shows the genes that drive the
enrichment. You can also click on the individual numbers in
the Count column, to show the driving genes for that individual
KEGG pathway.
Clicking on the KEGG identifiers takes you to the KEGG web site.
— Click on the Help button again to close this help window.
| Id | Pvalue | ExpCount | Count | Size | Term |
| 04950 | 3.215e-02 | 0.0372 | 2
PAX4, PKLR | 5 | Maturity onset diabetes of the young |
Help |
Hide |
Top
Help |
Show |
Top
miRNA test for over-representation
HELP
List of all enriched miRNA families, at the 0.05
p-value level.
The columns:
- ExpCount is the expected count of genes in the
module regulated by the given miRNA family, just by chance.
- Count
is the number of genes in the module regulated by the given miRNA
family.
- Size is the total number of genes (in our universe)
regulated with the given miRNA family.
Clicking on Count shows the genes that drive the
enrichment. You can also click on the individual numbers in
the Count column, to show the driving genes for that individual
miRNA family.
The miRNA regulation data was taken from the TargetScan database.
(Only the conserved sites were used for the current analysis.)
Clicking on the miRNA names takes you to the TargetScan web site.
— Click on the Help button again to close this help window.
Help |
Hide |
Top
Help |
Show |
Top
Chromosome test for over-representation
HELP
List of all enriched Chromosomes, at the 0.05
p-value level.
The columns:
- ExpCount is the expected number of genes in the
module on the given chromosome, just by chance.
- Count
is the number of genes in the module on the given chromosome.
- Size is the total number of genes (in our universe)
on the given chromosome.
Clicking on Count shows the genes that drive the
enrichment. You can also click on the individual numbers in
the Count column, to show the driving genes for that individual
chromosome.
— Click on the Help button again to close this help window.
HELP
A list of all genes in the current module, in alphabetical order. The
size of the text corresponds to the gene scores.
Note that some gene symbols may show up more than once, if many
probes match the same Entrez gene.
Genes with no Entrez mapping are given separately, with their
Affymetrics probe ID.
— Click on the Help button again to close this help window.
Entrez genes
ABCA7ATP-binding cassette, sub-family A (ABC1), member 7 (219577_s_at), score: -0.98
ACTR8ARP8 actin-related protein 8 homolog (yeast) (218658_s_at), score: 0.61
ADAMTS7ADAM metallopeptidase with thrombospondin type 1 motif, 7 (220705_s_at), score: -0.64
ADORA1adenosine A1 receptor (216220_s_at), score: -0.66
ADRA1Dadrenergic, alpha-1D-, receptor (210961_s_at), score: -0.61
AMELXamelogenin (amelogenesis imperfecta 1, X-linked) (208410_x_at), score: -0.62
ANKRD46ankyrin repeat domain 46 (212731_at), score: 0.68
APOC4apolipoprotein C-IV (206738_at), score: -0.61
ASPHD1aspartate beta-hydroxylase domain containing 1 (214993_at), score: -0.77
BCAMbasal cell adhesion molecule (Lutheran blood group) (40093_at), score: -0.69
BRAFv-raf murine sarcoma viral oncogene homolog B1 (206044_s_at), score: 0.95
C18orf1chromosome 18 open reading frame 1 (209574_s_at), score: 0.69
CCDC40coiled-coil domain containing 40 (220592_at), score: -0.76
CD79BCD79b molecule, immunoglobulin-associated beta (205297_s_at), score: -0.64
CNNM3cyclin M3 (220739_s_at), score: 0.61
CNTLNcentlein, centrosomal protein (220095_at), score: 0.73
CYorf15Bchromosome Y open reading frame 15B (214131_at), score: -0.65
CYTH4cytohesin 4 (219183_s_at), score: -0.6
EPOerythropoietin (217254_s_at), score: -0.59
EPS8L1EPS8-like 1 (218778_x_at), score: -0.74
EXPH5exophilin 5 (214734_at), score: 0.72
FKBP10FK506 binding protein 10, 65 kDa (219249_s_at), score: -1
GARNL1GTPase activating Rap/RanGAP domain-like 1 (214855_s_at), score: 0.63
GASTgastrin (208138_at), score: -0.87
GBA3glucosidase, beta, acid 3 (cytosolic) (219954_s_at), score: -0.65
HAB1B1 for mucin (215778_x_at), score: -0.64
HIPK2homeodomain interacting protein kinase 2 (219028_at), score: -0.66
IGHG1immunoglobulin heavy constant gamma 1 (G1m marker) (211693_at), score: -0.87
IL23Ainterleukin 23, alpha subunit p19 (211796_s_at), score: -0.71
INHAinhibin, alpha (210141_s_at), score: -0.75
ITGALintegrin, alpha L (antigen CD11A (p180), lymphocyte function-associated antigen 1; alpha polypeptide) (213475_s_at), score: -0.65
ITPR1inositol 1,4,5-triphosphate receptor, type 1 (203710_at), score: 0.78
KRT8keratin 8 (209008_x_at), score: -0.7
KRT8P12keratin 8 pseudogene 12 (222060_at), score: -0.81
LILRA5leukocyte immunoglobulin-like receptor, subfamily A (with TM domain), member 5 (215838_at), score: -0.84
LILRB3leukocyte immunoglobulin-like receptor, subfamily B (with TM and ITIM domains), member 3 (211133_x_at), score: -0.65
LOC100128919similar to HSPC157 (219865_at), score: 0.76
MAPK8IP1mitogen-activated protein kinase 8 interacting protein 1 (213013_at), score: -0.88
MAPK8IP2mitogen-activated protein kinase 8 interacting protein 2 (205050_s_at), score: -0.62
MGC13053hypothetical MGC13053 (211775_x_at), score: 0.73
MLLT3myeloid/lymphoid or mixed-lineage leukemia (trithorax homolog, Drosophila); translocated to, 3 (204918_s_at), score: 0.67
MUC5ACmucin 5AC, oligomeric mucus/gel-forming (217182_at), score: -0.72
MYO15Amyosin XVA (220288_at), score: -0.7
NPEPL1aminopeptidase-like 1 (89476_r_at), score: -0.59
OPRL1opiate receptor-like 1 (206564_at), score: -0.67
PAX4paired box 4 (207867_at), score: 0.69
PHC1polyhomeotic homolog 1 (Drosophila) (218338_at), score: 0.62
PHF2PHD finger protein 2 (212726_at), score: 0.73
PKLRpyruvate kinase, liver and RBC (222078_at), score: -0.71
POM121L2POM121 membrane glycoprotein-like 2 (rat) (216582_at), score: -0.83
RBM12BRNA binding motif protein 12B (51228_at), score: 0.8
RBM38RNA binding motif protein 38 (212430_at), score: -0.7
RLN1relaxin 1 (211753_s_at), score: -0.63
RNF121ring finger protein 121 (219021_at), score: -0.71
SCLYselenocysteine lyase (221575_at), score: 0.76
SEPT5septin 5 (209767_s_at), score: -0.75
SLC5A5solute carrier family 5 (sodium iodide symporter), member 5 (211123_at), score: -0.59
SSX3synovial sarcoma, X breakpoint 3 (215881_x_at), score: -0.63
ST8SIA3ST8 alpha-N-acetyl-neuraminide alpha-2,8-sialyltransferase 3 (208064_s_at), score: -0.74
SUV39H2suppressor of variegation 3-9 homolog 2 (Drosophila) (219262_at), score: 0.63
TAF15TAF15 RNA polymerase II, TATA box binding protein (TBP)-associated factor, 68kDa (202840_at), score: -0.79
TMPRSS6transmembrane protease, serine 6 (214955_at), score: -0.78
VCPIP1valosin containing protein (p97)/p47 complex interacting protein 1 (219810_at), score: -0.67
WFDC8WAP four-disulfide core domain 8 (215276_at), score: -0.61
ZNF214zinc finger protein 214 (220497_at), score: 0.7
Non-Entrez genes
Unknown, score:
HELP
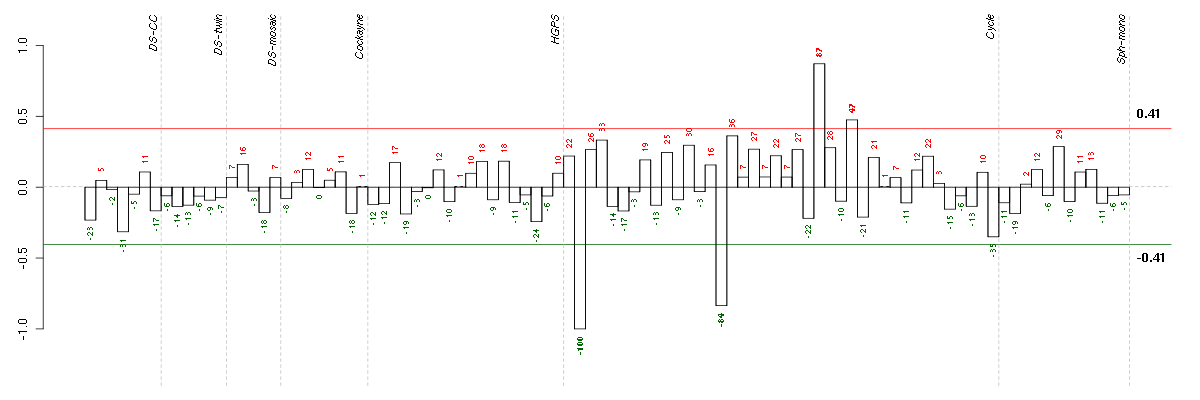
Conditions in the module, given in the same order as on the expression
plot above. Red color means over-expression, green under-expression in
the given condition.
The barplot below shows the condition (sample) scores. A separate bar
is shown for each sample, its height is the corresponding score of the
sample in the module. The red and green numbers on the bars are the
sample scores expressed in percents, i.e. 100% is 1.0.
The red and green lines show the module thresholds, samples above
the red line and below the green line are included in the module.
The different experiments that were part of the study, are separated
by dashed vertical lines.
— Click on the Help button again to close this help window.
| Id | sample | Experiment | ExpName | Array | Syndrome | Cell.line |
| E-TABM-263-raw-cel-1515485671.cel | 2 | 6 | Cycle | hgu133a2 | none | Cycle 1 |
| E-TABM-263-raw-cel-1515485931.cel | 15 | 6 | Cycle | hgu133a2 | none | Cycle 1 |
| E-TABM-263-raw-cel-1515486171.cel | 27 | 6 | Cycle | hgu133a2 | none | Cycle 1 |
| E-TABM-263-raw-cel-1515486111.cel | 24 | 6 | Cycle | hgu133a2 | none | Cycle 1 |


© 2008-2010 Computational Biology Group, Department of Medical Genetics,
University of Lausanne, Switzerland