Previous module |
Next module
Module #554, TG: 3, TC: 2, 88 probes, 87 Entrez genes, 4 conditions


HELP
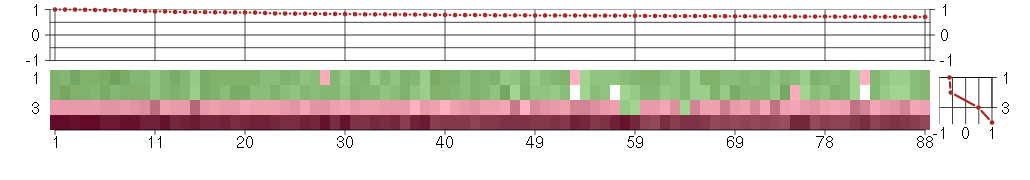
The image plot shows the color-coded level of gene expression, for the
genes and conditions in a given transcription module. The genes are on
the horizontal, the conditions on the vertical axis.
The genes are ordered according to their ISA gene scores, similarly
the conditions are ordered according to their condition scores. The
score of a gene means the «degree of inclusion» in
the module: a high score gene is essential in the module.
Condition scores can also be negative, that means that the genes of
the module are all down-regulated in the condition. Here the absolute
value of the score gives the «degree of inclusion».
The plots above and beside the expression matrix show the gene scores
and condition scores, respectively.
Note that the plot is interactive, you can see the name of the gene
and condition under the mouse cursor.
The expression matrix was normalized to have mean zero and standard
deviation one for every gene separately across all conditions
(i.e. not just for the conditions in the module).
— Click on the Help button again to close this help window.

Under-expression is coded with green,
over-expression with red color.
Help |
Hide |
Top
Help |
Show |
Top
The GO tree — Biological processes
HELP
This is one of three sections showing Gene Ontology enrichment of the
current module: in this case for biological processes.
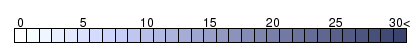
The graph shows the hierarchy of the GO categories, their enrichment
for the current module is color coded, and the blue number beside the
category is the minus log ten p-value of the enrichment. (Calculated
using the standard hypergeometric test.) The color of the arrows code
«is a» (cyan) and «part of» relationships.
The tree was built the following way. First all GO terms with more
significant enrichment p-value than 0.05 were collected. Then all
paths from these terms to the root node of the GO tree were included
too. If a GO term is included more than once in the tree, then the
green numbers show 1) the id of the node, this makes it easier to find
other appereances of the term, and 2) the number of appearences.
Note that the same GO category might show up on the graph many
times. This is because the GO was «straightened» for this
graph, i.e. if there are more paths from a GO term to the root node of
the tree, all of them are included. The green numbers
Move the mouse cursor over the terms to get their definition. Clicking
on them takes you to the corresponding Gene Ontology web page.
If you cannot see a graph here at all, that means that there were no
significantly enriched GO categories, at the 0.05 level.
— Click on the Help button again to close this help window.
Help |
Hide |
Top
Help |
Show |
Top
The GO tree — Cellular Components
HELP
This is one of three sections showing Gene Ontology enrichment of the
current module: in this case for cellular components.
The graph shows the hierarchy of the GO categories, their enrichment
for the current module is color coded, and the blue number beside the
category is the minus log ten p-value of the enrichment. (Calculated
using the standard hypergeometric test.) The color of the arrows code
«is a» (cyan) and «part of» relationships.
The tree was built the following way. First all GO terms with more
significant enrichment p-value than 0.05 were collected. Then all
paths from these terms to the root node of the GO tree were included
too. If a GO term is included more than once in the tree, then the
green numbers show 1) the id of the node, this makes it easier to find
other appereances of the term, and 2) the number of appearences.
Note that the same GO category might show up on the graph many
times. This is because the GO was «straightened» for this
graph, i.e. if there are more paths from a GO term to the root node of
the tree, all of them are included. The green numbers
Move the mouse cursor over the terms to get their definition. Clicking
on them takes you to the corresponding Gene Ontology web page.
If you cannot see a graph here at all, that means that there were no
significantly enriched GO categories, at the 0.05 level.
— Click on the Help button again to close this help window.
Help |
Hide |
Top
Help |
Show |
Top
The GO tree — Molecular Function
HELP
This is one of three sections showing Gene Ontology enrichment of the
current module: in this case for molecular function.
The graph shows the hierarchy of the GO categories, their enrichment
for the current module is color coded, and the blue number beside the
category is the minus log ten p-value of the enrichment. (Calculated
using the standard hypergeometric test.) The color of the arrows code
«is a» (cyan) and «part of» relationships.
The tree was built the following way. First all GO terms with more
significant enrichment p-value than 0.05 were collected. Then all
paths from these terms to the root node of the GO tree were included
too. If a GO term is included more than once in the tree, then the
green numbers show 1) the id of the node, this makes it easier to find
other appereances of the term, and 2) the number of appearences.
Note that the same GO category might show up on the graph many
times. This is because the GO was «straightened» for this
graph, i.e. if there are more paths from a GO term to the root node of
the tree, all of them are included. The green numbers
Move the mouse cursor over the terms to get their definition. Clicking
on them takes you to the corresponding Gene Ontology web page.
If you cannot see a graph here at all, that means that there were no
significantly enriched GO categories, at the 0.05 level.
— Click on the Help button again to close this help window.
Help |
Hide |
Top
Help |
Show |
Top
GO BP test for over-representation
HELP
List of all enriched GO categories (biological processes), at the 0.05
p-value level.
The columns:
- ExpCount is the expected count of genes in the
module annotated with the given GO term, just by chance.
- Count
is the number of genes in the module annotated with the given GO
term.
- Size is the total number of genes (in our universe)
annotated with the GO term.
Clicking on Count shows the genes that drive the
enrichment. You can also click on the individual numbers in
the Count column, to show the driving genes for that individual
GO category.
Clicking on the GO identifiers takes you to the Gene Ontology web
pages.
— Click on the Help button again to close this help window.
Help |
Hide |
Top
Help |
Show |
Top
GO CC test for over-representation
HELP
List of all enriched GO categories (cellular components), at the 0.05
p-value level.
The columns:
- ExpCount is the expected count of genes in the
module annotated with the given GO term, just by chance.
- Count
is the number of genes in the module annotated with the given GO
term.
- Size is the total number of genes (in our universe)
annotated with the GO term.
Clicking on Count shows the genes that drive the
enrichment. You can also click on the individual numbers in
the Count column, to show the driving genes for that individual
GO category.
Clicking on the GO identifiers takes you to the Gene Ontology web
pages.
— Click on the Help button again to close this help window.
Help |
Hide |
Top
Help |
Show |
Top
GO MF test for over-representation
HELP
List of all enriched GO categories (molecular function), at the 0.05
p-value level.
The columns:
- ExpCount is the expected count of genes in the
module annotated with the given GO term, just by chance.
- Count
is the number of genes in the module annotated with the given GO
term.
- Size is the total number of genes (in our universe)
annotated with the GO term.
Clicking on Count shows the genes that drive the
enrichment. You can also click on the individual numbers in
the Count column, to show the driving genes for that individual
GO category.
Clicking on the GO identifiers takes you to the Gene Ontology web
pages.
— Click on the Help button again to close this help window.
| Id | Pvalue | ExpCount | Count | Size | Term |
| GO:0003677 | 4.929e-02 | 9.559 | 20
CBFA2T2, CGGBP1, ELK4, FBXL11, FUBP1, G3BP1, HEY1, HNRNPD, JARID2, MLLT10, NACA, POGZ, POLR1B, XRCC2, ZBTB39, ZNF160, ZNF528, ZNF552, ZNF611, ZNF816A | 1195 | DNA binding |
Help |
Hide |
Top
Help |
Show |
Top
KEGG Pathway test for over-representation
HELP
List of all enriched KEGG pathways, at the 0.05
p-value level.
The columns:
- ExpCount is the expected count of genes in the
module annotated with the given KEGG pathway, just by chance.
- Count
is the number of genes in the module annotated with the given KEGG
pathway.
- Size is the total number of genes (in our universe)
annotated with the KEGG pathway.
Clicking on Count shows the genes that drive the
enrichment. You can also click on the individual numbers in
the Count column, to show the driving genes for that individual
KEGG pathway.
Clicking on the KEGG identifiers takes you to the KEGG web site.
— Click on the Help button again to close this help window.
Help |
Hide |
Top
Help |
Show |
Top
miRNA test for over-representation
HELP
List of all enriched miRNA families, at the 0.05
p-value level.
The columns:
- ExpCount is the expected count of genes in the
module regulated by the given miRNA family, just by chance.
- Count
is the number of genes in the module regulated by the given miRNA
family.
- Size is the total number of genes (in our universe)
regulated with the given miRNA family.
Clicking on Count shows the genes that drive the
enrichment. You can also click on the individual numbers in
the Count column, to show the driving genes for that individual
miRNA family.
The miRNA regulation data was taken from the TargetScan database.
(Only the conserved sites were used for the current analysis.)
Clicking on the miRNA names takes you to the TargetScan web site.
— Click on the Help button again to close this help window.
Help |
Hide |
Top
Help |
Show |
Top
Chromosome test for over-representation
HELP
List of all enriched Chromosomes, at the 0.05
p-value level.
The columns:
- ExpCount is the expected number of genes in the
module on the given chromosome, just by chance.
- Count
is the number of genes in the module on the given chromosome.
- Size is the total number of genes (in our universe)
on the given chromosome.
Clicking on Count shows the genes that drive the
enrichment. You can also click on the individual numbers in
the Count column, to show the driving genes for that individual
chromosome.
— Click on the Help button again to close this help window.
HELP
A list of all genes in the current module, in alphabetical order. The
size of the text corresponds to the gene scores.
Note that some gene symbols may show up more than once, if many
probes match the same Entrez gene.
Genes with no Entrez mapping are given separately, with their
Affymetrics probe ID.
— Click on the Help button again to close this help window.
Entrez genes
ACOT11acyl-CoA thioesterase 11 (216103_at), score: 0.75
ADORA2Aadenosine A2a receptor (205013_s_at), score: 0.9
ALDOAP2aldolase A, fructose-bisphosphate pseudogene 2 (211617_at), score: 0.74
ALMS1Alstrom syndrome 1 (214707_x_at), score: 0.92
APBB2amyloid beta (A4) precursor protein-binding, family B, member 2 (212972_x_at), score: 0.98
BCL9B-cell CLL/lymphoma 9 (204129_at), score: 0.77
C11orf57chromosome 11 open reading frame 57 (218314_s_at), score: 0.74
C17orf86chromosome 17 open reading frame 86 (221621_at), score: 0.75
CBFA2T2core-binding factor, runt domain, alpha subunit 2; translocated to, 2 (207625_s_at), score: 0.72
CDC14ACDC14 cell division cycle 14 homolog A (S. cerevisiae) (205288_at), score: 0.77
CDKN1Ccyclin-dependent kinase inhibitor 1C (p57, Kip2) (213183_s_at), score: 0.89
CGGBP1CGG triplet repeat binding protein 1 (214050_at), score: 0.83
CHI3L1chitinase 3-like 1 (cartilage glycoprotein-39) (209395_at), score: 0.76
CPEcarboxypeptidase E (201117_s_at), score: 0.77
DAPP1dual adaptor of phosphotyrosine and 3-phosphoinositides (219290_x_at), score: 0.9
DAZ4deleted in azoospermia 4 (216351_x_at), score: 0.74
DIP2ADIP2 disco-interacting protein 2 homolog A (Drosophila) (215529_x_at), score: 0.72
DKFZp686O1327hypothetical gene supported by BC043549; BX648102 (216877_at), score: 0.77
DNAH3dynein, axonemal, heavy chain 3 (220725_x_at), score: 0.97
ELK4ELK4, ETS-domain protein (SRF accessory protein 1) (206919_at), score: 0.73
EPB41L1erythrocyte membrane protein band 4.1-like 1 (212339_at), score: 0.74
FBXL11F-box and leucine-rich repeat protein 11 (208989_s_at), score: 0.76
FBXW12F-box and WD repeat domain containing 12 (215600_x_at), score: 0.85
FCARFc fragment of IgA, receptor for (211305_x_at), score: 0.78
FKSG49FKSG49 (211454_x_at), score: 0.71
FLJ11292hypothetical protein FLJ11292 (220828_s_at), score: 1
FLJ23172hypothetical LOC389177 (217016_x_at), score: 0.8
FNBP4formin binding protein 4 (212232_at), score: 0.71
FUBP1far upstream element (FUSE) binding protein 1 (212847_at), score: 0.71
G3BP1GTPase activating protein (SH3 domain) binding protein 1 (222187_x_at), score: 0.99
HCG2P7HLA complex group 2 pseudogene 7 (216229_x_at), score: 0.89
HEY1hairy/enhancer-of-split related with YRPW motif 1 (44783_s_at), score: 0.79
HNRNPDheterogeneous nuclear ribonucleoprotein D (AU-rich element RNA binding protein 1, 37kDa) (213359_at), score: 0.71
IBD12Inflammatory bowel disease 12 (215373_x_at), score: 0.86
JARID2jumonji, AT rich interactive domain 2 (203297_s_at), score: 0.73
LOC100128701heterogeneous nuclear ribonucleoprotein A1-like 2 pseudogene (216497_at), score: 0.76
LOC100128836similar to heterogeneous nuclear ribonucleoprotein A1 (217353_at), score: 0.72
LOC100134401hypothetical protein LOC100134401 (213605_s_at), score: 0.72
LOC152719hypothetical protein LOC152719 (215978_x_at), score: 0.71
LOC643313similar to hypothetical protein LOC284701 (211050_x_at), score: 0.9
LOC647070hypothetical LOC647070 (215467_x_at), score: 0.88
MAP2K7mitogen-activated protein kinase kinase 7 (216206_x_at), score: 0.82
MCL1myeloid cell leukemia sequence 1 (BCL2-related) (214057_at), score: 0.82
MEFVMediterranean fever (208262_x_at), score: 0.75
METAP2methionyl aminopeptidase 2 (202015_x_at), score: 0.84
METTL7Amethyltransferase like 7A (211424_x_at), score: 0.88
MFSD11major facilitator superfamily domain containing 11 (221192_x_at), score: 0.77
MLLT10myeloid/lymphoid or mixed-lineage leukemia (trithorax homolog, Drosophila); translocated to, 10 (216506_x_at), score: 0.77
MRPL44mitochondrial ribosomal protein L44 (218202_x_at), score: 0.75
NACAnascent polypeptide-associated complex alpha subunit (222018_at), score: 0.72
OPHN1oligophrenin 1 (206323_x_at), score: 0.74
PELI2pellino homolog 2 (Drosophila) (219132_at), score: 0.76
POGZpogo transposable element with ZNF domain (215281_x_at), score: 0.81
POLR1Bpolymerase (RNA) I polypeptide B, 128kDa (220113_x_at), score: 0.81
POM121L9PPOM121 membrane glycoprotein-like 9 (rat) pseudogene (222253_s_at), score: 0.78
PRINSpsoriasis associated RNA induced by stress (non-protein coding) (216051_x_at), score: 0.81
RGS5regulator of G-protein signaling 5 (218353_at), score: 0.72
RPL21P37ribosomal protein L21 pseudogene 37 (216479_at), score: 0.8
RPL35Aribosomal protein L35a (215208_x_at), score: 0.78
RPS3AP47ribosomal protein S3a pseudogene 47 (216823_at), score: 0.76
SCD5stearoyl-CoA desaturase 5 (220232_at), score: 0.79
SH3BP2SH3-domain binding protein 2 (217257_at), score: 0.8
SH3GL3SH3-domain GRB2-like 3 (211565_at), score: 0.97
SKP1S-phase kinase-associated protein 1 (200719_at), score: 0.84
SLC11A1solute carrier family 11 (proton-coupled divalent metal ion transporters), member 1 (217473_x_at), score: 0.73
SLC30A5solute carrier family 30 (zinc transporter), member 5 (220181_x_at), score: 0.96
SMEK2SMEK homolog 2, suppressor of mek1 (Dictyostelium) (222270_at), score: 0.74
SPATA2spermatogenesis associated 2 (204433_s_at), score: 0.72
SPG21spastic paraplegia 21 (autosomal recessive, Mast syndrome) (215383_x_at), score: 0.73
SPINLW1serine peptidase inhibitor-like, with Kunitz and WAP domains 1 (eppin) (206318_at), score: 0.93
SPNsialophorin (206057_x_at), score: 1
SPTLC3serine palmitoyltransferase, long chain base subunit 3 (220456_at), score: 0.97
TCTN2tectonic family member 2 (206438_x_at), score: 0.82
TIMM8Atranslocase of inner mitochondrial membrane 8 homolog A (yeast) (210800_at), score: 1
TP53TG3TP53 target 3 (220167_s_at), score: 0.74
TRIM36tripartite motif-containing 36 (219736_at), score: 0.92
UBQLN4ubiquilin 4 (222252_x_at), score: 0.84
UGT2B28UDP glucuronosyltransferase 2 family, polypeptide B28 (211682_x_at), score: 0.71
VAMP2vesicle-associated membrane protein 2 (synaptobrevin 2) (201557_at), score: 0.83
XRCC2X-ray repair complementing defective repair in Chinese hamster cells 2 (207598_x_at), score: 0.78
ZBTB39zinc finger and BTB domain containing 39 (205256_at), score: 0.76
ZC3H7Bzinc finger CCCH-type containing 7B (206169_x_at), score: 0.9
ZNF160zinc finger protein 160 (214715_x_at), score: 0.71
ZNF528zinc finger protein 528 (215019_x_at), score: 0.81
ZNF552zinc finger protein 552 (219741_x_at), score: 0.74
ZNF611zinc finger protein 611 (208137_x_at), score: 0.77
ZNF816Azinc finger protein 816A (217541_x_at), score: 0.89
Non-Entrez genes
205256_atUnknown, score: 0.77
HELP
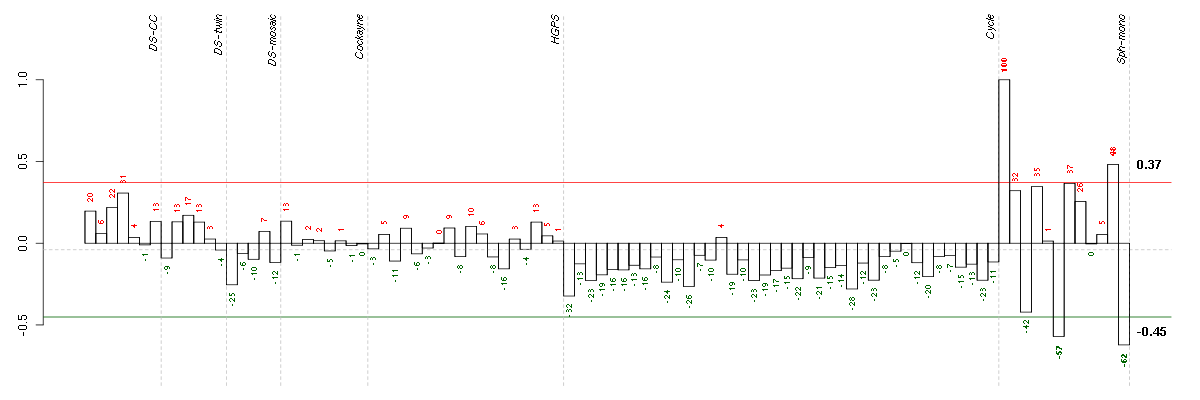
Conditions in the module, given in the same order as on the expression
plot above. Red color means over-expression, green under-expression in
the given condition.
The barplot below shows the condition (sample) scores. A separate bar
is shown for each sample, its height is the corresponding score of the
sample in the module. The red and green numbers on the bars are the
sample scores expressed in percents, i.e. 100% is 1.0.
The red and green lines show the module thresholds, samples above
the red line and below the green line are included in the module.
The different experiments that were part of the study, are separated
by dashed vertical lines.
— Click on the Help button again to close this help window.
| Id | sample | Experiment | ExpName | Array | Syndrome | Cell.line |
| E-GEOD-4219-raw-cel-1311956824.cel | 24 | 7 | Sph-mono | hgu133plus2 | none | Sph-mon 1 |
| E-GEOD-4219-raw-cel-1311956358.cel | 10 | 7 | Sph-mono | hgu133plus2 | none | Sph-mon 1 |
| E-GEOD-4219-raw-cel-1311956634.cel | 19 | 7 | Sph-mono | hgu133plus2 | none | Sph-mon 1 |
| E-GEOD-4219-raw-cel-1311956083.cel | 2 | 7 | Sph-mono | hgu133plus2 | none | Sph-mon 1 |


© 2008-2010 Computational Biology Group, Department of Medical Genetics,
University of Lausanne, Switzerland