Previous module |
Next module
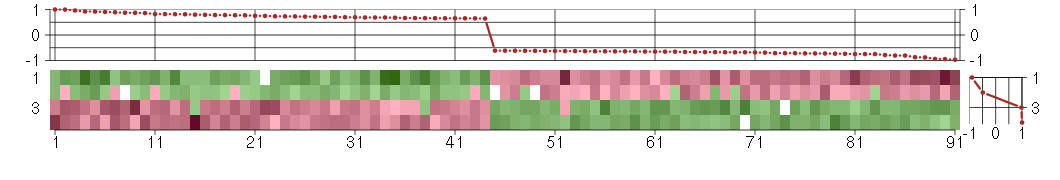
Module #555, TG: 3, TC: 2, 91 probes, 91 Entrez genes, 4 conditions


HELP
The image plot shows the color-coded level of gene expression, for the
genes and conditions in a given transcription module. The genes are on
the horizontal, the conditions on the vertical axis.
The genes are ordered according to their ISA gene scores, similarly
the conditions are ordered according to their condition scores. The
score of a gene means the «degree of inclusion» in
the module: a high score gene is essential in the module.
Condition scores can also be negative, that means that the genes of
the module are all down-regulated in the condition. Here the absolute
value of the score gives the «degree of inclusion».
The plots above and beside the expression matrix show the gene scores
and condition scores, respectively.
Note that the plot is interactive, you can see the name of the gene
and condition under the mouse cursor.
The expression matrix was normalized to have mean zero and standard
deviation one for every gene separately across all conditions
(i.e. not just for the conditions in the module).
— Click on the Help button again to close this help window.

Under-expression is coded with green,
over-expression with red color.
Help |
Hide |
Top
Help |
Show |
Top
The GO tree — Biological processes
HELP
This is one of three sections showing Gene Ontology enrichment of the
current module: in this case for biological processes.
The graph shows the hierarchy of the GO categories, their enrichment
for the current module is color coded, and the blue number beside the
category is the minus log ten p-value of the enrichment. (Calculated
using the standard hypergeometric test.) The color of the arrows code
«is a» (cyan) and «part of» relationships.
The tree was built the following way. First all GO terms with more
significant enrichment p-value than 0.05 were collected. Then all
paths from these terms to the root node of the GO tree were included
too. If a GO term is included more than once in the tree, then the
green numbers show 1) the id of the node, this makes it easier to find
other appereances of the term, and 2) the number of appearences.
Note that the same GO category might show up on the graph many
times. This is because the GO was «straightened» for this
graph, i.e. if there are more paths from a GO term to the root node of
the tree, all of them are included. The green numbers
Move the mouse cursor over the terms to get their definition. Clicking
on them takes you to the corresponding Gene Ontology web page.
If you cannot see a graph here at all, that means that there were no
significantly enriched GO categories, at the 0.05 level.
— Click on the Help button again to close this help window.
Help |
Hide |
Top
Help |
Show |
Top
The GO tree — Cellular Components
HELP
This is one of three sections showing Gene Ontology enrichment of the
current module: in this case for cellular components.
The graph shows the hierarchy of the GO categories, their enrichment
for the current module is color coded, and the blue number beside the
category is the minus log ten p-value of the enrichment. (Calculated
using the standard hypergeometric test.) The color of the arrows code
«is a» (cyan) and «part of» relationships.
The tree was built the following way. First all GO terms with more
significant enrichment p-value than 0.05 were collected. Then all
paths from these terms to the root node of the GO tree were included
too. If a GO term is included more than once in the tree, then the
green numbers show 1) the id of the node, this makes it easier to find
other appereances of the term, and 2) the number of appearences.
Note that the same GO category might show up on the graph many
times. This is because the GO was «straightened» for this
graph, i.e. if there are more paths from a GO term to the root node of
the tree, all of them are included. The green numbers
Move the mouse cursor over the terms to get their definition. Clicking
on them takes you to the corresponding Gene Ontology web page.
If you cannot see a graph here at all, that means that there were no
significantly enriched GO categories, at the 0.05 level.
— Click on the Help button again to close this help window.
plasma membrane
The membrane surrounding a cell that separates the cell from its external environment. It consists of a phospholipid bilayer and associated proteins.
membrane
Double layer of lipid molecules that encloses all cells, and, in eukaryotes, many organelles; may be a single or double lipid bilayer; also includes associated proteins.
cellular_component
The part of a cell or its extracellular environment in which a gene product is located. A gene product may be located in one or more parts of a cell and its location may be as specific as a particular macromolecular complex, that is, a stable, persistent association of macromolecules that function together.
cell
The basic structural and functional unit of all organisms. Includes the plasma membrane and any external encapsulating structures such as the cell wall and cell envelope.
membrane part
Any constituent part of a membrane, a double layer of lipid molecules that encloses all cells, and, in eukaryotes, many organelles; may be a single or double lipid bilayer; also includes associated proteins.
plasma membrane part
Any constituent part of the plasma membrane, the membrane surrounding a cell that separates the cell from its external environment. It consists of a phospholipid bilayer and associated proteins.
cell part
Any constituent part of a cell, the basic structural and functional unit of all organisms.
all
This term is the most general term possible
cell part
Any constituent part of a cell, the basic structural and functional unit of all organisms.
membrane part
Any constituent part of a membrane, a double layer of lipid molecules that encloses all cells, and, in eukaryotes, many organelles; may be a single or double lipid bilayer; also includes associated proteins.
plasma membrane part
Any constituent part of the plasma membrane, the membrane surrounding a cell that separates the cell from its external environment. It consists of a phospholipid bilayer and associated proteins.
Help |
Hide |
Top
Help |
Show |
Top
The GO tree — Molecular Function
HELP
This is one of three sections showing Gene Ontology enrichment of the
current module: in this case for molecular function.
The graph shows the hierarchy of the GO categories, their enrichment
for the current module is color coded, and the blue number beside the
category is the minus log ten p-value of the enrichment. (Calculated
using the standard hypergeometric test.) The color of the arrows code
«is a» (cyan) and «part of» relationships.
The tree was built the following way. First all GO terms with more
significant enrichment p-value than 0.05 were collected. Then all
paths from these terms to the root node of the GO tree were included
too. If a GO term is included more than once in the tree, then the
green numbers show 1) the id of the node, this makes it easier to find
other appereances of the term, and 2) the number of appearences.
Note that the same GO category might show up on the graph many
times. This is because the GO was «straightened» for this
graph, i.e. if there are more paths from a GO term to the root node of
the tree, all of them are included. The green numbers
Move the mouse cursor over the terms to get their definition. Clicking
on them takes you to the corresponding Gene Ontology web page.
If you cannot see a graph here at all, that means that there were no
significantly enriched GO categories, at the 0.05 level.
— Click on the Help button again to close this help window.
molecular_function
Elemental activities, such as catalysis or binding, describing the actions of a gene product at the molecular level. A given gene product may exhibit one or more molecular functions.
signal transducer activity
Mediates the transfer of a signal from the outside to the inside of a cell by means other than the introduction of the signal molecule itself into the cell.
receptor activity
Combining with an extracellular or intracellular messenger to initiate a change in cell activity.
transmembrane receptor activity
Combining with an extracellular or intracellular messenger to initiate a change in cell activity, and spanning to the membrane of either the cell or an organelle.
molecular transducer activity
The molecular function that accepts an input of one form and creates an output of a different form.
all
This term is the most general term possible
Help |
Hide |
Top
Help |
Show |
Top
GO BP test for over-representation
HELP
List of all enriched GO categories (biological processes), at the 0.05
p-value level.
The columns:
- ExpCount is the expected count of genes in the
module annotated with the given GO term, just by chance.
- Count
is the number of genes in the module annotated with the given GO
term.
- Size is the total number of genes (in our universe)
annotated with the GO term.
Clicking on Count shows the genes that drive the
enrichment. You can also click on the individual numbers in
the Count column, to show the driving genes for that individual
GO category.
Clicking on the GO identifiers takes you to the Gene Ontology web
pages.
— Click on the Help button again to close this help window.
| Id | Pvalue | ExpCount | Count | Size | Term |
| GO:0007154 | 1.779e-02 | 18.83 | 33
ARHGEF3, BIRC3, C1orf89, CC2D1A, CD79B, CEACAM1, DCLK1, EDNRB, EGR3, GAST, GPR56, HGF, IL9R, LILRB3, LRP8, NDP, NPY2R, NR4A1, RAB1A, RASGRP2, RASSF2, RBM38, RCAN2, RLN1, ROS1, RPS6KA1, SECTM1, SNAP25, SNTG1, SYT1, SYT5, TLR3, TMPRSS6 | 1908 | cell communication |
Help |
Hide |
Top
Help |
Show |
Top
GO CC test for over-representation
HELP
List of all enriched GO categories (cellular components), at the 0.05
p-value level.
The columns:
- ExpCount is the expected count of genes in the
module annotated with the given GO term, just by chance.
- Count
is the number of genes in the module annotated with the given GO
term.
- Size is the total number of genes (in our universe)
annotated with the GO term.
Clicking on Count shows the genes that drive the
enrichment. You can also click on the individual numbers in
the Count column, to show the driving genes for that individual
GO category.
Clicking on the GO identifiers takes you to the Gene Ontology web
pages.
— Click on the Help button again to close this help window.
| Id | Pvalue | ExpCount | Count | Size | Term |
| GO:0044459 | 7.570e-05 | 8.425 | 24
ABCA7, CD79B, CEACAM1, DCLK1, EDNRB, GPR56, HPN, ICAM2, IL9R, JUP, KCTD15, LILRB3, LRP8, MAP7, NPY2R, RASGRP2, ROS1, SLC25A13, SNAP25, SNTG1, SYT1, SYT5, TLR3, ULBP2 | 855 | plasma membrane part |
| GO:0005886 | 1.514e-03 | 13.88 | 29
ABCA7, ABCA8, CD79B, CEACAM1, DCLK1, EDNRB, GPR56, HPN, ICAM2, IL9R, JUP, KCTD15, LILRB3, LRP8, MAP7, NPY2R, RASGRP2, ROS1, SECTM1, SIGLEC1, SLC25A13, SNAP25, SNTG1, SYT1, SYT5, TLR3, TMPRSS6, TRA@, ULBP2 | 1409 | plasma membrane |
| GO:0005887 | 1.845e-02 | 5.272 | 14
CD79B, CEACAM1, DCLK1, EDNRB, GPR56, HPN, ICAM2, IL9R, KCTD15, LILRB3, NPY2R, ROS1, SLC25A13, TLR3 | 535 | integral to plasma membrane |
| GO:0031226 | 1.964e-02 | 5.311 | 14
CD79B, CEACAM1, DCLK1, EDNRB, GPR56, HPN, ICAM2, IL9R, KCTD15, LILRB3, NPY2R, ROS1, SLC25A13, TLR3 | 539 | intrinsic to plasma membrane |
Help |
Hide |
Top
Help |
Show |
Top
GO MF test for over-representation
HELP
List of all enriched GO categories (molecular function), at the 0.05
p-value level.
The columns:
- ExpCount is the expected count of genes in the
module annotated with the given GO term, just by chance.
- Count
is the number of genes in the module annotated with the given GO
term.
- Size is the total number of genes (in our universe)
annotated with the GO term.
Clicking on Count shows the genes that drive the
enrichment. You can also click on the individual numbers in
the Count column, to show the driving genes for that individual
GO category.
Clicking on the GO identifiers takes you to the Gene Ontology web
pages.
— Click on the Help button again to close this help window.
| Id | Pvalue | ExpCount | Count | Size | Term |
| GO:0004888 | 8.323e-03 | 3.144 | 12
CD79B, CFI, EDNRB, GPR56, HPN, IL9R, LILRB3, LRP8, NPY2R, ROS1, TLR3, ULBP2 | 324 | transmembrane receptor activity |
| GO:0004872 | 3.477e-02 | 5.036 | 14
CD79B, CFI, EDNRB, GPR56, HPN, IL9R, LILRB3, LRP8, NPY2R, NR4A1, ROS1, TLR3, TRA@, ULBP2 | 519 | receptor activity |
Help |
Hide |
Top
Help |
Show |
Top
KEGG Pathway test for over-representation
HELP
List of all enriched KEGG pathways, at the 0.05
p-value level.
The columns:
- ExpCount is the expected count of genes in the
module annotated with the given KEGG pathway, just by chance.
- Count
is the number of genes in the module annotated with the given KEGG
pathway.
- Size is the total number of genes (in our universe)
annotated with the KEGG pathway.
Clicking on Count shows the genes that drive the
enrichment. You can also click on the individual numbers in
the Count column, to show the driving genes for that individual
KEGG pathway.
Clicking on the KEGG identifiers takes you to the KEGG web site.
— Click on the Help button again to close this help window.
Help |
Hide |
Top
Help |
Show |
Top
miRNA test for over-representation
HELP
List of all enriched miRNA families, at the 0.05
p-value level.
The columns:
- ExpCount is the expected count of genes in the
module regulated by the given miRNA family, just by chance.
- Count
is the number of genes in the module regulated by the given miRNA
family.
- Size is the total number of genes (in our universe)
regulated with the given miRNA family.
Clicking on Count shows the genes that drive the
enrichment. You can also click on the individual numbers in
the Count column, to show the driving genes for that individual
miRNA family.
The miRNA regulation data was taken from the TargetScan database.
(Only the conserved sites were used for the current analysis.)
Clicking on the miRNA names takes you to the TargetScan web site.
— Click on the Help button again to close this help window.
Help |
Hide |
Top
Help |
Show |
Top
Chromosome test for over-representation
HELP
List of all enriched Chromosomes, at the 0.05
p-value level.
The columns:
- ExpCount is the expected number of genes in the
module on the given chromosome, just by chance.
- Count
is the number of genes in the module on the given chromosome.
- Size is the total number of genes (in our universe)
on the given chromosome.
Clicking on Count shows the genes that drive the
enrichment. You can also click on the individual numbers in
the Count column, to show the driving genes for that individual
chromosome.
— Click on the Help button again to close this help window.
HELP
A list of all genes in the current module, in alphabetical order. The
size of the text corresponds to the gene scores.
Note that some gene symbols may show up more than once, if many
probes match the same Entrez gene.
Genes with no Entrez mapping are given separately, with their
Affymetrics probe ID.
— Click on the Help button again to close this help window.
Entrez genes
ABCA7ATP-binding cassette, sub-family A (ABC1), member 7 (219577_s_at), score: -0.94
ABCA8ATP-binding cassette, sub-family A (ABC1), member 8 (204719_at), score: 0.96
ABLIM1actin binding LIM protein 1 (200965_s_at), score: 0.72
ADAMTS7ADAM metallopeptidase with thrombospondin type 1 motif, 7 (220705_s_at), score: -0.88
AGBL2ATP/GTP binding protein-like 2 (220390_at), score: -0.73
AHCYL2S-adenosylhomocysteine hydrolase-like 2 (212814_at), score: 0.67
ARHGEF3Rho guanine nucleotide exchange factor (GEF) 3 (218501_at), score: 0.66
BIRC3baculoviral IAP repeat-containing 3 (210538_s_at), score: 0.86
C12orf4chromosome 12 open reading frame 4 (218374_s_at), score: -0.64
C1orf89chromosome 1 open reading frame 89 (220963_s_at), score: -0.63
C7orf58chromosome 7 open reading frame 58 (220032_at), score: 0.66
CC2D1Acoiled-coil and C2 domain containing 1A (58994_at), score: -0.65
CD79BCD79b molecule, immunoglobulin-associated beta (205297_s_at), score: -0.94
CEACAM1carcinoembryonic antigen-related cell adhesion molecule 1 (biliary glycoprotein) (211883_x_at), score: -0.79
CFIcomplement factor I (203854_at), score: 0.8
CYorf15Bchromosome Y open reading frame 15B (214131_at), score: -0.68
DCLK1doublecortin-like kinase 1 (205399_at), score: 0.65
EDNRBendothelin receptor type B (204271_s_at), score: 0.75
EGR3early growth response 3 (206115_at), score: 0.77
FETUBfetuin B (214417_s_at), score: -0.65
FKBP10FK506 binding protein 10, 65 kDa (219249_s_at), score: -0.97
FOSL2FOS-like antigen 2 (218880_at), score: 0.65
GASTgastrin (208138_at), score: -0.64
GATMglycine amidinotransferase (L-arginine:glycine amidinotransferase) (203178_at), score: 0.9
GPR56G protein-coupled receptor 56 (212070_at), score: 0.71
HGFhepatocyte growth factor (hepapoietin A; scatter factor) (209960_at), score: 1
HIST1H2AGhistone cluster 1, H2ag (207156_at), score: 0.73
HPNhepsin (204934_s_at), score: -0.67
HSPA4Lheat shock 70kDa protein 4-like (205543_at), score: 0.68
ICAM2intercellular adhesion molecule 2 (204683_at), score: -0.64
IGHG1immunoglobulin heavy constant gamma 1 (G1m marker) (211693_at), score: -0.75
IL9Rinterleukin 9 receptor (217212_s_at), score: -0.62
INAinternexin neuronal intermediate filament protein, alpha (204465_s_at), score: 0.92
INE1inactivation escape 1 (non-protein coding) (207252_at), score: -0.64
IRF1interferon regulatory factor 1 (202531_at), score: 0.78
JUPjunction plakoglobin (201015_s_at), score: 0.65
KCTD15potassium channel tetramerisation domain containing 15 (218553_s_at), score: -0.71
KIAA1305KIAA1305 (220911_s_at), score: 0.69
KRT8P12keratin 8 pseudogene 12 (222060_at), score: -0.63
LILRB3leukocyte immunoglobulin-like receptor, subfamily B (with TM and ITIM domains), member 3 (211133_x_at), score: -0.67
LOC100128919similar to HSPC157 (219865_at), score: 0.92
LOC100133105hypothetical protein LOC100133105 (214237_x_at), score: -0.65
LOC388152hypothetical LOC388152 (220602_s_at), score: -0.64
LRP8low density lipoprotein receptor-related protein 8, apolipoprotein e receptor (205282_at), score: -0.67
MAN1C1mannosidase, alpha, class 1C, member 1 (218918_at), score: 0.72
MAP7microtubule-associated protein 7 (202890_at), score: 0.82
MUC3Bmucin 3B, cell surface associated (214898_x_at), score: -0.71
MUC5ACmucin 5AC, oligomeric mucus/gel-forming (217182_at), score: -0.72
MYH15myosin, heavy chain 15 (215331_at), score: -0.62
NDPNorrie disease (pseudoglioma) (206022_at), score: 0.71
NEBLnebulette (216882_s_at), score: -0.68
NPY2Rneuropeptide Y receptor Y2 (210730_s_at), score: -0.62
NR4A1nuclear receptor subfamily 4, group A, member 1 (202340_x_at), score: 0.75
OAS22'-5'-oligoadenylate synthetase 2, 69/71kDa (204972_at), score: 0.81
PHF2PHD finger protein 2 (212726_at), score: 0.69
PIWIL1piwi-like 1 (Drosophila) (214868_at), score: -0.81
PKNOX1PBX/knotted 1 homeobox 1 (221883_at), score: -0.68
PROX1prospero homeobox 1 (207401_at), score: 0.87
PTPN20Bprotein tyrosine phosphatase, non-receptor type 20B (215172_at), score: 0.66
RAB1ARAB1A, member RAS oncogene family (213440_at), score: -0.66
RARRES1retinoic acid receptor responder (tazarotene induced) 1 (221872_at), score: 0.78
RASGRP2RAS guanyl releasing protein 2 (calcium and DAG-regulated) (214369_s_at), score: -0.64
RASSF2Ras association (RalGDS/AF-6) domain family member 2 (203185_at), score: 0.87
RBM38RNA binding motif protein 38 (212430_at), score: -0.81
RCAN2regulator of calcineurin 2 (203498_at), score: 0.69
RLN1relaxin 1 (211753_s_at), score: -0.73
ROS1c-ros oncogene 1 , receptor tyrosine kinase (207569_at), score: -0.74
RPLP2P1ribosomal protein, large P2, pseudogene 1 (216490_x_at), score: -0.68
RPS6KA1ribosomal protein S6 kinase, 90kDa, polypeptide 1 (203379_at), score: -0.67
SECTM1secreted and transmembrane 1 (213716_s_at), score: 0.89
SELENBP1selenium binding protein 1 (214433_s_at), score: 0.7
SIGLEC1sialic acid binding Ig-like lectin 1, sialoadhesin (44673_at), score: -0.63
SLC25A13solute carrier family 25, member 13 (citrin) (203775_at), score: -0.62
SNAI1snail homolog 1 (Drosophila) (219480_at), score: 0.82
SNAP25synaptosomal-associated protein, 25kDa (202508_s_at), score: 1
SNTG1syntrophin, gamma 1 (220405_at), score: 0.7
SSX3synovial sarcoma, X breakpoint 3 (215881_x_at), score: -0.63
ST8SIA3ST8 alpha-N-acetyl-neuraminide alpha-2,8-sialyltransferase 3 (208064_s_at), score: -0.69
SYT1synaptotagmin I (203999_at), score: 0.79
SYT5synaptotagmin V (206161_s_at), score: -0.75
TCP10t-complex 10 homolog (mouse) (207503_at), score: -0.75
THSD7Athrombospondin, type I, domain containing 7A (214920_at), score: 0.78
TLR3toll-like receptor 3 (206271_at), score: 0.74
TMPRSS6transmembrane protease, serine 6 (214955_at), score: -0.87
TRA@T cell receptor alpha locus (216540_at), score: -0.72
TRIM52tripartite motif-containing 52 (221897_at), score: 0.73
ULBP2UL16 binding protein 2 (221291_at), score: -0.61
YPEL1yippee-like 1 (Drosophila) (206063_x_at), score: -0.71
ZNF132zinc finger protein 132 (207402_at), score: 0.82
ZNF192zinc finger protein 192 (206579_at), score: 0.66
ZNF814zinc finger protein 814 (60794_f_at), score: 0.66
Non-Entrez genes
Unknown, score:
HELP
Conditions in the module, given in the same order as on the expression
plot above. Red color means over-expression, green under-expression in
the given condition.
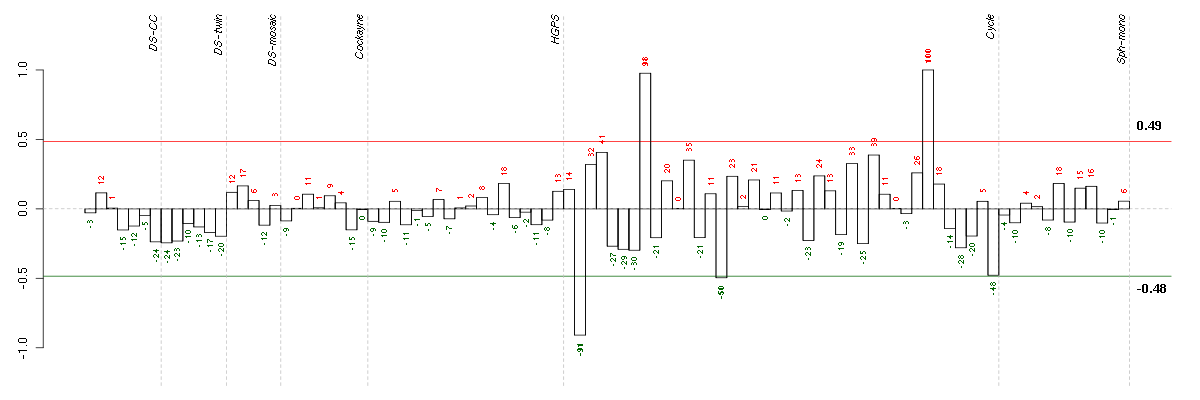
The barplot below shows the condition (sample) scores. A separate bar
is shown for each sample, its height is the corresponding score of the
sample in the module. The red and green numbers on the bars are the
sample scores expressed in percents, i.e. 100% is 1.0.
The red and green lines show the module thresholds, samples above
the red line and below the green line are included in the module.
The different experiments that were part of the study, are separated
by dashed vertical lines.
— Click on the Help button again to close this help window.
| Id | sample | Experiment | ExpName | Array | Syndrome | Cell.line |
| E-TABM-263-raw-cel-1515485671.cel | 2 | 6 | Cycle | hgu133a2 | none | Cycle 1 |
| E-TABM-263-raw-cel-1515485931.cel | 15 | 6 | Cycle | hgu133a2 | none | Cycle 1 |
| E-TABM-263-raw-cel-1515485791.cel | 8 | 6 | Cycle | hgu133a2 | none | Cycle 1 |
| E-TABM-263-raw-cel-1515486311.cel | 34 | 6 | Cycle | hgu133a2 | none | Cycle 1 |


© 2008-2010 Computational Biology Group, Department of Medical Genetics,
University of Lausanne, Switzerland