Previous module |
Next module
Module #564, TG: 3, TC: 2, 85 probes, 85 Entrez genes, 4 conditions


HELP
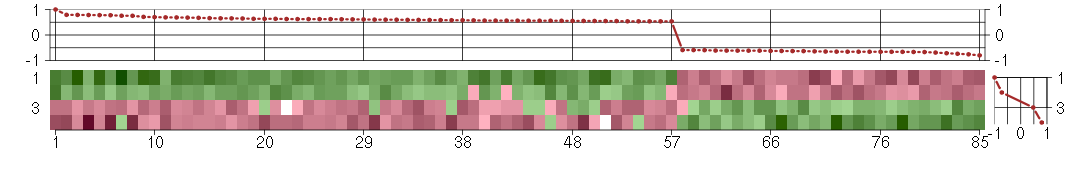
The image plot shows the color-coded level of gene expression, for the
genes and conditions in a given transcription module. The genes are on
the horizontal, the conditions on the vertical axis.
The genes are ordered according to their ISA gene scores, similarly
the conditions are ordered according to their condition scores. The
score of a gene means the «degree of inclusion» in
the module: a high score gene is essential in the module.
Condition scores can also be negative, that means that the genes of
the module are all down-regulated in the condition. Here the absolute
value of the score gives the «degree of inclusion».
The plots above and beside the expression matrix show the gene scores
and condition scores, respectively.
Note that the plot is interactive, you can see the name of the gene
and condition under the mouse cursor.
The expression matrix was normalized to have mean zero and standard
deviation one for every gene separately across all conditions
(i.e. not just for the conditions in the module).
— Click on the Help button again to close this help window.

Under-expression is coded with green,
over-expression with red color.
Help |
Hide |
Top
Help |
Show |
Top
The GO tree — Biological processes
HELP
This is one of three sections showing Gene Ontology enrichment of the
current module: in this case for biological processes.
The graph shows the hierarchy of the GO categories, their enrichment
for the current module is color coded, and the blue number beside the
category is the minus log ten p-value of the enrichment. (Calculated
using the standard hypergeometric test.) The color of the arrows code
«is a» (cyan) and «part of» relationships.
The tree was built the following way. First all GO terms with more
significant enrichment p-value than 0.05 were collected. Then all
paths from these terms to the root node of the GO tree were included
too. If a GO term is included more than once in the tree, then the
green numbers show 1) the id of the node, this makes it easier to find
other appereances of the term, and 2) the number of appearences.
Note that the same GO category might show up on the graph many
times. This is because the GO was «straightened» for this
graph, i.e. if there are more paths from a GO term to the root node of
the tree, all of them are included. The green numbers
Move the mouse cursor over the terms to get their definition. Clicking
on them takes you to the corresponding Gene Ontology web page.
If you cannot see a graph here at all, that means that there were no
significantly enriched GO categories, at the 0.05 level.
— Click on the Help button again to close this help window.
biological_process
Any process specifically pertinent to the functioning of integrated living units: cells, tissues, organs, and organisms. A process is a collection of molecular events with a defined beginning and end.
cellular process
Any process that is carried out at the cellular level, but not necessarily restricted to a single cell. For example, cell communication occurs among more than one cell, but occurs at the cellular level.
cellular component organization
A process that is carried out at the cellular level which results in the formation, arrangement of constituent parts, or disassembly of a cellular component.
extracellular matrix organization
A process that is carried out at the cellular level which results in the formation, arrangement of constituent parts, or disassembly of an extracellular matrix.
extracellular structure organization
A process that is carried out at the cellular level which results in the formation, arrangement of constituent parts, or disassembly of structures in the space external to the outermost structure of a cell. For cells without external protective or external encapsulating structures this refers to space outside of the plasma membrane, and also covers the host cell environment outside an intracellular parasite.
all
This term is the most general term possible
Help |
Hide |
Top
Help |
Show |
Top
The GO tree — Cellular Components
HELP
This is one of three sections showing Gene Ontology enrichment of the
current module: in this case for cellular components.
The graph shows the hierarchy of the GO categories, their enrichment
for the current module is color coded, and the blue number beside the
category is the minus log ten p-value of the enrichment. (Calculated
using the standard hypergeometric test.) The color of the arrows code
«is a» (cyan) and «part of» relationships.
The tree was built the following way. First all GO terms with more
significant enrichment p-value than 0.05 were collected. Then all
paths from these terms to the root node of the GO tree were included
too. If a GO term is included more than once in the tree, then the
green numbers show 1) the id of the node, this makes it easier to find
other appereances of the term, and 2) the number of appearences.
Note that the same GO category might show up on the graph many
times. This is because the GO was «straightened» for this
graph, i.e. if there are more paths from a GO term to the root node of
the tree, all of them are included. The green numbers
Move the mouse cursor over the terms to get their definition. Clicking
on them takes you to the corresponding Gene Ontology web page.
If you cannot see a graph here at all, that means that there were no
significantly enriched GO categories, at the 0.05 level.
— Click on the Help button again to close this help window.
plasma membrane
The membrane surrounding a cell that separates the cell from its external environment. It consists of a phospholipid bilayer and associated proteins.
membrane
Double layer of lipid molecules that encloses all cells, and, in eukaryotes, many organelles; may be a single or double lipid bilayer; also includes associated proteins.
integral to membrane
Penetrating at least one phospholipid bilayer of a membrane. May also refer to the state of being buried in the bilayer with no exposure outside the bilayer. When used to describe a protein, indicates that all or part of the peptide sequence is embedded in the membrane.
extracellular region
The space external to the outermost structure of a cell. For cells without external protective or external encapsulating structures this refers to space outside of the plasma membrane. This term covers the host cell environment outside an intracellular parasite.
integral to plasma membrane
Penetrating at least one phospholipid bilayer of a plasma membrane. May also refer to the state of being buried in the bilayer with no exposure outside the bilayer.
cellular_component
The part of a cell or its extracellular environment in which a gene product is located. A gene product may be located in one or more parts of a cell and its location may be as specific as a particular macromolecular complex, that is, a stable, persistent association of macromolecules that function together.
cell
The basic structural and functional unit of all organisms. Includes the plasma membrane and any external encapsulating structures such as the cell wall and cell envelope.
intrinsic to membrane
Located in a membrane such that some covalently attached portion of the gene product, for example part of a peptide sequence or some other covalently attached moiety such as a GPI anchor, spans or is embedded in one or both leaflets of the membrane.
intrinsic to plasma membrane
Located in the plasma membrane such that some covalently attached portion of the gene product, for example part of a peptide sequence or some other covalently attached moiety such as a GPI anchor, spans or is embedded in one or both leaflets of the membrane.
membrane part
Any constituent part of a membrane, a double layer of lipid molecules that encloses all cells, and, in eukaryotes, many organelles; may be a single or double lipid bilayer; also includes associated proteins.
plasma membrane part
Any constituent part of the plasma membrane, the membrane surrounding a cell that separates the cell from its external environment. It consists of a phospholipid bilayer and associated proteins.
cell part
Any constituent part of a cell, the basic structural and functional unit of all organisms.
all
This term is the most general term possible
cell part
Any constituent part of a cell, the basic structural and functional unit of all organisms.
membrane part
Any constituent part of a membrane, a double layer of lipid molecules that encloses all cells, and, in eukaryotes, many organelles; may be a single or double lipid bilayer; also includes associated proteins.
plasma membrane part
Any constituent part of the plasma membrane, the membrane surrounding a cell that separates the cell from its external environment. It consists of a phospholipid bilayer and associated proteins.
intrinsic to plasma membrane
Located in the plasma membrane such that some covalently attached portion of the gene product, for example part of a peptide sequence or some other covalently attached moiety such as a GPI anchor, spans or is embedded in one or both leaflets of the membrane.
integral to plasma membrane
Penetrating at least one phospholipid bilayer of a plasma membrane. May also refer to the state of being buried in the bilayer with no exposure outside the bilayer.
Help |
Hide |
Top
Help |
Show |
Top
The GO tree — Molecular Function
HELP
This is one of three sections showing Gene Ontology enrichment of the
current module: in this case for molecular function.
The graph shows the hierarchy of the GO categories, their enrichment
for the current module is color coded, and the blue number beside the
category is the minus log ten p-value of the enrichment. (Calculated
using the standard hypergeometric test.) The color of the arrows code
«is a» (cyan) and «part of» relationships.
The tree was built the following way. First all GO terms with more
significant enrichment p-value than 0.05 were collected. Then all
paths from these terms to the root node of the GO tree were included
too. If a GO term is included more than once in the tree, then the
green numbers show 1) the id of the node, this makes it easier to find
other appereances of the term, and 2) the number of appearences.
Note that the same GO category might show up on the graph many
times. This is because the GO was «straightened» for this
graph, i.e. if there are more paths from a GO term to the root node of
the tree, all of them are included. The green numbers
Move the mouse cursor over the terms to get their definition. Clicking
on them takes you to the corresponding Gene Ontology web page.
If you cannot see a graph here at all, that means that there were no
significantly enriched GO categories, at the 0.05 level.
— Click on the Help button again to close this help window.
Help |
Hide |
Top
Help |
Show |
Top
GO BP test for over-representation
HELP
List of all enriched GO categories (biological processes), at the 0.05
p-value level.
The columns:
- ExpCount is the expected count of genes in the
module annotated with the given GO term, just by chance.
- Count
is the number of genes in the module annotated with the given GO
term.
- Size is the total number of genes (in our universe)
annotated with the GO term.
Clicking on Count shows the genes that drive the
enrichment. You can also click on the individual numbers in
the Count column, to show the driving genes for that individual
GO category.
Clicking on the GO identifiers takes you to the Gene Ontology web
pages.
— Click on the Help button again to close this help window.
| Id | Pvalue | ExpCount | Count | Size | Term |
| GO:0030198 | 2.769e-03 | 0.3444 | 5
AGT, COL11A2, MUC5AC, NF1, TMPRSS6 | 42 | extracellular matrix organization |
| GO:0043062 | 8.151e-03 | 0.4509 | 5
AGT, COL11A2, MUC5AC, NF1, TMPRSS6 | 55 | extracellular structure organization |
| GO:0014002 | 1.632e-02 | 0.0246 | 2
AGT, NF1 | 3 | astrocyte development |
| GO:0006952 | 1.740e-02 | 2.107 | 9
ABCC9, ADORA1, AGT, DMBT1, HAMP, HIST1H2BC, ITGAL, LILRB3, REG3A | 257 | defense response |
| GO:0007166 | 2.192e-02 | 5.6 | 15
ADORA1, AGT, CD79B, GDF9, GPR144, GPR32, ITGAL, LILRB3, LPHN1, NDP, NXPH3, OPRL1, PTPN6, PXN, TGFBR2 | 683 | cell surface receptor linked signal transduction |
| GO:0046622 | 2.702e-02 | 0.0328 | 2
AGT, SASH3 | 4 | positive regulation of organ growth |
| GO:0007292 | 3.031e-02 | 0.1558 | 3
AGT, DMC1, GDF9 | 19 | female gamete generation |
| GO:0007186 | 3.369e-02 | 1.894 | 8
ADORA1, AGT, GPR144, GPR32, LPHN1, NXPH3, OPRL1, PTPN6 | 231 | G-protein coupled receptor protein signaling pathway |
| GO:0042742 | 3.377e-02 | 0.164 | 3
DMBT1, HAMP, HIST1H2BC | 20 | defense response to bacterium |
| GO:0045927 | 4.089e-02 | 0.1804 | 3
AGT, SASH3, TGFBR2 | 22 | positive regulation of growth |
| GO:0009994 | 4.953e-02 | 0.04919 | 2
DMC1, GDF9 | 6 | oocyte differentiation |
| GO:0046638 | 4.953e-02 | 0.04919 | 2
SASH3, TGFBR2 | 6 | positive regulation of alpha-beta T cell differentiation |
| GO:0048599 | 4.953e-02 | 0.04919 | 2
DMC1, GDF9 | 6 | oocyte development |
| GO:0048708 | 4.953e-02 | 0.04919 | 2
AGT, NF1 | 6 | astrocyte differentiation |
Help |
Hide |
Top
Help |
Show |
Top
GO CC test for over-representation
HELP
List of all enriched GO categories (cellular components), at the 0.05
p-value level.
The columns:
- ExpCount is the expected count of genes in the
module annotated with the given GO term, just by chance.
- Count
is the number of genes in the module annotated with the given GO
term.
- Size is the total number of genes (in our universe)
annotated with the GO term.
Clicking on Count shows the genes that drive the
enrichment. You can also click on the individual numbers in
the Count column, to show the driving genes for that individual
GO category.
Clicking on the GO identifiers takes you to the Gene Ontology web
pages.
— Click on the Help button again to close this help window.
| Id | Pvalue | ExpCount | Count | Size | Term |
| GO:0005887 | 8.811e-03 | 4.861 | 14
ABCC9, ADORA1, BCAM, CD79B, FLRT3, GPR32, ITGAL, KCTD15, KCTD2, LILRB3, MMP17, OPRL1, TGFBR2, TSPAN15 | 535 | integral to plasma membrane |
| GO:0005576 | 8.993e-03 | 6.115 | 16
AGT, COL11A2, DHRS11, DMBT1, FLJ21075, FLRT3, GDF9, HAMP, IGHG1, LILRA5, MFNG, MMP17, MUC5AC, NDP, PRLH, REG3A | 673 | extracellular region |
| GO:0031226 | 9.420e-03 | 4.897 | 14
ABCC9, ADORA1, BCAM, CD79B, FLRT3, GPR32, ITGAL, KCTD15, KCTD2, LILRB3, MMP17, OPRL1, TGFBR2, TSPAN15 | 539 | intrinsic to plasma membrane |
| GO:0044459 | 3.384e-02 | 7.769 | 17
ABCA7, ABCC9, ADORA1, BCAM, CD79B, FLRT3, GPR32, ITGAL, KCTD15, KCTD2, LILRB3, MMP17, OPRL1, PPP1R9A, PXN, TGFBR2, TSPAN15 | 855 | plasma membrane part |
Help |
Hide |
Top
Help |
Show |
Top
GO MF test for over-representation
HELP
List of all enriched GO categories (molecular function), at the 0.05
p-value level.
The columns:
- ExpCount is the expected count of genes in the
module annotated with the given GO term, just by chance.
- Count
is the number of genes in the module annotated with the given GO
term.
- Size is the total number of genes (in our universe)
annotated with the GO term.
Clicking on Count shows the genes that drive the
enrichment. You can also click on the individual numbers in
the Count column, to show the driving genes for that individual
GO category.
Clicking on the GO identifiers takes you to the Gene Ontology web
pages.
— Click on the Help button again to close this help window.
| Id | Pvalue | ExpCount | Count | Size | Term |
| GO:0004888 | 1.336e-02 | 2.847 | 11
ABCC9, ADORA1, BCAM, CD79B, DMBT1, GPR144, GPR32, LILRB3, LPHN1, OPRL1, TGFBR2 | 324 | transmembrane receptor activity |
| GO:0004872 | 4.031e-02 | 4.56 | 13
ABCC9, ADORA1, BCAM, CD79B, DMBT1, GPR144, GPR32, ITGAL, LILRA5, LILRB3, LPHN1, OPRL1, TGFBR2 | 519 | receptor activity |
Help |
Hide |
Top
Help |
Show |
Top
KEGG Pathway test for over-representation
HELP
List of all enriched KEGG pathways, at the 0.05
p-value level.
The columns:
- ExpCount is the expected count of genes in the
module annotated with the given KEGG pathway, just by chance.
- Count
is the number of genes in the module annotated with the given KEGG
pathway.
- Size is the total number of genes (in our universe)
annotated with the KEGG pathway.
Clicking on Count shows the genes that drive the
enrichment. You can also click on the individual numbers in
the Count column, to show the driving genes for that individual
KEGG pathway.
Clicking on the KEGG identifiers takes you to the KEGG web site.
— Click on the Help button again to close this help window.
Help |
Hide |
Top
Help |
Show |
Top
miRNA test for over-representation
HELP
List of all enriched miRNA families, at the 0.05
p-value level.
The columns:
- ExpCount is the expected count of genes in the
module regulated by the given miRNA family, just by chance.
- Count
is the number of genes in the module regulated by the given miRNA
family.
- Size is the total number of genes (in our universe)
regulated with the given miRNA family.
Clicking on Count shows the genes that drive the
enrichment. You can also click on the individual numbers in
the Count column, to show the driving genes for that individual
miRNA family.
The miRNA regulation data was taken from the TargetScan database.
(Only the conserved sites were used for the current analysis.)
Clicking on the miRNA names takes you to the TargetScan web site.
— Click on the Help button again to close this help window.
Help |
Hide |
Top
Help |
Show |
Top
Chromosome test for over-representation
HELP
List of all enriched Chromosomes, at the 0.05
p-value level.
The columns:
- ExpCount is the expected number of genes in the
module on the given chromosome, just by chance.
- Count
is the number of genes in the module on the given chromosome.
- Size is the total number of genes (in our universe)
on the given chromosome.
Clicking on Count shows the genes that drive the
enrichment. You can also click on the individual numbers in
the Count column, to show the driving genes for that individual
chromosome.
— Click on the Help button again to close this help window.
HELP
A list of all genes in the current module, in alphabetical order. The
size of the text corresponds to the gene scores.
Note that some gene symbols may show up more than once, if many
probes match the same Entrez gene.
Genes with no Entrez mapping are given separately, with their
Affymetrics probe ID.
— Click on the Help button again to close this help window.
Entrez genes
ABCA7ATP-binding cassette, sub-family A (ABC1), member 7 (219577_s_at), score: 0.78
ABCC9ATP-binding cassette, sub-family C (CFTR/MRP), member 9 (208561_at), score: -0.65
ADORA1adenosine A1 receptor (216220_s_at), score: 0.54
AGTangiotensinogen (serpin peptidase inhibitor, clade A, member 8) (202834_at), score: 0.71
ASPHD1aspartate beta-hydroxylase domain containing 1 (214993_at), score: 0.77
BCAMbasal cell adhesion molecule (Lutheran blood group) (40093_at), score: 0.69
C7orf58chromosome 7 open reading frame 58 (220032_at), score: -0.66
CASP7caspase 7, apoptosis-related cysteine peptidase (207181_s_at), score: 0.54
CD79BCD79b molecule, immunoglobulin-associated beta (205297_s_at), score: 0.79
CEP164centrosomal protein 164kDa (204251_s_at), score: -0.66
COL11A2collagen, type XI, alpha 2 (216993_s_at), score: 0.57
COPG2coatomer protein complex, subunit gamma 2 (213486_at), score: 0.62
DHRS11dehydrogenase/reductase (SDR family) member 11 (218756_s_at), score: -0.69
DMBT1deleted in malignant brain tumors 1 (208250_s_at), score: 0.63
DMC1DMC1 dosage suppressor of mck1 homolog, meiosis-specific homologous recombination (yeast) (208382_s_at), score: -0.59
ETV7ets variant 7 (221680_s_at), score: 0.68
FAM105Afamily with sequence similarity 105, member A (219694_at), score: -0.66
FBP1fructose-1,6-bisphosphatase 1 (209696_at), score: 0.79
FKBP10FK506 binding protein 10, 65 kDa (219249_s_at), score: 0.6
FLJ21075hypothetical protein FLJ21075 (221172_at), score: 0.56
FLRT3fibronectin leucine rich transmembrane protein 3 (219250_s_at), score: -0.67
GBA3glucosidase, beta, acid 3 (cytosolic) (219954_s_at), score: 1
GDF9growth differentiation factor 9 (221314_at), score: 0.62
GIPC2GIPC PDZ domain containing family, member 2 (219970_at), score: -0.67
GPR144G protein-coupled receptor 144 (216289_at), score: 0.67
GPR32G protein-coupled receptor 32 (221469_at), score: 0.76
HAB1B1 for mucin (215778_x_at), score: 0.69
HAMPhepcidin antimicrobial peptide (220491_at), score: 0.65
HIST1H2BChistone cluster 1, H2bc (214455_at), score: -0.61
HIST1H4Ghistone cluster 1, H4g (208551_at), score: 0.55
HOXA6homeobox A6 (208557_at), score: 0.6
HSPA4Lheat shock 70kDa protein 4-like (205543_at), score: -0.65
IGHG1immunoglobulin heavy constant gamma 1 (G1m marker) (211693_at), score: 0.75
INE1inactivation escape 1 (non-protein coding) (207252_at), score: 0.59
ITGALintegrin, alpha L (antigen CD11A (p180), lymphocyte function-associated antigen 1; alpha polypeptide) (213475_s_at), score: 0.66
ITM2Aintegral membrane protein 2A (202746_at), score: -0.62
KCTD15potassium channel tetramerisation domain containing 15 (218553_s_at), score: 0.55
KCTD2potassium channel tetramerisation domain containing 2 (212564_at), score: -0.63
KIAA1305KIAA1305 (220911_s_at), score: -0.63
LILRA5leukocyte immunoglobulin-like receptor, subfamily A (with TM domain), member 5 (215838_at), score: 0.61
LILRB3leukocyte immunoglobulin-like receptor, subfamily B (with TM and ITIM domains), member 3 (211133_x_at), score: 0.58
LOC149478hypothetical protein LOC149478 (215462_at), score: 0.56
LOC149501similar to keratin 8 (216821_at), score: 0.61
LPHN1latrophilin 1 (203488_at), score: 0.62
MAFGv-maf musculoaponeurotic fibrosarcoma oncogene homolog G (avian) (204970_s_at), score: 0.54
MAP2microtubule-associated protein 2 (210015_s_at), score: 0.62
MEGF8multiple EGF-like-domains 8 (214778_at), score: 0.54
MEOX1mesenchyme homeobox 1 (205619_s_at), score: 0.56
MFNGMFNG O-fucosylpeptide 3-beta-N-acetylglucosaminyltransferase (204153_s_at), score: 0.56
MMP17matrix metallopeptidase 17 (membrane-inserted) (206234_s_at), score: 0.65
MOBPmyelin-associated oligodendrocyte basic protein (210193_at), score: 0.64
MOCS1molybdenum cofactor synthesis 1 (211673_s_at), score: 0.56
MRPS6mitochondrial ribosomal protein S6 (213167_s_at), score: -0.66
MTMR11myotubularin related protein 11 (205076_s_at), score: -0.76
MUC3Bmucin 3B, cell surface associated (214898_x_at), score: 0.59
MUC5ACmucin 5AC, oligomeric mucus/gel-forming (217182_at), score: 0.55
NDPNorrie disease (pseudoglioma) (206022_at), score: -0.66
NF1neurofibromin 1 (211094_s_at), score: -0.59
NPEPL1aminopeptidase-like 1 (89476_r_at), score: 0.59
NUPL2nucleoporin like 2 (204003_s_at), score: 0.62
NXPH3neurexophilin 3 (221991_at), score: 0.57
OPRL1opiate receptor-like 1 (206564_at), score: 0.56
PCNXpecanex homolog (Drosophila) (213159_at), score: -0.63
PDE5Aphosphodiesterase 5A, cGMP-specific (206757_at), score: -0.59
PHF2PHD finger protein 2 (212726_at), score: -0.63
PHF7PHD finger protein 7 (215622_x_at), score: 0.55
PKLRpyruvate kinase, liver and RBC (222078_at), score: 0.58
PNMAL1PNMA-like 1 (218824_at), score: -0.8
PPP1R9Aprotein phosphatase 1, regulatory (inhibitor) subunit 9A (221088_s_at), score: -0.64
PRLHprolactin releasing hormone (221443_x_at), score: 0.55
PTPN6protein tyrosine phosphatase, non-receptor type 6 (206687_s_at), score: 0.78
PXNpaxillin (211823_s_at), score: -0.61
REG3Aregenerating islet-derived 3 alpha (205815_at), score: 0.63
RP4-691N24.1ninein-like (207705_s_at), score: -0.66
SASH3SAM and SH3 domain containing 3 (204923_at), score: 0.6
SEC61A2Sec61 alpha 2 subunit (S. cerevisiae) (219499_at), score: -0.74
SENP7SUMO1/sentrin specific peptidase 7 (220735_s_at), score: -0.61
SPATA1spermatogenesis associated 1 (221057_at), score: 0.7
TGFBR2transforming growth factor, beta receptor II (70/80kDa) (207334_s_at), score: -0.62
TGM4transglutaminase 4 (prostate) (217566_s_at), score: 0.63
TMEM92transmembrane protein 92 (216791_at), score: 0.54
TMPRSS6transmembrane protease, serine 6 (214955_at), score: 0.58
TSPAN15tetraspanin 15 (218693_at), score: 0.65
TULP2tubby like protein 2 (206733_at), score: 0.57
ZNF192zinc finger protein 192 (206579_at), score: -0.71
Non-Entrez genes
Unknown, score:
HELP
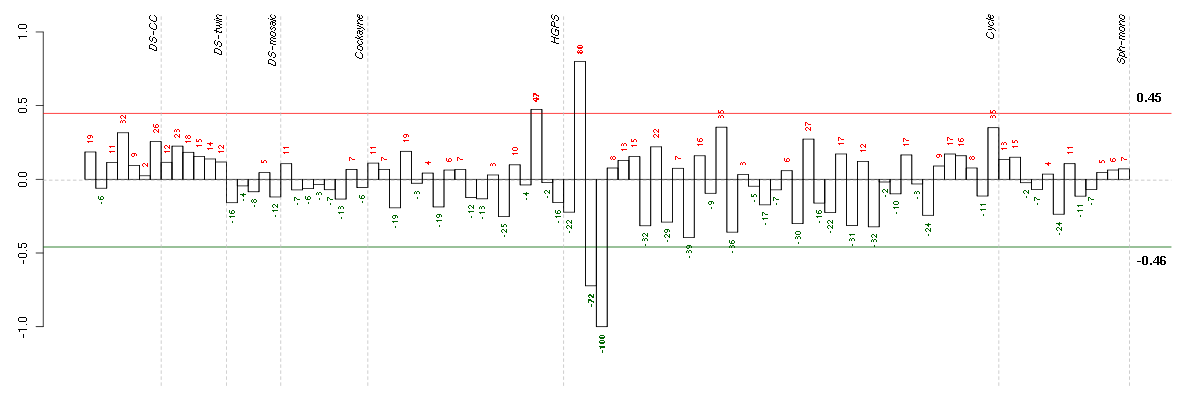
Conditions in the module, given in the same order as on the expression
plot above. Red color means over-expression, green under-expression in
the given condition.
The barplot below shows the condition (sample) scores. A separate bar
is shown for each sample, its height is the corresponding score of the
sample in the module. The red and green numbers on the bars are the
sample scores expressed in percents, i.e. 100% is 1.0.
The red and green lines show the module thresholds, samples above
the red line and below the green line are included in the module.
The different experiments that were part of the study, are separated
by dashed vertical lines.
— Click on the Help button again to close this help window.
| Id | sample | Experiment | ExpName | Array | Syndrome | Cell.line |
| E-TABM-263-raw-cel-1515485711.cel | 4 | 6 | Cycle | hgu133a2 | none | Cycle 1 |
| E-TABM-263-raw-cel-1515485691.cel | 3 | 6 | Cycle | hgu133a2 | none | Cycle 1 |
| E-GEOD-3860-raw-cel-1561690432.cel | 16 | 5 | HGPS | hgu133a | HGPS | AG10750 |
| E-TABM-263-raw-cel-1515485671.cel | 2 | 6 | Cycle | hgu133a2 | none | Cycle 1 |


© 2008-2010 Computational Biology Group, Department of Medical Genetics,
University of Lausanne, Switzerland