Previous module |
Next module
Module #567, TG: 3, TC: 1.8, 117 probes, 117 Entrez genes, 3 conditions


HELP
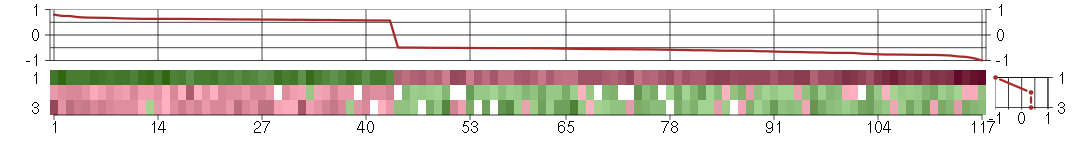
The image plot shows the color-coded level of gene expression, for the
genes and conditions in a given transcription module. The genes are on
the horizontal, the conditions on the vertical axis.
The genes are ordered according to their ISA gene scores, similarly
the conditions are ordered according to their condition scores. The
score of a gene means the «degree of inclusion» in
the module: a high score gene is essential in the module.
Condition scores can also be negative, that means that the genes of
the module are all down-regulated in the condition. Here the absolute
value of the score gives the «degree of inclusion».
The plots above and beside the expression matrix show the gene scores
and condition scores, respectively.
Note that the plot is interactive, you can see the name of the gene
and condition under the mouse cursor.
The expression matrix was normalized to have mean zero and standard
deviation one for every gene separately across all conditions
(i.e. not just for the conditions in the module).
— Click on the Help button again to close this help window.

Under-expression is coded with green,
over-expression with red color.
Help |
Hide |
Top
Help |
Show |
Top
The GO tree — Biological processes
HELP
This is one of three sections showing Gene Ontology enrichment of the
current module: in this case for biological processes.
The graph shows the hierarchy of the GO categories, their enrichment
for the current module is color coded, and the blue number beside the
category is the minus log ten p-value of the enrichment. (Calculated
using the standard hypergeometric test.) The color of the arrows code
«is a» (cyan) and «part of» relationships.
The tree was built the following way. First all GO terms with more
significant enrichment p-value than 0.05 were collected. Then all
paths from these terms to the root node of the GO tree were included
too. If a GO term is included more than once in the tree, then the
green numbers show 1) the id of the node, this makes it easier to find
other appereances of the term, and 2) the number of appearences.
Note that the same GO category might show up on the graph many
times. This is because the GO was «straightened» for this
graph, i.e. if there are more paths from a GO term to the root node of
the tree, all of them are included. The green numbers
Move the mouse cursor over the terms to get their definition. Clicking
on them takes you to the corresponding Gene Ontology web page.
If you cannot see a graph here at all, that means that there were no
significantly enriched GO categories, at the 0.05 level.
— Click on the Help button again to close this help window.
Help |
Hide |
Top
Help |
Show |
Top
The GO tree — Cellular Components
HELP
This is one of three sections showing Gene Ontology enrichment of the
current module: in this case for cellular components.
The graph shows the hierarchy of the GO categories, their enrichment
for the current module is color coded, and the blue number beside the
category is the minus log ten p-value of the enrichment. (Calculated
using the standard hypergeometric test.) The color of the arrows code
«is a» (cyan) and «part of» relationships.
The tree was built the following way. First all GO terms with more
significant enrichment p-value than 0.05 were collected. Then all
paths from these terms to the root node of the GO tree were included
too. If a GO term is included more than once in the tree, then the
green numbers show 1) the id of the node, this makes it easier to find
other appereances of the term, and 2) the number of appearences.
Note that the same GO category might show up on the graph many
times. This is because the GO was «straightened» for this
graph, i.e. if there are more paths from a GO term to the root node of
the tree, all of them are included. The green numbers
Move the mouse cursor over the terms to get their definition. Clicking
on them takes you to the corresponding Gene Ontology web page.
If you cannot see a graph here at all, that means that there were no
significantly enriched GO categories, at the 0.05 level.
— Click on the Help button again to close this help window.
Help |
Hide |
Top
Help |
Show |
Top
The GO tree — Molecular Function
HELP
This is one of three sections showing Gene Ontology enrichment of the
current module: in this case for molecular function.
The graph shows the hierarchy of the GO categories, their enrichment
for the current module is color coded, and the blue number beside the
category is the minus log ten p-value of the enrichment. (Calculated
using the standard hypergeometric test.) The color of the arrows code
«is a» (cyan) and «part of» relationships.
The tree was built the following way. First all GO terms with more
significant enrichment p-value than 0.05 were collected. Then all
paths from these terms to the root node of the GO tree were included
too. If a GO term is included more than once in the tree, then the
green numbers show 1) the id of the node, this makes it easier to find
other appereances of the term, and 2) the number of appearences.
Note that the same GO category might show up on the graph many
times. This is because the GO was «straightened» for this
graph, i.e. if there are more paths from a GO term to the root node of
the tree, all of them are included. The green numbers
Move the mouse cursor over the terms to get their definition. Clicking
on them takes you to the corresponding Gene Ontology web page.
If you cannot see a graph here at all, that means that there were no
significantly enriched GO categories, at the 0.05 level.
— Click on the Help button again to close this help window.
Help |
Hide |
Top
Help |
Show |
Top
GO BP test for over-representation
HELP
List of all enriched GO categories (biological processes), at the 0.05
p-value level.
The columns:
- ExpCount is the expected count of genes in the
module annotated with the given GO term, just by chance.
- Count
is the number of genes in the module annotated with the given GO
term.
- Size is the total number of genes (in our universe)
annotated with the GO term.
Clicking on Count shows the genes that drive the
enrichment. You can also click on the individual numbers in
the Count column, to show the driving genes for that individual
GO category.
Clicking on the GO identifiers takes you to the Gene Ontology web
pages.
— Click on the Help button again to close this help window.
| Id | Pvalue | ExpCount | Count | Size | Term |
| GO:0006516 | 4.924e-02 | 0.2008 | 3
ADAMTS9, FBXO2, MANBA | 17 | glycoprotein catabolic process |
Help |
Hide |
Top
Help |
Show |
Top
GO CC test for over-representation
HELP
List of all enriched GO categories (cellular components), at the 0.05
p-value level.
The columns:
- ExpCount is the expected count of genes in the
module annotated with the given GO term, just by chance.
- Count
is the number of genes in the module annotated with the given GO
term.
- Size is the total number of genes (in our universe)
annotated with the GO term.
Clicking on Count shows the genes that drive the
enrichment. You can also click on the individual numbers in
the Count column, to show the driving genes for that individual
GO category.
Clicking on the GO identifiers takes you to the Gene Ontology web
pages.
— Click on the Help button again to close this help window.
Help |
Hide |
Top
Help |
Show |
Top
GO MF test for over-representation
HELP
List of all enriched GO categories (molecular function), at the 0.05
p-value level.
The columns:
- ExpCount is the expected count of genes in the
module annotated with the given GO term, just by chance.
- Count
is the number of genes in the module annotated with the given GO
term.
- Size is the total number of genes (in our universe)
annotated with the GO term.
Clicking on Count shows the genes that drive the
enrichment. You can also click on the individual numbers in
the Count column, to show the driving genes for that individual
GO category.
Clicking on the GO identifiers takes you to the Gene Ontology web
pages.
— Click on the Help button again to close this help window.
| Id | Pvalue | ExpCount | Count | Size | Term |
| GO:0031420 | 2.511e-02 | 0.8927 | 6
FXYD2, KCNIP1, KCNJ16, PKLR, SCN1B, SLC5A5 | 74 | alkali metal ion binding |
Help |
Hide |
Top
Help |
Show |
Top
KEGG Pathway test for over-representation
HELP
List of all enriched KEGG pathways, at the 0.05
p-value level.
The columns:
- ExpCount is the expected count of genes in the
module annotated with the given KEGG pathway, just by chance.
- Count
is the number of genes in the module annotated with the given KEGG
pathway.
- Size is the total number of genes (in our universe)
annotated with the KEGG pathway.
Clicking on Count shows the genes that drive the
enrichment. You can also click on the individual numbers in
the Count column, to show the driving genes for that individual
KEGG pathway.
Clicking on the KEGG identifiers takes you to the KEGG web site.
— Click on the Help button again to close this help window.
Help |
Hide |
Top
Help |
Show |
Top
miRNA test for over-representation
HELP
List of all enriched miRNA families, at the 0.05
p-value level.
The columns:
- ExpCount is the expected count of genes in the
module regulated by the given miRNA family, just by chance.
- Count
is the number of genes in the module regulated by the given miRNA
family.
- Size is the total number of genes (in our universe)
regulated with the given miRNA family.
Clicking on Count shows the genes that drive the
enrichment. You can also click on the individual numbers in
the Count column, to show the driving genes for that individual
miRNA family.
The miRNA regulation data was taken from the TargetScan database.
(Only the conserved sites were used for the current analysis.)
Clicking on the miRNA names takes you to the TargetScan web site.
— Click on the Help button again to close this help window.
Help |
Hide |
Top
Help |
Show |
Top
Chromosome test for over-representation
HELP
List of all enriched Chromosomes, at the 0.05
p-value level.
The columns:
- ExpCount is the expected number of genes in the
module on the given chromosome, just by chance.
- Count
is the number of genes in the module on the given chromosome.
- Size is the total number of genes (in our universe)
on the given chromosome.
Clicking on Count shows the genes that drive the
enrichment. You can also click on the individual numbers in
the Count column, to show the driving genes for that individual
chromosome.
— Click on the Help button again to close this help window.
HELP
A list of all genes in the current module, in alphabetical order. The
size of the text corresponds to the gene scores.
Note that some gene symbols may show up more than once, if many
probes match the same Entrez gene.
Genes with no Entrez mapping are given separately, with their
Affymetrics probe ID.
— Click on the Help button again to close this help window.
Entrez genes
ACSL6acyl-CoA synthetase long-chain family member 6 (211207_s_at), score: -0.66
ACTN3actinin, alpha 3 (206891_at), score: 0.61
ADAMDEC1ADAM-like, decysin 1 (206134_at), score: -0.8
ADAMTS7ADAM metallopeptidase with thrombospondin type 1 motif, 7 (220705_s_at), score: 0.6
ADAMTS9ADAM metallopeptidase with thrombospondin type 1 motif, 9 (220287_at), score: -0.55
ADCK2aarF domain containing kinase 2 (221893_s_at), score: -0.51
AGAP2ArfGAP with GTPase domain, ankyrin repeat and PH domain 2 (215080_s_at), score: -0.51
ATHL1ATH1, acid trehalase-like 1 (yeast) (219359_at), score: -0.51
ATMataxia telangiectasia mutated (210858_x_at), score: 0.59
ATP8B2ATPase, class I, type 8B, member 2 (216873_s_at), score: 0.6
AVILadvillin (205539_at), score: 0.63
BBS10Bardet-Biedl syndrome 10 (219487_at), score: 0.58
C21orf2chromosome 21 open reading frame 2 (203996_s_at), score: 0.8
C3AR1complement component 3a receptor 1 (209906_at), score: 0.6
C4orf29chromosome 4 open reading frame 29 (219980_at), score: -0.62
CCDC121coiled-coil domain containing 121 (220321_s_at), score: -0.52
CD200CD200 molecule (209583_s_at), score: -0.73
CD28CD28 molecule (206545_at), score: -0.61
CDH19cadherin 19, type 2 (206898_at), score: -0.84
CHN2chimerin (chimaerin) 2 (207486_x_at), score: -0.62
CHRNA5cholinergic receptor, nicotinic, alpha 5 (206533_at), score: -0.56
COQ7coenzyme Q7 homolog, ubiquinone (yeast) (209745_at), score: -0.56
CSTF2Tcleavage stimulation factor, 3' pre-RNA, subunit 2, 64kDa, tau variant (212905_at), score: -0.59
CTSScathepsin S (202901_x_at), score: -0.77
CXCL11chemokine (C-X-C motif) ligand 11 (210163_at), score: -0.6
CYP26B1cytochrome P450, family 26, subfamily B, polypeptide 1 (219825_at), score: -0.58
DSCR6Down syndrome critical region gene 6 (207267_s_at), score: -0.78
ELAC1elaC homolog 1 (E. coli) (219325_s_at), score: 0.64
ELLelongation factor RNA polymerase II (204095_s_at), score: 0.67
EML2echinoderm microtubule associated protein like 2 (204398_s_at), score: 0.63
EPHA3EPH receptor A3 (211164_at), score: -0.78
ERBB4v-erb-a erythroblastic leukemia viral oncogene homolog 4 (avian) (214053_at), score: -0.7
FAM169Afamily with sequence similarity 169, member A (213954_at), score: -0.49
FBRSfibrosin (218255_s_at), score: 0.57
FBXO2F-box protein 2 (219305_x_at), score: 0.63
FBXO22F-box protein 22 (219638_at), score: -0.77
FCGR2AFc fragment of IgG, low affinity IIa, receptor (CD32) (203561_at), score: -0.55
FKRPfukutin related protein (219853_at), score: -0.68
FOXK2forkhead box K2 (203064_s_at), score: -0.56
FRMD4BFERM domain containing 4B (213056_at), score: -0.76
FXYD2FXYD domain containing ion transport regulator 2 (207434_s_at), score: 0.61
GEMIN8gem (nuclear organelle) associated protein 8 (219252_s_at), score: -0.56
GLMNglomulin, FKBP associated protein (207153_s_at), score: 0.65
GNL3LPguanine nucleotide binding protein-like 3 (nucleolar)-like pseudogene (220716_at), score: 0.57
GPX3glutathione peroxidase 3 (plasma) (214091_s_at), score: -0.5
GSTCDglutathione S-transferase, C-terminal domain containing (220063_at), score: -0.86
HABP4hyaluronan binding protein 4 (209818_s_at), score: -0.51
HAMPhepcidin antimicrobial peptide (220491_at), score: 0.62
HCG8HLA complex group 8 (215985_at), score: -1
HOXB6homeobox B6 (205366_s_at), score: -0.57
HRASLSHRAS-like suppressor (219983_at), score: -0.62
ICA1islet cell autoantigen 1, 69kDa (211740_at), score: -0.7
IGFALSinsulin-like growth factor binding protein, acid labile subunit (215712_s_at), score: 0.75
IRF6interferon regulatory factor 6 (202597_at), score: -0.49
KCNIP1Kv channel interacting protein 1 (221307_at), score: -0.68
KCNJ16potassium inwardly-rectifying channel, subfamily J, member 16 (219564_at), score: -0.51
KIAA1107KIAA1107 (214098_at), score: -0.52
KIF26Bkinesin family member 26B (220002_at), score: 0.62
LILRB3leukocyte immunoglobulin-like receptor, subfamily B (with TM and ITIM domains), member 3 (211133_x_at), score: 0.58
LIMD1LIM domains containing 1 (218850_s_at), score: -0.54
LOC100130703similar to hCG2042168 (207596_at), score: -0.65
LOC100132247similar to Uncharacterized protein KIAA0220 (215002_at), score: -0.91
LOC100133105hypothetical protein LOC100133105 (214237_x_at), score: 0.63
LOC100133748similar to GTF2IRD2 protein (215569_at), score: 0.61
LOC149501similar to keratin 8 (216821_at), score: 0.74
LOC257152hypothetical protein LOC257152 (215302_at), score: -0.5
LOC729806similar to hCG1725380 (217544_at), score: -0.69
LOC93432maltase-glucoamylase-like pseudogene (216666_at), score: -0.62
MANBAmannosidase, beta A, lysosomal (203778_at), score: 0.63
MAP3K9mitogen-activated protein kinase kinase kinase 9 (213927_at), score: -0.7
MCM3APASMCM3AP antisense RNA (non-protein coding) (220459_at), score: -0.64
MFSD6major facilitator superfamily domain containing 6 (219858_s_at), score: -0.55
MRPS6mitochondrial ribosomal protein S6 (213167_s_at), score: -0.52
MTMR3myotubularin related protein 3 (202197_at), score: -0.49
MUC3Amucin 3A, cell surface associated (217117_x_at), score: 0.62
MYO5Cmyosin VC (218966_at), score: -0.77
MYRIPmyosin VIIA and Rab interacting protein (214156_at), score: -0.52
NFYCnuclear transcription factor Y, gamma (202215_s_at), score: -0.52
NMUneuromedin U (206023_at), score: -0.6
NOTCH4Notch homolog 4 (Drosophila) (205247_at), score: 0.61
NSBP1nucleosomal binding protein 1 (221606_s_at), score: -0.6
PARD6Apar-6 partitioning defective 6 homolog alpha (C. elegans) (205245_at), score: 0.61
PDE3Aphosphodiesterase 3A, cGMP-inhibited (206388_at), score: -0.77
PGPEP1pyroglutamyl-peptidase I (219891_at), score: 0.59
PKLRpyruvate kinase, liver and RBC (222078_at), score: 0.59
PLEKHA9pleckstrin homology domain containing, family A (phosphoinositide binding specific) member 9 (220157_x_at), score: 0.59
PLS1plastin 1 (I isoform) (205190_at), score: -0.7
PPIAL4Apeptidylprolyl isomerase A (cyclophilin A)-like 4A (217136_at), score: -0.64
R3HDM2R3H domain containing 2 (203831_at), score: 0.63
RASIP1Ras interacting protein 1 (220027_s_at), score: 0.62
RECQL5RecQ protein-like 5 (34063_at), score: -0.56
SCARF1scavenger receptor class F, member 1 (206995_x_at), score: -0.51
SCN1Bsodium channel, voltage-gated, type I, beta (205508_at), score: 0.68
SF4splicing factor 4 (215004_s_at), score: 0.6
SH2D3ASH2 domain containing 3A (222169_x_at), score: 0.68
SIGLEC1sialic acid binding Ig-like lectin 1, sialoadhesin (44673_at), score: 0.64
SLC12A9solute carrier family 12 (potassium/chloride transporters), member 9 (220371_s_at), score: 0.6
SLC16A6solute carrier family 16, member 6 (monocarboxylic acid transporter 7) (207038_at), score: -0.52
SLC43A1solute carrier family 43, member 1 (204394_at), score: 0.67
SLC5A5solute carrier family 5 (sodium iodide symporter), member 5 (211123_at), score: 0.57
SLC6A14solute carrier family 6 (amino acid transporter), member 14 (219795_at), score: -0.66
SLC9A3R1solute carrier family 9 (sodium/hydrogen exchanger), member 3 regulator 1 (201349_at), score: 0.57
SPTA1spectrin, alpha, erythrocytic 1 (elliptocytosis 2) (206937_at), score: -0.79
SYCP2synaptonemal complex protein 2 (206546_at), score: -0.59
TAAR2trace amine associated receptor 2 (221394_at), score: -0.78
TLR1toll-like receptor 1 (210176_at), score: -0.67
TRAPPC9trafficking protein particle complex 9 (221836_s_at), score: 0.63
TRIM45tripartite motif-containing 45 (219923_at), score: 0.7
TSPAN9tetraspanin 9 (220968_s_at), score: 0.58
TWISTNBTWIST neighbor (214729_at), score: -0.74
ZBTB6zinc finger and BTB domain containing 6 (206098_at), score: -0.54
ZKSCAN5zinc finger with KRAB and SCAN domains 5 (203730_s_at), score: -0.52
ZNF137zinc finger protein 137 (207394_at), score: -0.5
ZNF175zinc finger protein 175 (205497_at), score: -0.56
ZNF192zinc finger protein 192 (206579_at), score: -0.5
ZNF614zinc finger protein 614 (220721_at), score: -0.53
ZNF749zinc finger protein 749 (215289_at), score: -0.57
Non-Entrez genes
Unknown, score:
HELP
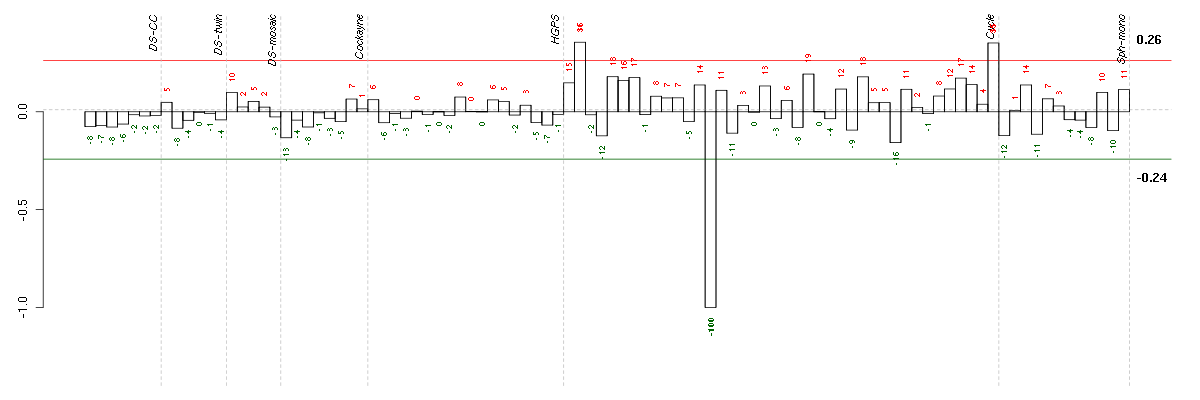
Conditions in the module, given in the same order as on the expression
plot above. Red color means over-expression, green under-expression in
the given condition.
The barplot below shows the condition (sample) scores. A separate bar
is shown for each sample, its height is the corresponding score of the
sample in the module. The red and green numbers on the bars are the
sample scores expressed in percents, i.e. 100% is 1.0.
The red and green lines show the module thresholds, samples above
the red line and below the green line are included in the module.
The different experiments that were part of the study, are separated
by dashed vertical lines.
— Click on the Help button again to close this help window.
| Id | sample | Experiment | ExpName | Array | Syndrome | Cell.line |
| E-TABM-263-raw-cel-1515485911.cel | 14 | 6 | Cycle | hgu133a2 | none | Cycle 1 |
| E-TABM-263-raw-cel-1515486431.cel | 40 | 6 | Cycle | hgu133a2 | none | Cycle 1 |
| E-TABM-263-raw-cel-1515485671.cel | 2 | 6 | Cycle | hgu133a2 | none | Cycle 1 |


© 2008-2010 Computational Biology Group, Department of Medical Genetics,
University of Lausanne, Switzerland