Previous module |
Next module
Module #597, TG: 3, TC: 1.6, 54 probes, 54 Entrez genes, 10 conditions


HELP
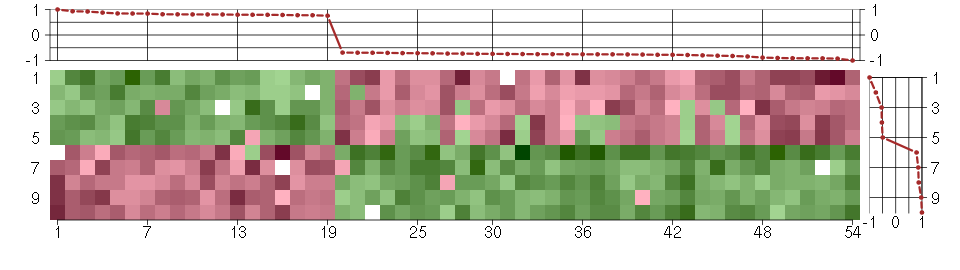
The image plot shows the color-coded level of gene expression, for the
genes and conditions in a given transcription module. The genes are on
the horizontal, the conditions on the vertical axis.
The genes are ordered according to their ISA gene scores, similarly
the conditions are ordered according to their condition scores. The
score of a gene means the «degree of inclusion» in
the module: a high score gene is essential in the module.
Condition scores can also be negative, that means that the genes of
the module are all down-regulated in the condition. Here the absolute
value of the score gives the «degree of inclusion».
The plots above and beside the expression matrix show the gene scores
and condition scores, respectively.
Note that the plot is interactive, you can see the name of the gene
and condition under the mouse cursor.
The expression matrix was normalized to have mean zero and standard
deviation one for every gene separately across all conditions
(i.e. not just for the conditions in the module).
— Click on the Help button again to close this help window.

Under-expression is coded with green,
over-expression with red color.
Help |
Hide |
Top
Help |
Show |
Top
The GO tree — Biological processes
HELP
This is one of three sections showing Gene Ontology enrichment of the
current module: in this case for biological processes.
The graph shows the hierarchy of the GO categories, their enrichment
for the current module is color coded, and the blue number beside the
category is the minus log ten p-value of the enrichment. (Calculated
using the standard hypergeometric test.) The color of the arrows code
«is a» (cyan) and «part of» relationships.
The tree was built the following way. First all GO terms with more
significant enrichment p-value than 0.05 were collected. Then all
paths from these terms to the root node of the GO tree were included
too. If a GO term is included more than once in the tree, then the
green numbers show 1) the id of the node, this makes it easier to find
other appereances of the term, and 2) the number of appearences.
Note that the same GO category might show up on the graph many
times. This is because the GO was «straightened» for this
graph, i.e. if there are more paths from a GO term to the root node of
the tree, all of them are included. The green numbers
Move the mouse cursor over the terms to get their definition. Clicking
on them takes you to the corresponding Gene Ontology web page.
If you cannot see a graph here at all, that means that there were no
significantly enriched GO categories, at the 0.05 level.
— Click on the Help button again to close this help window.
transport
The directed movement of substances (such as macromolecules, small molecules, ions) into, out of, within or between cells, or within a multicellular organism.
ion transport
The directed movement of charged atoms or small charged molecules into, out of, within or between cells.
cation transport
The directed movement of cations, atoms or small molecules with a net positive charge, into, out of, within or between cells.
biological_process
Any process specifically pertinent to the functioning of integrated living units: cells, tissues, organs, and organisms. A process is a collection of molecular events with a defined beginning and end.
monovalent inorganic cation transport
The directed movement of inorganic cations with a valency of one into, out of, within or between cells. Inorganic cations are atoms or small molecules with a positive charge which do not contain carbon in covalent linkage.
localization
Any process by which a cell, a substance, or a cellular entity, such as a protein complex or organelle, is transported to, and/or maintained in a specific location.
establishment of localization
The directed movement of a cell, substance or cellular entity, such as a protein complex or organelle, to a specific location.
all
This term is the most general term possible
establishment of localization
The directed movement of a cell, substance or cellular entity, such as a protein complex or organelle, to a specific location.
Help |
Hide |
Top
Help |
Show |
Top
The GO tree — Cellular Components
HELP
This is one of three sections showing Gene Ontology enrichment of the
current module: in this case for cellular components.
The graph shows the hierarchy of the GO categories, their enrichment
for the current module is color coded, and the blue number beside the
category is the minus log ten p-value of the enrichment. (Calculated
using the standard hypergeometric test.) The color of the arrows code
«is a» (cyan) and «part of» relationships.
The tree was built the following way. First all GO terms with more
significant enrichment p-value than 0.05 were collected. Then all
paths from these terms to the root node of the GO tree were included
too. If a GO term is included more than once in the tree, then the
green numbers show 1) the id of the node, this makes it easier to find
other appereances of the term, and 2) the number of appearences.
Note that the same GO category might show up on the graph many
times. This is because the GO was «straightened» for this
graph, i.e. if there are more paths from a GO term to the root node of
the tree, all of them are included. The green numbers
Move the mouse cursor over the terms to get their definition. Clicking
on them takes you to the corresponding Gene Ontology web page.
If you cannot see a graph here at all, that means that there were no
significantly enriched GO categories, at the 0.05 level.
— Click on the Help button again to close this help window.
Help |
Hide |
Top
Help |
Show |
Top
The GO tree — Molecular Function
HELP
This is one of three sections showing Gene Ontology enrichment of the
current module: in this case for molecular function.
The graph shows the hierarchy of the GO categories, their enrichment
for the current module is color coded, and the blue number beside the
category is the minus log ten p-value of the enrichment. (Calculated
using the standard hypergeometric test.) The color of the arrows code
«is a» (cyan) and «part of» relationships.
The tree was built the following way. First all GO terms with more
significant enrichment p-value than 0.05 were collected. Then all
paths from these terms to the root node of the GO tree were included
too. If a GO term is included more than once in the tree, then the
green numbers show 1) the id of the node, this makes it easier to find
other appereances of the term, and 2) the number of appearences.
Note that the same GO category might show up on the graph many
times. This is because the GO was «straightened» for this
graph, i.e. if there are more paths from a GO term to the root node of
the tree, all of them are included. The green numbers
Move the mouse cursor over the terms to get their definition. Clicking
on them takes you to the corresponding Gene Ontology web page.
If you cannot see a graph here at all, that means that there were no
significantly enriched GO categories, at the 0.05 level.
— Click on the Help button again to close this help window.
Help |
Hide |
Top
Help |
Show |
Top
GO BP test for over-representation
HELP
List of all enriched GO categories (biological processes), at the 0.05
p-value level.
The columns:
- ExpCount is the expected count of genes in the
module annotated with the given GO term, just by chance.
- Count
is the number of genes in the module annotated with the given GO
term.
- Size is the total number of genes (in our universe)
annotated with the GO term.
Clicking on Count shows the genes that drive the
enrichment. You can also click on the individual numbers in
the Count column, to show the driving genes for that individual
GO category.
Clicking on the GO identifiers takes you to the Gene Ontology web
pages.
— Click on the Help button again to close this help window.
| Id | Pvalue | ExpCount | Count | Size | Term |
| GO:0015672 | 8.435e-04 | 0.7059 | 7
KCNJ15, KCTD13, KCTD2, NEDD4L, SLC38A4, TRAPPC10, UCP2 | 127 | monovalent inorganic cation transport |
| GO:0006812 | 1.390e-02 | 1.201 | 7
KCNJ15, KCTD13, KCTD2, NEDD4L, SLC38A4, TRAPPC10, UCP2 | 216 | cation transport |
| GO:0030001 | 2.294e-02 | 0.945 | 6
KCNJ15, KCTD13, KCTD2, NEDD4L, SLC38A4, TRAPPC10 | 170 | metal ion transport |
| GO:0006811 | 4.646e-02 | 1.59 | 7
KCNJ15, KCTD13, KCTD2, NEDD4L, SLC38A4, TRAPPC10, UCP2 | 286 | ion transport |
Help |
Hide |
Top
Help |
Show |
Top
GO CC test for over-representation
HELP
List of all enriched GO categories (cellular components), at the 0.05
p-value level.
The columns:
- ExpCount is the expected count of genes in the
module annotated with the given GO term, just by chance.
- Count
is the number of genes in the module annotated with the given GO
term.
- Size is the total number of genes (in our universe)
annotated with the GO term.
Clicking on Count shows the genes that drive the
enrichment. You can also click on the individual numbers in
the Count column, to show the driving genes for that individual
GO category.
Clicking on the GO identifiers takes you to the Gene Ontology web
pages.
— Click on the Help button again to close this help window.
| Id | Pvalue | ExpCount | Count | Size | Term |
| GO:0044421 | 4.353e-02 | 2.31 | 8
CLCF1, COL7A1, FURIN, IL13RA2, IL33, KIT, MTM1, PRSS3 | 376 | extracellular region part |
Help |
Hide |
Top
Help |
Show |
Top
GO MF test for over-representation
HELP
List of all enriched GO categories (molecular function), at the 0.05
p-value level.
The columns:
- ExpCount is the expected count of genes in the
module annotated with the given GO term, just by chance.
- Count
is the number of genes in the module annotated with the given GO
term.
- Size is the total number of genes (in our universe)
annotated with the GO term.
Clicking on Count shows the genes that drive the
enrichment. You can also click on the individual numbers in
the Count column, to show the driving genes for that individual
GO category.
Clicking on the GO identifiers takes you to the Gene Ontology web
pages.
— Click on the Help button again to close this help window.
| Id | Pvalue | ExpCount | Count | Size | Term |
| GO:0005249 | 3.098e-02 | 0.1385 | 3
KCNJ15, KCTD13, KCTD2 | 24 | voltage-gated potassium channel activity |
| GO:0005267 | 4.855e-02 | 0.1731 | 3
KCNJ15, KCTD13, KCTD2 | 30 | potassium channel activity |
Help |
Hide |
Top
Help |
Show |
Top
KEGG Pathway test for over-representation
HELP
List of all enriched KEGG pathways, at the 0.05
p-value level.
The columns:
- ExpCount is the expected count of genes in the
module annotated with the given KEGG pathway, just by chance.
- Count
is the number of genes in the module annotated with the given KEGG
pathway.
- Size is the total number of genes (in our universe)
annotated with the KEGG pathway.
Clicking on Count shows the genes that drive the
enrichment. You can also click on the individual numbers in
the Count column, to show the driving genes for that individual
KEGG pathway.
Clicking on the KEGG identifiers takes you to the KEGG web site.
— Click on the Help button again to close this help window.
Help |
Hide |
Top
Help |
Show |
Top
miRNA test for over-representation
HELP
List of all enriched miRNA families, at the 0.05
p-value level.
The columns:
- ExpCount is the expected count of genes in the
module regulated by the given miRNA family, just by chance.
- Count
is the number of genes in the module regulated by the given miRNA
family.
- Size is the total number of genes (in our universe)
regulated with the given miRNA family.
Clicking on Count shows the genes that drive the
enrichment. You can also click on the individual numbers in
the Count column, to show the driving genes for that individual
miRNA family.
The miRNA regulation data was taken from the TargetScan database.
(Only the conserved sites were used for the current analysis.)
Clicking on the miRNA names takes you to the TargetScan web site.
— Click on the Help button again to close this help window.
Help |
Hide |
Top
Help |
Show |
Top
Chromosome test for over-representation
HELP
List of all enriched Chromosomes, at the 0.05
p-value level.
The columns:
- ExpCount is the expected number of genes in the
module on the given chromosome, just by chance.
- Count
is the number of genes in the module on the given chromosome.
- Size is the total number of genes (in our universe)
on the given chromosome.
Clicking on Count shows the genes that drive the
enrichment. You can also click on the individual numbers in
the Count column, to show the driving genes for that individual
chromosome.
— Click on the Help button again to close this help window.
HELP
A list of all genes in the current module, in alphabetical order. The
size of the text corresponds to the gene scores.
Note that some gene symbols may show up more than once, if many
probes match the same Entrez gene.
Genes with no Entrez mapping are given separately, with their
Affymetrics probe ID.
— Click on the Help button again to close this help window.
Entrez genes
ANKRD28ankyrin repeat domain 28 (213035_at), score: 0.81
ANXA10annexin A10 (210143_at), score: -0.76
ASTN2astrotactin 2 (209693_at), score: 0.81
B3GNTL1UDP-GlcNAc:betaGal beta-1,3-N-acetylglucosaminyltransferase-like 1 (213589_s_at), score: 0.8
B4GALT5UDP-Gal:betaGlcNAc beta 1,4- galactosyltransferase, polypeptide 5 (221484_at), score: -0.8
BAXBCL2-associated X protein (208478_s_at), score: 0.81
BTN3A1butyrophilin, subfamily 3, member A1 (209770_at), score: 0.78
C16orf57chromosome 16 open reading frame 57 (218060_s_at), score: -0.7
C17orf39chromosome 17 open reading frame 39 (220058_at), score: 0.79
C2CD2LC2CD2-like (204757_s_at), score: -0.76
CCNE1cyclin E1 (213523_at), score: -0.75
CDCA4cell division cycle associated 4 (218399_s_at), score: -0.91
CLCF1cardiotrophin-like cytokine factor 1 (219500_at), score: -0.76
COL7A1collagen, type VII, alpha 1 (217312_s_at), score: -0.71
CYTH1cytohesin 1 (202880_s_at), score: -0.91
DIRAS3DIRAS family, GTP-binding RAS-like 3 (215506_s_at), score: -0.76
EIF4EBP2eukaryotic translation initiation factor 4E binding protein 2 (208770_s_at), score: -0.75
FAM168Bfamily with sequence similarity 168, member B (212017_at), score: -0.78
FAM29Afamily with sequence similarity 29, member A (218602_s_at), score: -0.7
FAM86Cfamily with sequence similarity 86, member C (220353_at), score: 0.79
FLJ12529pre-mRNA cleavage factor I, 59 kDa subunit (217866_at), score: -0.74
FURINfurin (paired basic amino acid cleaving enzyme) (201945_at), score: -0.73
GIT1G protein-coupled receptor kinase interacting ArfGAP 1 (218030_at), score: -0.92
IL13RA2interleukin 13 receptor, alpha 2 (206172_at), score: -0.72
IL33interleukin 33 (209821_at), score: -0.78
IPPKinositol 1,3,4,5,6-pentakisphosphate 2-kinase (219092_s_at), score: -0.93
KCNJ15potassium inwardly-rectifying channel, subfamily J, member 15 (210119_at), score: -0.73
KCTD13potassium channel tetramerisation domain containing 13 (45653_at), score: -0.74
KCTD2potassium channel tetramerisation domain containing 2 (212564_at), score: -0.69
KITv-kit Hardy-Zuckerman 4 feline sarcoma viral oncogene homolog (205051_s_at), score: 0.8
MAP1Smicrotubule-associated protein 1S (218522_s_at), score: -0.82
MTM1myotubularin 1 (36920_at), score: -0.69
NEDD4Lneural precursor cell expressed, developmentally down-regulated 4-like (212445_s_at), score: -0.9
NFATC2IPnuclear factor of activated T-cells, cytoplasmic, calcineurin-dependent 2 interacting protein (217526_at), score: -1
NUPL1nucleoporin like 1 (204435_at), score: -0.74
PCCApropionyl Coenzyme A carboxylase, alpha polypeptide (203860_at), score: 0.84
PRSS3protease, serine, 3 (213421_x_at), score: -0.71
PSMB9proteasome (prosome, macropain) subunit, beta type, 9 (large multifunctional peptidase 2) (204279_at), score: 0.76
RABL3RAB, member of RAS oncogene family-like 3 (213970_at), score: 0.84
RALGDSral guanine nucleotide dissociation stimulator (209050_s_at), score: 0.85
RBM4BRNA binding motif protein 4B (209497_s_at), score: 0.77
RIPK1receptor (TNFRSF)-interacting serine-threonine kinase 1 (209941_at), score: -0.81
SAT1spermidine/spermine N1-acetyltransferase 1 (213988_s_at), score: -0.78
SETMARSET domain and mariner transposase fusion gene (206554_x_at), score: 0.92
SLC16A6solute carrier family 16, member 6 (monocarboxylic acid transporter 7) (207038_at), score: -0.84
SLC38A4solute carrier family 38, member 4 (220786_s_at), score: 0.88
SPAG1sperm associated antigen 1 (210117_at), score: -0.77
SYT11synaptotagmin XI (209198_s_at), score: 0.93
TBPTATA box binding protein (203135_at), score: -0.76
TOXthymocyte selection-associated high mobility group box (204529_s_at), score: 0.81
TRAPPC10trafficking protein particle complex 10 (209412_at), score: -0.75
UCP2uncoupling protein 2 (mitochondrial, proton carrier) (208998_at), score: 1
XPO4exportin 4 (218479_s_at), score: 0.79
ZDHHC18zinc finger, DHHC-type containing 18 (212860_at), score: -0.89
Non-Entrez genes
Unknown, score:
HELP
Conditions in the module, given in the same order as on the expression
plot above. Red color means over-expression, green under-expression in
the given condition.
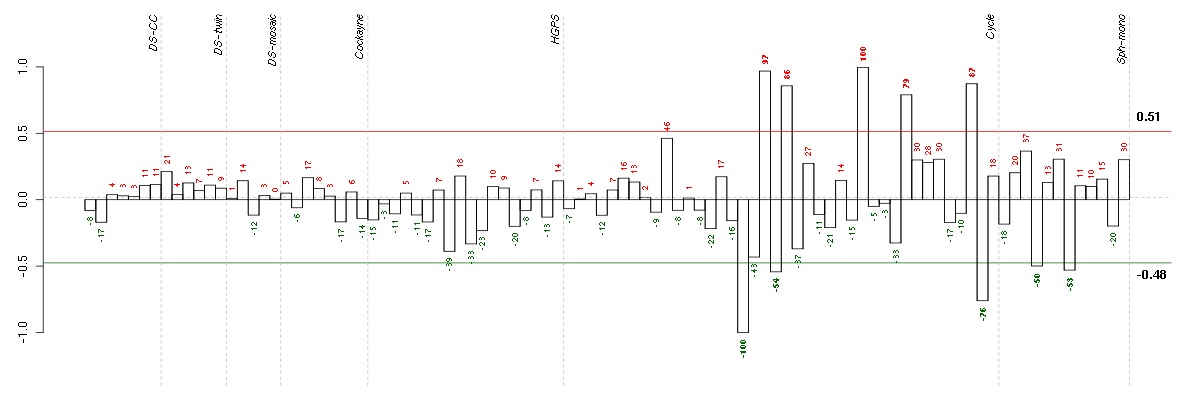
The barplot below shows the condition (sample) scores. A separate bar
is shown for each sample, its height is the corresponding score of the
sample in the module. The red and green numbers on the bars are the
sample scores expressed in percents, i.e. 100% is 1.0.
The red and green lines show the module thresholds, samples above
the red line and below the green line are included in the module.
The different experiments that were part of the study, are separated
by dashed vertical lines.
— Click on the Help button again to close this help window.
| Id | sample | Experiment | ExpName | Array | Syndrome | Cell.line |
| E-TABM-263-raw-cel-1515485971.cel | 17 | 6 | Cycle | hgu133a2 | none | Cycle 1 |
| E-TABM-263-raw-cel-1515486411.cel | 39 | 6 | Cycle | hgu133a2 | none | Cycle 1 |
| E-TABM-263-raw-cel-1515486031.cel | 20 | 6 | Cycle | hgu133a2 | none | Cycle 1 |
| E-GEOD-4219-raw-cel-1311956398.cel | 12 | 7 | Sph-mono | hgu133plus2 | none | Sph-mon 1 |
| E-GEOD-4219-raw-cel-1311956275.cel | 8 | 7 | Sph-mono | hgu133plus2 | none | Sph-mon 1 |
| E-TABM-263-raw-cel-1515486271.cel | 32 | 6 | Cycle | hgu133a2 | none | Cycle 1 |
| E-TABM-263-raw-cel-1515486051.cel | 21 | 6 | Cycle | hgu133a2 | none | Cycle 1 |
| E-TABM-263-raw-cel-1515486391.cel | 38 | 6 | Cycle | hgu133a2 | none | Cycle 1 |
| E-TABM-263-raw-cel-1515486011.cel | 19 | 6 | Cycle | hgu133a2 | none | Cycle 1 |
| E-TABM-263-raw-cel-1515486191.cel | 28 | 6 | Cycle | hgu133a2 | none | Cycle 1 |


© 2008-2010 Computational Biology Group, Department of Medical Genetics,
University of Lausanne, Switzerland