Previous module |
Next module
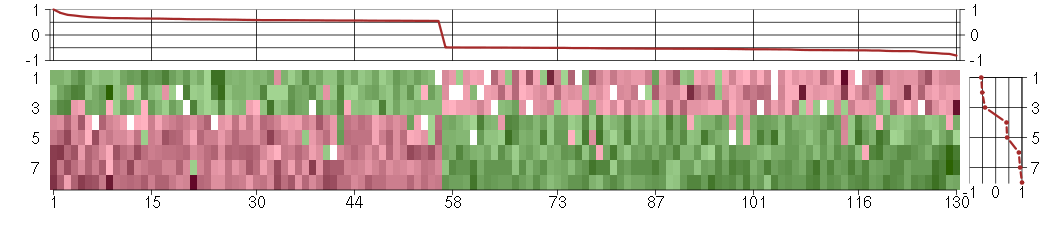
Module #792, TG: 2.6, TC: 1.6, 130 probes, 128 Entrez genes, 8 conditions


HELP
The image plot shows the color-coded level of gene expression, for the
genes and conditions in a given transcription module. The genes are on
the horizontal, the conditions on the vertical axis.
The genes are ordered according to their ISA gene scores, similarly
the conditions are ordered according to their condition scores. The
score of a gene means the «degree of inclusion» in
the module: a high score gene is essential in the module.
Condition scores can also be negative, that means that the genes of
the module are all down-regulated in the condition. Here the absolute
value of the score gives the «degree of inclusion».
The plots above and beside the expression matrix show the gene scores
and condition scores, respectively.
Note that the plot is interactive, you can see the name of the gene
and condition under the mouse cursor.
The expression matrix was normalized to have mean zero and standard
deviation one for every gene separately across all conditions
(i.e. not just for the conditions in the module).
— Click on the Help button again to close this help window.

Under-expression is coded with green,
over-expression with red color.
Help |
Hide |
Top
Help |
Show |
Top
The GO tree — Biological processes
HELP
This is one of three sections showing Gene Ontology enrichment of the
current module: in this case for biological processes.
The graph shows the hierarchy of the GO categories, their enrichment
for the current module is color coded, and the blue number beside the
category is the minus log ten p-value of the enrichment. (Calculated
using the standard hypergeometric test.) The color of the arrows code
«is a» (cyan) and «part of» relationships.
The tree was built the following way. First all GO terms with more
significant enrichment p-value than 0.05 were collected. Then all
paths from these terms to the root node of the GO tree were included
too. If a GO term is included more than once in the tree, then the
green numbers show 1) the id of the node, this makes it easier to find
other appereances of the term, and 2) the number of appearences.
Note that the same GO category might show up on the graph many
times. This is because the GO was «straightened» for this
graph, i.e. if there are more paths from a GO term to the root node of
the tree, all of them are included. The green numbers
Move the mouse cursor over the terms to get their definition. Clicking
on them takes you to the corresponding Gene Ontology web page.
If you cannot see a graph here at all, that means that there were no
significantly enriched GO categories, at the 0.05 level.
— Click on the Help button again to close this help window.
Help |
Hide |
Top
Help |
Show |
Top
The GO tree — Cellular Components
HELP
This is one of three sections showing Gene Ontology enrichment of the
current module: in this case for cellular components.
The graph shows the hierarchy of the GO categories, their enrichment
for the current module is color coded, and the blue number beside the
category is the minus log ten p-value of the enrichment. (Calculated
using the standard hypergeometric test.) The color of the arrows code
«is a» (cyan) and «part of» relationships.
The tree was built the following way. First all GO terms with more
significant enrichment p-value than 0.05 were collected. Then all
paths from these terms to the root node of the GO tree were included
too. If a GO term is included more than once in the tree, then the
green numbers show 1) the id of the node, this makes it easier to find
other appereances of the term, and 2) the number of appearences.
Note that the same GO category might show up on the graph many
times. This is because the GO was «straightened» for this
graph, i.e. if there are more paths from a GO term to the root node of
the tree, all of them are included. The green numbers
Move the mouse cursor over the terms to get their definition. Clicking
on them takes you to the corresponding Gene Ontology web page.
If you cannot see a graph here at all, that means that there were no
significantly enriched GO categories, at the 0.05 level.
— Click on the Help button again to close this help window.
extracellular region
The space external to the outermost structure of a cell. For cells without external protective or external encapsulating structures this refers to space outside of the plasma membrane. This term covers the host cell environment outside an intracellular parasite.
cellular_component
The part of a cell or its extracellular environment in which a gene product is located. A gene product may be located in one or more parts of a cell and its location may be as specific as a particular macromolecular complex, that is, a stable, persistent association of macromolecules that function together.
all
This term is the most general term possible
Help |
Hide |
Top
Help |
Show |
Top
The GO tree — Molecular Function
HELP
This is one of three sections showing Gene Ontology enrichment of the
current module: in this case for molecular function.
The graph shows the hierarchy of the GO categories, their enrichment
for the current module is color coded, and the blue number beside the
category is the minus log ten p-value of the enrichment. (Calculated
using the standard hypergeometric test.) The color of the arrows code
«is a» (cyan) and «part of» relationships.
The tree was built the following way. First all GO terms with more
significant enrichment p-value than 0.05 were collected. Then all
paths from these terms to the root node of the GO tree were included
too. If a GO term is included more than once in the tree, then the
green numbers show 1) the id of the node, this makes it easier to find
other appereances of the term, and 2) the number of appearences.
Note that the same GO category might show up on the graph many
times. This is because the GO was «straightened» for this
graph, i.e. if there are more paths from a GO term to the root node of
the tree, all of them are included. The green numbers
Move the mouse cursor over the terms to get their definition. Clicking
on them takes you to the corresponding Gene Ontology web page.
If you cannot see a graph here at all, that means that there were no
significantly enriched GO categories, at the 0.05 level.
— Click on the Help button again to close this help window.
Help |
Hide |
Top
Help |
Show |
Top
GO BP test for over-representation
HELP
List of all enriched GO categories (biological processes), at the 0.05
p-value level.
The columns:
- ExpCount is the expected count of genes in the
module annotated with the given GO term, just by chance.
- Count
is the number of genes in the module annotated with the given GO
term.
- Size is the total number of genes (in our universe)
annotated with the GO term.
Clicking on Count shows the genes that drive the
enrichment. You can also click on the individual numbers in
the Count column, to show the driving genes for that individual
GO category.
Clicking on the GO identifiers takes you to the Gene Ontology web
pages.
— Click on the Help button again to close this help window.
| Id | Pvalue | ExpCount | Count | Size | Term |
| GO:0006349 | 3.207e-02 | 0.03919 | 2
DIRAS3, IGF2 | 3 | genetic imprinting |
Help |
Hide |
Top
Help |
Show |
Top
GO CC test for over-representation
HELP
List of all enriched GO categories (cellular components), at the 0.05
p-value level.
The columns:
- ExpCount is the expected count of genes in the
module annotated with the given GO term, just by chance.
- Count
is the number of genes in the module annotated with the given GO
term.
- Size is the total number of genes (in our universe)
annotated with the GO term.
Clicking on Count shows the genes that drive the
enrichment. You can also click on the individual numbers in
the Count column, to show the driving genes for that individual
GO category.
Clicking on the GO identifiers takes you to the Gene Ontology web
pages.
— Click on the Help button again to close this help window.
| Id | Pvalue | ExpCount | Count | Size | Term |
| GO:0005576 | 5.062e-03 | 9.474 | 22
ADAMTS6, CLCA2, CLCF1, CLEC3B, COL5A3, CST6, CXCL6, DPP4, EGFL6, EMCN, EPO, EREG, FAM131A, HGF, IGF2, IL13RA2, IL33, MMP16, NMB, OLFML2A, PENK, PRSS3 | 673 | extracellular region |
Help |
Hide |
Top
Help |
Show |
Top
GO MF test for over-representation
HELP
List of all enriched GO categories (molecular function), at the 0.05
p-value level.
The columns:
- ExpCount is the expected count of genes in the
module annotated with the given GO term, just by chance.
- Count
is the number of genes in the module annotated with the given GO
term.
- Size is the total number of genes (in our universe)
annotated with the GO term.
Clicking on Count shows the genes that drive the
enrichment. You can also click on the individual numbers in
the Count column, to show the driving genes for that individual
GO category.
Clicking on the GO identifiers takes you to the Gene Ontology web
pages.
— Click on the Help button again to close this help window.
| Id | Pvalue | ExpCount | Count | Size | Term |
| GO:0005179 | 3.449e-02 | 0.3541 | 4
EPO, IGF2, NMB, PENK | 27 | hormone activity |
| GO:0004175 | 3.952e-02 | 2.308 | 9
ADAMTS6, CTSK, CTSO, CTSZ, DPP4, HGF, MMP16, PRSS3, PSMB9 | 176 | endopeptidase activity |
Help |
Hide |
Top
Help |
Show |
Top
KEGG Pathway test for over-representation
HELP
List of all enriched KEGG pathways, at the 0.05
p-value level.
The columns:
- ExpCount is the expected count of genes in the
module annotated with the given KEGG pathway, just by chance.
- Count
is the number of genes in the module annotated with the given KEGG
pathway.
- Size is the total number of genes (in our universe)
annotated with the KEGG pathway.
Clicking on Count shows the genes that drive the
enrichment. You can also click on the individual numbers in
the Count column, to show the driving genes for that individual
KEGG pathway.
Clicking on the KEGG identifiers takes you to the KEGG web site.
— Click on the Help button again to close this help window.
Help |
Hide |
Top
Help |
Show |
Top
miRNA test for over-representation
HELP
List of all enriched miRNA families, at the 0.05
p-value level.
The columns:
- ExpCount is the expected count of genes in the
module regulated by the given miRNA family, just by chance.
- Count
is the number of genes in the module regulated by the given miRNA
family.
- Size is the total number of genes (in our universe)
regulated with the given miRNA family.
Clicking on Count shows the genes that drive the
enrichment. You can also click on the individual numbers in
the Count column, to show the driving genes for that individual
miRNA family.
The miRNA regulation data was taken from the TargetScan database.
(Only the conserved sites were used for the current analysis.)
Clicking on the miRNA names takes you to the TargetScan web site.
— Click on the Help button again to close this help window.
Help |
Hide |
Top
Help |
Show |
Top
Chromosome test for over-representation
HELP
List of all enriched Chromosomes, at the 0.05
p-value level.
The columns:
- ExpCount is the expected number of genes in the
module on the given chromosome, just by chance.
- Count
is the number of genes in the module on the given chromosome.
- Size is the total number of genes (in our universe)
on the given chromosome.
Clicking on Count shows the genes that drive the
enrichment. You can also click on the individual numbers in
the Count column, to show the driving genes for that individual
chromosome.
— Click on the Help button again to close this help window.
HELP
A list of all genes in the current module, in alphabetical order. The
size of the text corresponds to the gene scores.
Note that some gene symbols may show up more than once, if many
probes match the same Entrez gene.
Genes with no Entrez mapping are given separately, with their
Affymetrics probe ID.
— Click on the Help button again to close this help window.
Entrez genes
ADAMTS6ADAM metallopeptidase with thrombospondin type 1 motif, 6 (220866_at), score: -0.51
AHI1Abelson helper integration site 1 (221569_at), score: -0.54
ANKRD28ankyrin repeat domain 28 (213035_at), score: 0.62
ANXA10annexin A10 (210143_at), score: -0.63
AOF2amine oxidase (flavin containing) domain 2 (212348_s_at), score: 0.68
ARNT2aryl-hydrocarbon receptor nuclear translocator 2 (202986_at), score: 0.55
B3GNTL1UDP-GlcNAc:betaGal beta-1,3-N-acetylglucosaminyltransferase-like 1 (213589_s_at), score: 0.87
BAXBCL2-associated X protein (208478_s_at), score: 0.6
BTN3A2butyrophilin, subfamily 3, member A2 (209846_s_at), score: 0.57
C11orf67chromosome 11 open reading frame 67 (221600_s_at), score: 0.59
C17orf39chromosome 17 open reading frame 39 (220058_at), score: 0.61
C1orf9chromosome 1 open reading frame 9 (203429_s_at), score: -0.49
C8orf17chromosome 8 open reading frame 17 (208266_at), score: -0.51
CCNT2cyclin T2 (204645_at), score: -0.51
CD320CD320 molecule (218529_at), score: 0.7
CD55CD55 molecule, decay accelerating factor for complement (Cromer blood group) (201925_s_at), score: -0.53
CLCA2chloride channel accessory 2 (206165_s_at), score: -0.54
CLCF1cardiotrophin-like cytokine factor 1 (219500_at), score: -0.6
CLEC1AC-type lectin domain family 1, member A (219761_at), score: -0.54
CLEC3BC-type lectin domain family 3, member B (205200_at), score: -0.55
COL5A3collagen, type V, alpha 3 (52255_s_at), score: -0.73
COPS7BCOP9 constitutive photomorphogenic homolog subunit 7B (Arabidopsis) (219997_s_at), score: 0.56
CST6cystatin E/M (206595_at), score: -0.49
CTSKcathepsin K (202450_s_at), score: -0.5
CTSOcathepsin O (203758_at), score: -0.6
CTSZcathepsin Z (210042_s_at), score: 0.66
CXCL6chemokine (C-X-C motif) ligand 6 (granulocyte chemotactic protein 2) (206336_at), score: -0.57
DARS2aspartyl-tRNA synthetase 2, mitochondrial (218365_s_at), score: 0.56
DIRAS3DIRAS family, GTP-binding RAS-like 3 (215506_s_at), score: -0.63
DNAJC7DnaJ (Hsp40) homolog, subfamily C, member 7 (202416_at), score: 0.56
DPP4dipeptidyl-peptidase 4 (211478_s_at), score: -0.5
DUSP5dual specificity phosphatase 5 (209457_at), score: -0.59
DUSP6dual specificity phosphatase 6 (208891_at), score: -0.68
EDNRBendothelin receptor type B (204271_s_at), score: -0.7
EGFL6EGF-like-domain, multiple 6 (219454_at), score: -0.49
EIF4EBP2eukaryotic translation initiation factor 4E binding protein 2 (208770_s_at), score: -0.56
EMCNendomucin (219436_s_at), score: 0.65
EML1echinoderm microtubule associated protein like 1 (204797_s_at), score: -0.49
EMP1epithelial membrane protein 1 (201325_s_at), score: -0.5
EPOerythropoietin (217254_s_at), score: 0.62
EREGepiregulin (205767_at), score: -0.53
ERO1LERO1-like (S. cerevisiae) (218498_s_at), score: -0.56
EVI2Aecotropic viral integration site 2A (204774_at), score: 0.59
EVI2Becotropic viral integration site 2B (211742_s_at), score: 0.65
EXOSC5exosome component 5 (218481_at), score: 0.55
FAM131Afamily with sequence similarity 131, member A (221904_at), score: 0.58
FAM63Bfamily with sequence similarity 63, member B (214691_x_at), score: -0.59
FAM86Cfamily with sequence similarity 86, member C (220353_at), score: 0.58
FBXO31F-box protein 31 (219785_s_at), score: 0.59
FEM1Cfem-1 homolog c (C. elegans) (213341_at), score: -0.54
GAAglucosidase, alpha; acid (202812_at), score: -0.49
GANgigaxonin (220124_at), score: -0.62
GARNL1GTPase activating Rap/RanGAP domain-like 1 (214855_s_at), score: -0.49
GCC2GRIP and coiled-coil domain containing 2 (202832_at), score: -0.52
GKglycerol kinase (207387_s_at), score: -0.49
GNB1Lguanine nucleotide binding protein (G protein), beta polypeptide 1-like (220762_s_at), score: 0.66
GOLGA7golgi autoantigen, golgin subfamily a, 7 (217819_at), score: -0.5
GPM6Bglycoprotein M6B (209167_at), score: -0.61
GPR177G protein-coupled receptor 177 (221958_s_at), score: -0.5
GPR65G protein-coupled receptor 65 (214467_at), score: -0.54
GPSM3G-protein signaling modulator 3 (AGS3-like, C. elegans) (204265_s_at), score: 0.57
GTF2H4general transcription factor IIH, polypeptide 4, 52kDa (203577_at), score: 0.64
HGFhepatocyte growth factor (hepapoietin A; scatter factor) (209960_at), score: -0.59
HINFPhistone H4 transcription factor (206495_s_at), score: 0.58
HIST1H2BKhistone cluster 1, H2bk (209806_at), score: -0.56
HIST1H4Hhistone cluster 1, H4h (208180_s_at), score: -0.6
HOXD1homeobox D1 (205975_s_at), score: -0.5
IGF2insulin-like growth factor 2 (somatomedin A) (202409_at), score: -0.53
IL13RA2interleukin 13 receptor, alpha 2 (206172_at), score: -0.55
IL33interleukin 33 (209821_at), score: -0.71
IPPKinositol 1,3,4,5,6-pentakisphosphate 2-kinase (219092_s_at), score: -0.59
KCNJ15potassium inwardly-rectifying channel, subfamily J, member 15 (210119_at), score: -0.54
KCTD14potassium channel tetramerisation domain containing 14 (58916_at), score: 0.79
KIRRELkin of IRRE like (Drosophila) (220825_s_at), score: 0.58
LEMD3LEM domain containing 3 (218604_at), score: -0.54
LMAN2Llectin, mannose-binding 2-like (221274_s_at), score: 0.57
LOC100128223hypothetical protein LOC100128223 (221264_s_at), score: 0.57
LOC388152hypothetical LOC388152 (220602_s_at), score: 0.64
LRP2low density lipoprotein-related protein 2 (205710_at), score: -0.54
MLPHmelanophilin (218211_s_at), score: 0.64
MMP16matrix metallopeptidase 16 (membrane-inserted) (207012_at), score: -0.54
MTHFSDmethenyltetrahydrofolate synthetase domain containing (218879_s_at), score: 0.66
MUSKmuscle, skeletal, receptor tyrosine kinase (207633_s_at), score: -0.63
NEFLneurofilament, light polypeptide (221805_at), score: -0.6
NFATC2IPnuclear factor of activated T-cells, cytoplasmic, calcineurin-dependent 2 interacting protein (217526_at), score: -0.56
NMBneuromedin B (205204_at), score: 0.69
NUDT1nudix (nucleoside diphosphate linked moiety X)-type motif 1 (204766_s_at), score: 0.61
OLFML2Aolfactomedin-like 2A (213075_at), score: -0.51
PAFAH1B3platelet-activating factor acetylhydrolase, isoform Ib, gamma subunit 29kDa (203228_at), score: 0.58
PENKproenkephalin (213791_at), score: -0.49
PFDN6prefoldin subunit 6 (222029_x_at), score: 0.56
PMAIP1phorbol-12-myristate-13-acetate-induced protein 1 (204285_s_at), score: -0.57
POP1processing of precursor 1, ribonuclease P/MRP subunit (S. cerevisiae) (213449_at), score: 0.63
PPFIBP1PTPRF interacting protein, binding protein 1 (liprin beta 1) (214374_s_at), score: 0.58
PRKG2protein kinase, cGMP-dependent, type II (207505_at), score: -0.74
PRSS3protease, serine, 3 (213421_x_at), score: -0.54
PSMB9proteasome (prosome, macropain) subunit, beta type, 9 (large multifunctional peptidase 2) (204279_at), score: 0.57
PTCD1pentatricopeptide repeat domain 1 (218956_s_at), score: 0.73
PTGS1prostaglandin-endoperoxide synthase 1 (prostaglandin G/H synthase and cyclooxygenase) (215813_s_at), score: -0.64
RABL3RAB, member of RAS oncogene family-like 3 (213970_at), score: 0.61
RASA2RAS p21 protein activator 2 (206636_at), score: -0.49
RBM39RNA binding motif protein 39 (207941_s_at), score: -0.56
RCC1regulator of chromosome condensation 1 (206499_s_at), score: 0.63
RNF121ring finger protein 121 (219021_at), score: 0.58
RNF138ring finger protein 138 (218738_s_at), score: -0.53
RPL14ribosomal protein L14 (219138_at), score: 0.57
SARM1sterile alpha and TIR motif containing 1 (213259_s_at), score: 0.57
SAT1spermidine/spermine N1-acetyltransferase 1 (213988_s_at), score: -0.59
SETMARSET domain and mariner transposase fusion gene (206554_x_at), score: 0.76
SFRS12splicing factor, arginine/serine-rich 12 (212721_at), score: -0.53
SLC17A7solute carrier family 17 (sodium-dependent inorganic phosphate cotransporter), member 7 (204230_s_at), score: -0.53
SLC25A28solute carrier family 25, member 28 (221432_s_at), score: -0.5
SLKSTE20-like kinase (yeast) (206875_s_at), score: -0.6
SPRY2sprouty homolog 2 (Drosophila) (204011_at), score: -0.5
SYT1synaptotagmin I (203999_at), score: -0.58
THOC6THO complex 6 homolog (Drosophila) (218848_at), score: 0.58
TMEM160transmembrane protein 160 (219219_at), score: 0.55
TMSB15Athymosin beta 15a (205347_s_at), score: 0.66
TPK1thiamin pyrophosphokinase 1 (221218_s_at), score: -0.81
UCHL5IPUCHL5 interacting protein (213334_x_at), score: 0.6
UCP2uncoupling protein 2 (mitochondrial, proton carrier) (208998_at), score: 1
VAMP1vesicle-associated membrane protein 1 (synaptobrevin 1) (213326_at), score: 0.61
YIPF1Yip1 domain family, member 1 (214733_s_at), score: 0.55
YPEL1yippee-like 1 (Drosophila) (206063_x_at), score: 0.56
ZMAT5zinc finger, matrin type 5 (218752_at), score: 0.56
ZNF219zinc finger protein 219 (219314_s_at), score: -0.61
ZNF667zinc finger protein 667 (207120_at), score: 0.56
ZNF749zinc finger protein 749 (215289_at), score: -0.53
Non-Entrez genes
206875_s_atUnknown, score: -0.54
202986_atUnknown, score: -0.5
HELP
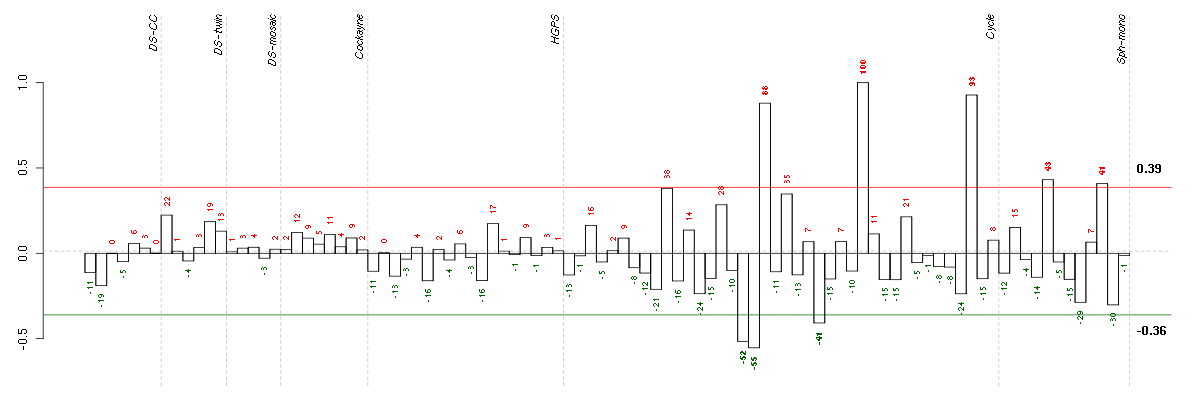
Conditions in the module, given in the same order as on the expression
plot above. Red color means over-expression, green under-expression in
the given condition.
The barplot below shows the condition (sample) scores. A separate bar
is shown for each sample, its height is the corresponding score of the
sample in the module. The red and green numbers on the bars are the
sample scores expressed in percents, i.e. 100% is 1.0.
The red and green lines show the module thresholds, samples above
the red line and below the green line are included in the module.
The different experiments that were part of the study, are separated
by dashed vertical lines.
— Click on the Help button again to close this help window.
| Id | sample | Experiment | ExpName | Array | Syndrome | Cell.line |
| E-TABM-263-raw-cel-1515485991.cel | 18 | 6 | Cycle | hgu133a2 | none | Cycle 1 |
| E-TABM-263-raw-cel-1515485971.cel | 17 | 6 | Cycle | hgu133a2 | none | Cycle 1 |
| E-TABM-263-raw-cel-1515486111.cel | 24 | 6 | Cycle | hgu133a2 | none | Cycle 1 |
| E-GEOD-4219-raw-cel-1311956614.cel | 18 | 7 | Sph-mono | hgu133plus2 | none | Sph-mon 1 |
| E-GEOD-4219-raw-cel-1311956321.cel | 9 | 7 | Sph-mono | hgu133plus2 | none | Sph-mon 1 |
| E-TABM-263-raw-cel-1515486011.cel | 19 | 6 | Cycle | hgu133a2 | none | Cycle 1 |
| E-TABM-263-raw-cel-1515486391.cel | 38 | 6 | Cycle | hgu133a2 | none | Cycle 1 |
| E-TABM-263-raw-cel-1515486191.cel | 28 | 6 | Cycle | hgu133a2 | none | Cycle 1 |


© 2008-2010 Computational Biology Group, Department of Medical Genetics,
University of Lausanne, Switzerland