Previous module |
Next module
Module #873, TG: 2.4, TC: 1.8, 109 probes, 107 Entrez genes, 6 conditions


HELP
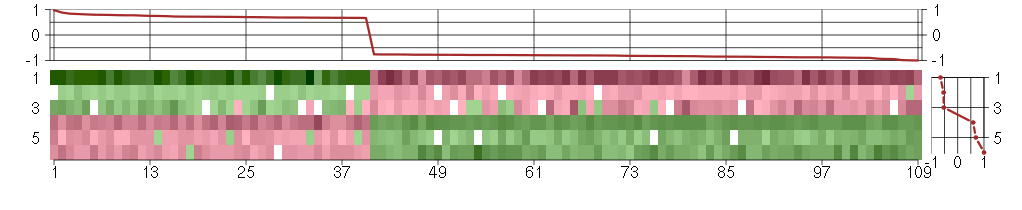
The image plot shows the color-coded level of gene expression, for the
genes and conditions in a given transcription module. The genes are on
the horizontal, the conditions on the vertical axis.
The genes are ordered according to their ISA gene scores, similarly
the conditions are ordered according to their condition scores. The
score of a gene means the «degree of inclusion» in
the module: a high score gene is essential in the module.
Condition scores can also be negative, that means that the genes of
the module are all down-regulated in the condition. Here the absolute
value of the score gives the «degree of inclusion».
The plots above and beside the expression matrix show the gene scores
and condition scores, respectively.
Note that the plot is interactive, you can see the name of the gene
and condition under the mouse cursor.
The expression matrix was normalized to have mean zero and standard
deviation one for every gene separately across all conditions
(i.e. not just for the conditions in the module).
— Click on the Help button again to close this help window.

Under-expression is coded with green,
over-expression with red color.
Help |
Hide |
Top
Help |
Show |
Top
The GO tree — Biological processes
HELP
This is one of three sections showing Gene Ontology enrichment of the
current module: in this case for biological processes.
The graph shows the hierarchy of the GO categories, their enrichment
for the current module is color coded, and the blue number beside the
category is the minus log ten p-value of the enrichment. (Calculated
using the standard hypergeometric test.) The color of the arrows code
«is a» (cyan) and «part of» relationships.
The tree was built the following way. First all GO terms with more
significant enrichment p-value than 0.05 were collected. Then all
paths from these terms to the root node of the GO tree were included
too. If a GO term is included more than once in the tree, then the
green numbers show 1) the id of the node, this makes it easier to find
other appereances of the term, and 2) the number of appearences.
Note that the same GO category might show up on the graph many
times. This is because the GO was «straightened» for this
graph, i.e. if there are more paths from a GO term to the root node of
the tree, all of them are included. The green numbers
Move the mouse cursor over the terms to get their definition. Clicking
on them takes you to the corresponding Gene Ontology web page.
If you cannot see a graph here at all, that means that there were no
significantly enriched GO categories, at the 0.05 level.
— Click on the Help button again to close this help window.
Help |
Hide |
Top
Help |
Show |
Top
The GO tree — Cellular Components
HELP
This is one of three sections showing Gene Ontology enrichment of the
current module: in this case for cellular components.
The graph shows the hierarchy of the GO categories, their enrichment
for the current module is color coded, and the blue number beside the
category is the minus log ten p-value of the enrichment. (Calculated
using the standard hypergeometric test.) The color of the arrows code
«is a» (cyan) and «part of» relationships.
The tree was built the following way. First all GO terms with more
significant enrichment p-value than 0.05 were collected. Then all
paths from these terms to the root node of the GO tree were included
too. If a GO term is included more than once in the tree, then the
green numbers show 1) the id of the node, this makes it easier to find
other appereances of the term, and 2) the number of appearences.
Note that the same GO category might show up on the graph many
times. This is because the GO was «straightened» for this
graph, i.e. if there are more paths from a GO term to the root node of
the tree, all of them are included. The green numbers
Move the mouse cursor over the terms to get their definition. Clicking
on them takes you to the corresponding Gene Ontology web page.
If you cannot see a graph here at all, that means that there were no
significantly enriched GO categories, at the 0.05 level.
— Click on the Help button again to close this help window.
Help |
Hide |
Top
Help |
Show |
Top
The GO tree — Molecular Function
HELP
This is one of three sections showing Gene Ontology enrichment of the
current module: in this case for molecular function.
The graph shows the hierarchy of the GO categories, their enrichment
for the current module is color coded, and the blue number beside the
category is the minus log ten p-value of the enrichment. (Calculated
using the standard hypergeometric test.) The color of the arrows code
«is a» (cyan) and «part of» relationships.
The tree was built the following way. First all GO terms with more
significant enrichment p-value than 0.05 were collected. Then all
paths from these terms to the root node of the GO tree were included
too. If a GO term is included more than once in the tree, then the
green numbers show 1) the id of the node, this makes it easier to find
other appereances of the term, and 2) the number of appearences.
Note that the same GO category might show up on the graph many
times. This is because the GO was «straightened» for this
graph, i.e. if there are more paths from a GO term to the root node of
the tree, all of them are included. The green numbers
Move the mouse cursor over the terms to get their definition. Clicking
on them takes you to the corresponding Gene Ontology web page.
If you cannot see a graph here at all, that means that there were no
significantly enriched GO categories, at the 0.05 level.
— Click on the Help button again to close this help window.
Help |
Hide |
Top
Help |
Show |
Top
GO BP test for over-representation
HELP
List of all enriched GO categories (biological processes), at the 0.05
p-value level.
The columns:
- ExpCount is the expected count of genes in the
module annotated with the given GO term, just by chance.
- Count
is the number of genes in the module annotated with the given GO
term.
- Size is the total number of genes (in our universe)
annotated with the GO term.
Clicking on Count shows the genes that drive the
enrichment. You can also click on the individual numbers in
the Count column, to show the driving genes for that individual
GO category.
Clicking on the GO identifiers takes you to the Gene Ontology web
pages.
— Click on the Help button again to close this help window.
| Id | Pvalue | ExpCount | Count | Size | Term |
| GO:0009653 | 1.339e-02 | 8.304 | 20
AGT, CDC42EP1, DEAF1, DMBT1, ECE1, ETV7, FOXF1, GDF9, GNG4, HAND1, HHEX, IDUA, LRP5, NINJ1, PIP5K1C, POU4F1, SCG2, TPD52, TYMP, VEGFB | 679 | anatomical structure morphogenesis |
| GO:0043062 | 3.305e-02 | 0.6726 | 5
AGT, COL11A2, FOXF1, MUC5AC, POU4F1 | 55 | extracellular structure organization |
| GO:0001991 | 4.632e-02 | 0.04892 | 2
AGT, ECE1 | 4 | regulation of systemic arterial blood pressure by circulatory renin-angiotensin |
| GO:0035050 | 4.632e-02 | 0.04892 | 2
HAND1, HHEX | 4 | embryonic heart tube development |
| GO:0046058 | 4.771e-02 | 0.4402 | 4
ADCY6, NPY2R, OPRL1, PDE8B | 36 | cAMP metabolic process |
Help |
Hide |
Top
Help |
Show |
Top
GO CC test for over-representation
HELP
List of all enriched GO categories (cellular components), at the 0.05
p-value level.
The columns:
- ExpCount is the expected count of genes in the
module annotated with the given GO term, just by chance.
- Count
is the number of genes in the module annotated with the given GO
term.
- Size is the total number of genes (in our universe)
annotated with the GO term.
Clicking on Count shows the genes that drive the
enrichment. You can also click on the individual numbers in
the Count column, to show the driving genes for that individual
GO category.
Clicking on the GO identifiers takes you to the Gene Ontology web
pages.
— Click on the Help button again to close this help window.
| Id | Pvalue | ExpCount | Count | Size | Term |
| GO:0030141 | 1.114e-02 | 0.6163 | 5
ARSA, ECE1, PECAM1, SPAG8, VEGFB | 56 | secretory granule |
| GO:0005576 | 2.461e-02 | 7.407 | 17
AGT, ARSA, COL11A2, DEAF1, DMBT1, GDF9, GPX3, GZMM, HAMP, IGHG1, IL9R, LILRA5, MFNG, MUC5AC, PECAM1, SCG2, VEGFB | 673 | extracellular region |
Help |
Hide |
Top
Help |
Show |
Top
GO MF test for over-representation
HELP
List of all enriched GO categories (molecular function), at the 0.05
p-value level.
The columns:
- ExpCount is the expected count of genes in the
module annotated with the given GO term, just by chance.
- Count
is the number of genes in the module annotated with the given GO
term.
- Size is the total number of genes (in our universe)
annotated with the GO term.
Clicking on Count shows the genes that drive the
enrichment. You can also click on the individual numbers in
the Count column, to show the driving genes for that individual
GO category.
Clicking on the GO identifiers takes you to the Gene Ontology web
pages.
— Click on the Help button again to close this help window.
Help |
Hide |
Top
Help |
Show |
Top
KEGG Pathway test for over-representation
HELP
List of all enriched KEGG pathways, at the 0.05
p-value level.
The columns:
- ExpCount is the expected count of genes in the
module annotated with the given KEGG pathway, just by chance.
- Count
is the number of genes in the module annotated with the given KEGG
pathway.
- Size is the total number of genes (in our universe)
annotated with the KEGG pathway.
Clicking on Count shows the genes that drive the
enrichment. You can also click on the individual numbers in
the Count column, to show the driving genes for that individual
KEGG pathway.
Clicking on the KEGG identifiers takes you to the KEGG web site.
— Click on the Help button again to close this help window.
Help |
Hide |
Top
Help |
Show |
Top
miRNA test for over-representation
HELP
List of all enriched miRNA families, at the 0.05
p-value level.
The columns:
- ExpCount is the expected count of genes in the
module regulated by the given miRNA family, just by chance.
- Count
is the number of genes in the module regulated by the given miRNA
family.
- Size is the total number of genes (in our universe)
regulated with the given miRNA family.
Clicking on Count shows the genes that drive the
enrichment. You can also click on the individual numbers in
the Count column, to show the driving genes for that individual
miRNA family.
The miRNA regulation data was taken from the TargetScan database.
(Only the conserved sites were used for the current analysis.)
Clicking on the miRNA names takes you to the TargetScan web site.
— Click on the Help button again to close this help window.
Help |
Hide |
Top
Help |
Show |
Top
Chromosome test for over-representation
HELP
List of all enriched Chromosomes, at the 0.05
p-value level.
The columns:
- ExpCount is the expected number of genes in the
module on the given chromosome, just by chance.
- Count
is the number of genes in the module on the given chromosome.
- Size is the total number of genes (in our universe)
on the given chromosome.
Clicking on Count shows the genes that drive the
enrichment. You can also click on the individual numbers in
the Count column, to show the driving genes for that individual
chromosome.
— Click on the Help button again to close this help window.
HELP
A list of all genes in the current module, in alphabetical order. The
size of the text corresponds to the gene scores.
Note that some gene symbols may show up more than once, if many
probes match the same Entrez gene.
Genes with no Entrez mapping are given separately, with their
Affymetrics probe ID.
— Click on the Help button again to close this help window.
Entrez genes
A1CFAPOBEC1 complementation factor (220951_s_at), score: -0.82
ABCG4ATP-binding cassette, sub-family G (WHITE), member 4 (207593_at), score: -0.78
ADCY6adenylate cyclase 6 (209195_s_at), score: 0.69
AGTangiotensinogen (serpin peptidase inhibitor, clade A, member 8) (202834_at), score: -0.77
AIPL1aryl hydrocarbon receptor interacting protein-like 1 (219977_at), score: -0.8
ALDH1L1aldehyde dehydrogenase 1 family, member L1 (215798_at), score: -0.9
ALDH3A1aldehyde dehydrogenase 3 family, memberA1 (205623_at), score: -0.79
ANXA8L2annexin A8-like 2 (203074_at), score: -0.77
ARSAarylsulfatase A (204443_at), score: 0.67
BAP1BRCA1 associated protein-1 (ubiquitin carboxy-terminal hydrolase) (201419_at), score: 0.68
BAT2HLA-B associated transcript 2 (212081_x_at), score: 0.72
BAT2LHLA-B associated transcript 2-like (212068_s_at), score: 0.8
CA4carbonic anhydrase IV (206209_s_at), score: -0.81
CALB1calbindin 1, 28kDa (205626_s_at), score: -0.82
CD79BCD79b molecule, immunoglobulin-associated beta (205297_s_at), score: -1
CDC42EP1CDC42 effector protein (Rho GTPase binding) 1 (204693_at), score: 0.69
COL11A2collagen, type XI, alpha 2 (216993_s_at), score: -0.98
COX6A2cytochrome c oxidase subunit VIa polypeptide 2 (206353_at), score: -0.82
CRIP2cysteine-rich protein 2 (208978_at), score: 0.67
DEAF1deformed epidermal autoregulatory factor 1 (Drosophila) (209407_s_at), score: 0.69
DMBT1deleted in malignant brain tumors 1 (208250_s_at), score: -0.99
DMPKdystrophia myotonica-protein kinase (37996_s_at), score: 0.73
DNAJB5DnaJ (Hsp40) homolog, subfamily B, member 5 (212817_at), score: 0.72
DNASE1L3deoxyribonuclease I-like 3 (205554_s_at), score: -0.86
DOHHdeoxyhypusine hydroxylase/monooxygenase (208141_s_at), score: -0.8
DOK4docking protein 4 (209691_s_at), score: 0.72
ECE1endothelin converting enzyme 1 (201750_s_at), score: 0.72
EPAGearly lymphoid activation protein (217050_at), score: -0.79
ETV7ets variant 7 (221680_s_at), score: -0.84
EXOC2exocyst complex component 2 (219349_s_at), score: 0.7
FBP1fructose-1,6-bisphosphatase 1 (209696_at), score: -0.93
FETUBfetuin B (214417_s_at), score: -0.78
FOXF1forkhead box F1 (205935_at), score: 0.74
GABRR1gamma-aminobutyric acid (GABA) receptor, rho 1 (206525_at), score: -0.79
GBA3glucosidase, beta, acid 3 (cytosolic) (219954_s_at), score: -0.87
GDF9growth differentiation factor 9 (221314_at), score: -0.83
GMPRguanosine monophosphate reductase (204187_at), score: 0.69
GNG4guanine nucleotide binding protein (G protein), gamma 4 (205184_at), score: -0.86
GPR32G protein-coupled receptor 32 (221469_at), score: -0.78
GPX3glutathione peroxidase 3 (plasma) (214091_s_at), score: 0.68
GZMMgranzyme M (lymphocyte met-ase 1) (207460_at), score: -0.88
HAB1B1 for mucin (215778_x_at), score: -0.94
HAMPhepcidin antimicrobial peptide (220491_at), score: -0.85
HAND1heart and neural crest derivatives expressed 1 (220138_at), score: -0.79
HAO2hydroxyacid oxidase 2 (long chain) (220801_s_at), score: -0.84
HHEXhematopoietically expressed homeobox (215933_s_at), score: 0.69
HIST1H4Ghistone cluster 1, H4g (208551_at), score: -0.8
HSF1heat shock transcription factor 1 (202344_at), score: 0.78
IDUAiduronidase, alpha-L- (205059_s_at), score: 0.75
IGHG1immunoglobulin heavy constant gamma 1 (G1m marker) (211693_at), score: -0.83
IL22RA1interleukin 22 receptor, alpha 1 (220056_at), score: -0.8
IL9Rinterleukin 9 receptor (217212_s_at), score: -0.85
INE1inactivation escape 1 (non-protein coding) (207252_at), score: -0.76
ITGALintegrin, alpha L (antigen CD11A (p180), lymphocyte function-associated antigen 1; alpha polypeptide) (213475_s_at), score: -0.78
JUNDjun D proto-oncogene (203751_x_at), score: 0.76
JUPjunction plakoglobin (201015_s_at), score: 0.97
LEPREL2leprecan-like 2 (204854_at), score: 0.84
LGALS14lectin, galactoside-binding, soluble, 14 (220158_at), score: -0.94
LILRA5leukocyte immunoglobulin-like receptor, subfamily A (with TM domain), member 5 (215838_at), score: -0.88
LOC149478hypothetical protein LOC149478 (215462_at), score: -0.87
LRP5low density lipoprotein receptor-related protein 5 (209468_at), score: 0.67
LRRN2leucine rich repeat neuronal 2 (216164_at), score: -0.76
LRRTM4leucine rich repeat transmembrane neuronal 4 (220345_at), score: -0.82
MAP3K11mitogen-activated protein kinase kinase kinase 11 (203652_at), score: 0.7
MAP3K6mitogen-activated protein kinase kinase kinase 6 (219278_at), score: 0.77
MEOX1mesenchyme homeobox 1 (205619_s_at), score: -0.88
MFNGMFNG O-fucosylpeptide 3-beta-N-acetylglucosaminyltransferase (204153_s_at), score: -0.88
MOBPmyelin-associated oligodendrocyte basic protein (210193_at), score: -0.9
MOCS1molybdenum cofactor synthesis 1 (211673_s_at), score: -0.79
MUC5ACmucin 5AC, oligomeric mucus/gel-forming (217182_at), score: -0.85
MYH15myosin, heavy chain 15 (215331_at), score: -0.86
N4BP3Nedd4 binding protein 3 (214775_at), score: -0.8
NINJ1ninjurin 1 (203045_at), score: 0.72
NPY2Rneuropeptide Y receptor Y2 (210730_s_at), score: -0.83
OPRL1opiate receptor-like 1 (206564_at), score: -0.81
PDE8Bphosphodiesterase 8B (213228_at), score: -0.79
PECAM1platelet/endothelial cell adhesion molecule (208982_at), score: -0.82
PGK2phosphoglycerate kinase 2 (217009_at), score: -0.8
PHF7PHD finger protein 7 (215622_x_at), score: -0.85
PIP5K1Cphosphatidylinositol-4-phosphate 5-kinase, type I, gamma (212518_at), score: 0.79
PIPOXpipecolic acid oxidase (221605_s_at), score: -0.8
PNMAL1PNMA-like 1 (218824_at), score: 0.88
POU4F1POU class 4 homeobox 1 (206940_s_at), score: -0.83
PTPN6protein tyrosine phosphatase, non-receptor type 6 (206687_s_at), score: -0.89
RNF40ring finger protein 40 (206845_s_at), score: 0.77
SAV1salvador homolog 1 (Drosophila) (218276_s_at), score: 0.68
SCAMP4secretory carrier membrane protein 4 (213244_at), score: 0.81
SCG2secretogranin II (chromogranin C) (204035_at), score: 0.68
SCN10Asodium channel, voltage-gated, type X, alpha subunit (208578_at), score: -0.76
SIN3BSIN3 homolog B, transcription regulator (yeast) (209352_s_at), score: 0.82
SLC26A10solute carrier family 26, member 10 (214951_at), score: -0.88
SLC9A3R2solute carrier family 9 (sodium/hydrogen exchanger), member 3 regulator 2 (209830_s_at), score: 0.71
SLCO1C1solute carrier organic anion transporter family, member 1C1 (220460_at), score: -0.8
SPAG8sperm associated antigen 8 (206816_s_at), score: -0.77
SPATA1spermatogenesis associated 1 (221057_at), score: -0.78
SSBP3single stranded DNA binding protein 3 (217991_x_at), score: 0.75
TAL1T-cell acute lymphocytic leukemia 1 (206283_s_at), score: -0.79
TGM4transglutaminase 4 (prostate) (217566_s_at), score: -0.87
TMSB4Ythymosin beta 4, Y-linked (206769_at), score: -0.85
TPD52tumor protein D52 (201690_s_at), score: 0.71
TRA@T cell receptor alpha locus (216540_at), score: -0.89
TSC2tuberous sclerosis 2 (215735_s_at), score: 0.68
TSPAN12tetraspanin 12 (219274_at), score: 0.7
TYMPthymidine phosphorylase (217497_at), score: -0.78
VEGFBvascular endothelial growth factor B (203683_s_at), score: 0.79
VPS37Bvacuolar protein sorting 37 homolog B (S. cerevisiae) (221704_s_at), score: 0.71
WSB1WD repeat and SOCS box-containing 1 (201294_s_at), score: -0.76
Non-Entrez genes
205297_s_atUnknown, score: -0.77
206845_s_atUnknown, score: -0.78
HELP
Conditions in the module, given in the same order as on the expression
plot above. Red color means over-expression, green under-expression in
the given condition.
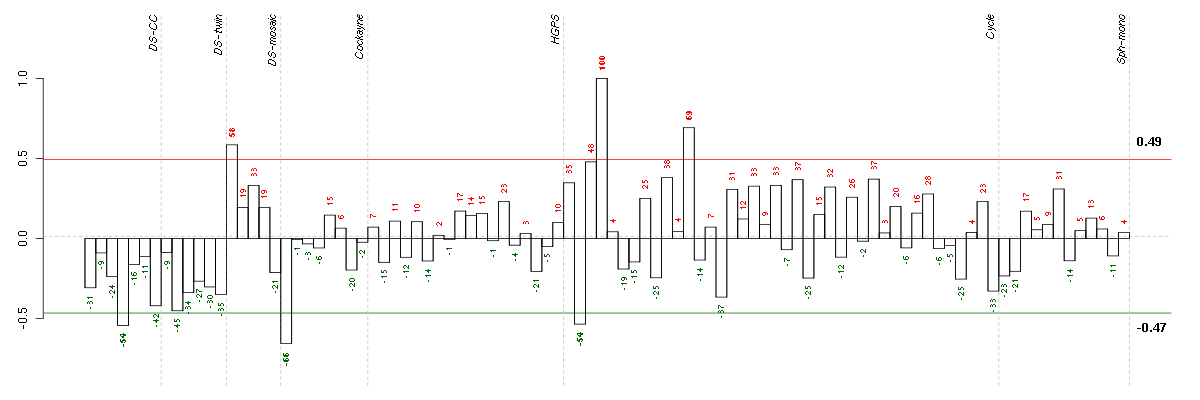
The barplot below shows the condition (sample) scores. A separate bar
is shown for each sample, its height is the corresponding score of the
sample in the module. The red and green numbers on the bars are the
sample scores expressed in percents, i.e. 100% is 1.0.
The red and green lines show the module thresholds, samples above
the red line and below the green line are included in the module.
The different experiments that were part of the study, are separated
by dashed vertical lines.
— Click on the Help button again to close this help window.
| Id | sample | Experiment | ExpName | Array | Syndrome | Cell.line |
| E-GEOD-3407-raw-cel-1437949557.cel | 1 | 4 | Cockayne | hgu133a | CS | eGFP |
| t21a 08-03.CEL | 4 | 1 | DS-CC | hgu133a | Down | DS-CC 4 |
| E-TABM-263-raw-cel-1515485671.cel | 2 | 6 | Cycle | hgu133a2 | none | Cycle 1 |
| 46A.CEL | 1 | 3 | DS-mosaic | hgu133plus2 | none | DS-mosaic 1 |
| E-TABM-263-raw-cel-1515485871.cel | 12 | 6 | Cycle | hgu133a2 | none | Cycle 1 |
| E-TABM-263-raw-cel-1515485711.cel | 4 | 6 | Cycle | hgu133a2 | none | Cycle 1 |


© 2008-2010 Computational Biology Group, Department of Medical Genetics,
University of Lausanne, Switzerland