Previous module |
Next module
Module #978, TG: 2.2, TC: 1.6, 136 probes, 136 Entrez genes, 9 conditions


HELP
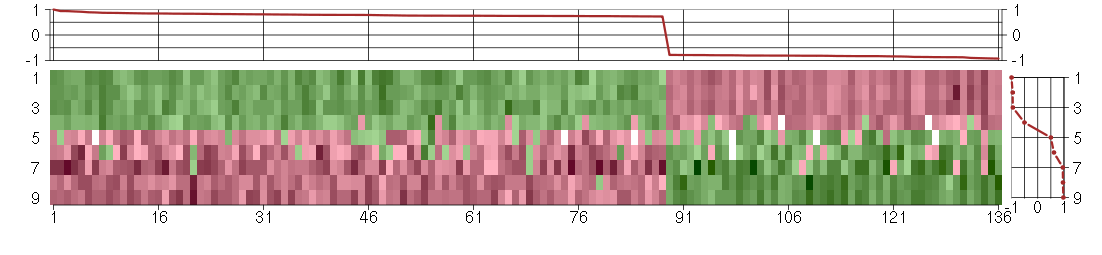
The image plot shows the color-coded level of gene expression, for the
genes and conditions in a given transcription module. The genes are on
the horizontal, the conditions on the vertical axis.
The genes are ordered according to their ISA gene scores, similarly
the conditions are ordered according to their condition scores. The
score of a gene means the «degree of inclusion» in
the module: a high score gene is essential in the module.
Condition scores can also be negative, that means that the genes of
the module are all down-regulated in the condition. Here the absolute
value of the score gives the «degree of inclusion».
The plots above and beside the expression matrix show the gene scores
and condition scores, respectively.
Note that the plot is interactive, you can see the name of the gene
and condition under the mouse cursor.
The expression matrix was normalized to have mean zero and standard
deviation one for every gene separately across all conditions
(i.e. not just for the conditions in the module).
— Click on the Help button again to close this help window.

Under-expression is coded with green,
over-expression with red color.
Help |
Hide |
Top
Help |
Show |
Top
The GO tree — Biological processes
HELP
This is one of three sections showing Gene Ontology enrichment of the
current module: in this case for biological processes.
The graph shows the hierarchy of the GO categories, their enrichment
for the current module is color coded, and the blue number beside the
category is the minus log ten p-value of the enrichment. (Calculated
using the standard hypergeometric test.) The color of the arrows code
«is a» (cyan) and «part of» relationships.
The tree was built the following way. First all GO terms with more
significant enrichment p-value than 0.05 were collected. Then all
paths from these terms to the root node of the GO tree were included
too. If a GO term is included more than once in the tree, then the
green numbers show 1) the id of the node, this makes it easier to find
other appereances of the term, and 2) the number of appearences.
Note that the same GO category might show up on the graph many
times. This is because the GO was «straightened» for this
graph, i.e. if there are more paths from a GO term to the root node of
the tree, all of them are included. The green numbers
Move the mouse cursor over the terms to get their definition. Clicking
on them takes you to the corresponding Gene Ontology web page.
If you cannot see a graph here at all, that means that there were no
significantly enriched GO categories, at the 0.05 level.
— Click on the Help button again to close this help window.
Help |
Hide |
Top
Help |
Show |
Top
The GO tree — Cellular Components
HELP
This is one of three sections showing Gene Ontology enrichment of the
current module: in this case for cellular components.
The graph shows the hierarchy of the GO categories, their enrichment
for the current module is color coded, and the blue number beside the
category is the minus log ten p-value of the enrichment. (Calculated
using the standard hypergeometric test.) The color of the arrows code
«is a» (cyan) and «part of» relationships.
The tree was built the following way. First all GO terms with more
significant enrichment p-value than 0.05 were collected. Then all
paths from these terms to the root node of the GO tree were included
too. If a GO term is included more than once in the tree, then the
green numbers show 1) the id of the node, this makes it easier to find
other appereances of the term, and 2) the number of appearences.
Note that the same GO category might show up on the graph many
times. This is because the GO was «straightened» for this
graph, i.e. if there are more paths from a GO term to the root node of
the tree, all of them are included. The green numbers
Move the mouse cursor over the terms to get their definition. Clicking
on them takes you to the corresponding Gene Ontology web page.
If you cannot see a graph here at all, that means that there were no
significantly enriched GO categories, at the 0.05 level.
— Click on the Help button again to close this help window.
Help |
Hide |
Top
Help |
Show |
Top
The GO tree — Molecular Function
HELP
This is one of three sections showing Gene Ontology enrichment of the
current module: in this case for molecular function.
The graph shows the hierarchy of the GO categories, their enrichment
for the current module is color coded, and the blue number beside the
category is the minus log ten p-value of the enrichment. (Calculated
using the standard hypergeometric test.) The color of the arrows code
«is a» (cyan) and «part of» relationships.
The tree was built the following way. First all GO terms with more
significant enrichment p-value than 0.05 were collected. Then all
paths from these terms to the root node of the GO tree were included
too. If a GO term is included more than once in the tree, then the
green numbers show 1) the id of the node, this makes it easier to find
other appereances of the term, and 2) the number of appearences.
Note that the same GO category might show up on the graph many
times. This is because the GO was «straightened» for this
graph, i.e. if there are more paths from a GO term to the root node of
the tree, all of them are included. The green numbers
Move the mouse cursor over the terms to get their definition. Clicking
on them takes you to the corresponding Gene Ontology web page.
If you cannot see a graph here at all, that means that there were no
significantly enriched GO categories, at the 0.05 level.
— Click on the Help button again to close this help window.
Help |
Hide |
Top
Help |
Show |
Top
GO BP test for over-representation
HELP
List of all enriched GO categories (biological processes), at the 0.05
p-value level.
The columns:
- ExpCount is the expected count of genes in the
module annotated with the given GO term, just by chance.
- Count
is the number of genes in the module annotated with the given GO
term.
- Size is the total number of genes (in our universe)
annotated with the GO term.
Clicking on Count shows the genes that drive the
enrichment. You can also click on the individual numbers in
the Count column, to show the driving genes for that individual
GO category.
Clicking on the GO identifiers takes you to the Gene Ontology web
pages.
— Click on the Help button again to close this help window.
| Id | Pvalue | ExpCount | Count | Size | Term |
| GO:0006826 | 3.634e-02 | 0.1751 | 3
SLC11A1, SLC25A28, SLC25A37 | 12 | iron ion transport |
Help |
Hide |
Top
Help |
Show |
Top
GO CC test for over-representation
HELP
List of all enriched GO categories (cellular components), at the 0.05
p-value level.
The columns:
- ExpCount is the expected count of genes in the
module annotated with the given GO term, just by chance.
- Count
is the number of genes in the module annotated with the given GO
term.
- Size is the total number of genes (in our universe)
annotated with the GO term.
Clicking on Count shows the genes that drive the
enrichment. You can also click on the individual numbers in
the Count column, to show the driving genes for that individual
GO category.
Clicking on the GO identifiers takes you to the Gene Ontology web
pages.
— Click on the Help button again to close this help window.
Help |
Hide |
Top
Help |
Show |
Top
GO MF test for over-representation
HELP
List of all enriched GO categories (molecular function), at the 0.05
p-value level.
The columns:
- ExpCount is the expected count of genes in the
module annotated with the given GO term, just by chance.
- Count
is the number of genes in the module annotated with the given GO
term.
- Size is the total number of genes (in our universe)
annotated with the GO term.
Clicking on Count shows the genes that drive the
enrichment. You can also click on the individual numbers in
the Count column, to show the driving genes for that individual
GO category.
Clicking on the GO identifiers takes you to the Gene Ontology web
pages.
— Click on the Help button again to close this help window.
Help |
Hide |
Top
Help |
Show |
Top
KEGG Pathway test for over-representation
HELP
List of all enriched KEGG pathways, at the 0.05
p-value level.
The columns:
- ExpCount is the expected count of genes in the
module annotated with the given KEGG pathway, just by chance.
- Count
is the number of genes in the module annotated with the given KEGG
pathway.
- Size is the total number of genes (in our universe)
annotated with the KEGG pathway.
Clicking on Count shows the genes that drive the
enrichment. You can also click on the individual numbers in
the Count column, to show the driving genes for that individual
KEGG pathway.
Clicking on the KEGG identifiers takes you to the KEGG web site.
— Click on the Help button again to close this help window.
Help |
Hide |
Top
Help |
Show |
Top
miRNA test for over-representation
HELP
List of all enriched miRNA families, at the 0.05
p-value level.
The columns:
- ExpCount is the expected count of genes in the
module regulated by the given miRNA family, just by chance.
- Count
is the number of genes in the module regulated by the given miRNA
family.
- Size is the total number of genes (in our universe)
regulated with the given miRNA family.
Clicking on Count shows the genes that drive the
enrichment. You can also click on the individual numbers in
the Count column, to show the driving genes for that individual
miRNA family.
The miRNA regulation data was taken from the TargetScan database.
(Only the conserved sites were used for the current analysis.)
Clicking on the miRNA names takes you to the TargetScan web site.
— Click on the Help button again to close this help window.
Help |
Hide |
Top
Help |
Show |
Top
Chromosome test for over-representation
HELP
List of all enriched Chromosomes, at the 0.05
p-value level.
The columns:
- ExpCount is the expected number of genes in the
module on the given chromosome, just by chance.
- Count
is the number of genes in the module on the given chromosome.
- Size is the total number of genes (in our universe)
on the given chromosome.
Clicking on Count shows the genes that drive the
enrichment. You can also click on the individual numbers in
the Count column, to show the driving genes for that individual
chromosome.
— Click on the Help button again to close this help window.
HELP
A list of all genes in the current module, in alphabetical order. The
size of the text corresponds to the gene scores.
Note that some gene symbols may show up more than once, if many
probes match the same Entrez gene.
Genes with no Entrez mapping are given separately, with their
Affymetrics probe ID.
— Click on the Help button again to close this help window.
Entrez genes
ABHD2abhydrolase domain containing 2 (221815_at), score: 0.89
ACSL3acyl-CoA synthetase long-chain family member 3 (201660_at), score: -0.83
ADIPOR1adiponectin receptor 1 (217748_at), score: 0.82
AKAP12A kinase (PRKA) anchor protein 12 (210517_s_at), score: -0.78
ARF5ADP-ribosylation factor 5 (201526_at), score: 0.84
ARHGAP29Rho GTPase activating protein 29 (203910_at), score: -0.79
ATP11AATPase, class VI, type 11A (215842_s_at), score: 0.79
B4GALT5UDP-Gal:betaGlcNAc beta 1,4- galactosyltransferase, polypeptide 5 (221484_at), score: 0.73
C10orf116chromosome 10 open reading frame 116 (203571_s_at), score: -0.87
C14orf169chromosome 14 open reading frame 169 (219526_at), score: -0.8
C15orf29chromosome 15 open reading frame 29 (218791_s_at), score: -0.79
C20orf11chromosome 20 open reading frame 11 (218448_at), score: 0.73
C20orf149chromosome 20 open reading frame 149 (218010_x_at), score: -0.79
C4orf30chromosome 4 open reading frame 30 (219717_at), score: 0.94
C7orf64chromosome 7 open reading frame 64 (221596_s_at), score: 0.8
CABC1chaperone, ABC1 activity of bc1 complex homolog (S. pombe) (218168_s_at), score: 0.79
CAMSAP1L1calmodulin regulated spectrin-associated protein 1-like 1 (212763_at), score: 0.81
CBFA2T2core-binding factor, runt domain, alpha subunit 2; translocated to, 2 (207625_s_at), score: 0.78
CD44CD44 molecule (Indian blood group) (210916_s_at), score: 0.8
CELSR3cadherin, EGF LAG seven-pass G-type receptor 3 (flamingo homolog, Drosophila) (40020_at), score: 0.87
CIRCBF1 interacting corepressor (209571_at), score: 0.75
CLINT1clathrin interactor 1 (201768_s_at), score: 0.86
DAZAP2DAZ associated protein 2 (212595_s_at), score: 0.79
DDAH1dimethylarginine dimethylaminohydrolase 1 (209094_at), score: -0.86
DGCR2DiGeorge syndrome critical region gene 2 (214198_s_at), score: 0.76
DGKDdiacylglycerol kinase, delta 130kDa (208072_s_at), score: 0.79
DHX9DEAH (Asp-Glu-Ala-His) box polypeptide 9 (212105_s_at), score: 0.74
DKK1dickkopf homolog 1 (Xenopus laevis) (204602_at), score: -0.8
DNAJB1DnaJ (Hsp40) homolog, subfamily B, member 1 (200664_s_at), score: 0.83
DNAJC3DnaJ (Hsp40) homolog, subfamily C, member 3 (208499_s_at), score: 0.92
DSTYKdual serine/threonine and tyrosine protein kinase (214663_at), score: 0.8
EIF1eukaryotic translation initiation factor 1 (212130_x_at), score: 0.76
ENOSF1enolase superfamily member 1 (204142_at), score: -0.83
EPB41L1erythrocyte membrane protein band 4.1-like 1 (212339_at), score: 0.87
ERGIC2ERGIC and golgi 2 (218135_at), score: -0.81
FAM174Bfamily with sequence similarity 174, member B (51158_at), score: -0.87
FAM65Bfamily with sequence similarity 65, member B (209829_at), score: -0.81
FBN2fibrillin 2 (203184_at), score: -0.91
FCARFc fragment of IgA, receptor for (211305_x_at), score: 0.73
FLJ12529pre-mRNA cleavage factor I, 59 kDa subunit (217866_at), score: 0.75
FOXL2forkhead box L2 (220102_at), score: 0.79
FXR1fragile X mental retardation, autosomal homolog 1 (201635_s_at), score: 0.74
GABPAGA binding protein transcription factor, alpha subunit 60kDa (210188_at), score: 0.73
GABREgamma-aminobutyric acid (GABA) A receptor, epsilon (204537_s_at), score: 0.74
GDE1glycerophosphodiester phosphodiesterase 1 (202593_s_at), score: 0.84
GFRA1GDNF family receptor alpha 1 (205696_s_at), score: -0.9
GIGYF2GRB10 interacting GYF protein 2 (212260_at), score: 0.86
GIT1G protein-coupled receptor kinase interacting ArfGAP 1 (218030_at), score: 0.79
GNA12guanine nucleotide binding protein (G protein) alpha 12 (221737_at), score: -0.81
GREM1gremlin 1, cysteine knot superfamily, homolog (Xenopus laevis) (218469_at), score: -0.91
HERC2P2hect domain and RLD 2 pseudogene 2 (217317_s_at), score: 0.75
HLA-Bmajor histocompatibility complex, class I, B (211911_x_at), score: 0.85
HLA-Cmajor histocompatibility complex, class I, C (211799_x_at), score: 0.77
HOXA10homeobox A10 (213150_at), score: -0.84
IGF2BP2insulin-like growth factor 2 mRNA binding protein 2 (218847_at), score: -0.87
JAM3junctional adhesion molecule 3 (212813_at), score: -0.92
KCNJ14potassium inwardly-rectifying channel, subfamily J, member 14 (220776_at), score: 0.81
KCTD13potassium channel tetramerisation domain containing 13 (45653_at), score: 0.84
KIF3Bkinesin family member 3B (203943_at), score: 1
KYNUkynureninase (L-kynurenine hydrolase) (217388_s_at), score: 0.78
LOC643313similar to hypothetical protein LOC284701 (211050_x_at), score: 0.76
LOC727977hypothetical LOC727977 (205787_x_at), score: 0.79
LRIG2leucine-rich repeats and immunoglobulin-like domains 2 (205953_at), score: 0.74
LRRC2leucine rich repeat containing 2 (219949_at), score: -0.84
LUMlumican (201744_s_at), score: -0.85
MAFBv-maf musculoaponeurotic fibrosarcoma oncogene homolog B (avian) (218559_s_at), score: 0.94
MAP3K7mitogen-activated protein kinase kinase kinase 7 (211537_x_at), score: 0.75
MMP1matrix metallopeptidase 1 (interstitial collagenase) (204475_at), score: -0.83
MRPL52mitochondrial ribosomal protein L52 (221997_s_at), score: -0.79
MT1Emetallothionein 1E (212859_x_at), score: -0.81
MT1Fmetallothionein 1F (217165_x_at), score: -0.82
MT1Gmetallothionein 1G (204745_x_at), score: -0.86
MT1Hmetallothionein 1H (206461_x_at), score: -0.86
MT1P2metallothionein 1 pseudogene 2 (211456_x_at), score: -0.8
MT2Ametallothionein 2A (212185_x_at), score: -0.82
MTUS1mitochondrial tumor suppressor 1 (212096_s_at), score: 0.83
NBEAneurobeachin (221207_s_at), score: -0.84
NBPF10neuroblastoma breakpoint family, member 10 (214693_x_at), score: 0.82
NONOnon-POU domain containing, octamer-binding (208698_s_at), score: 0.82
NXF1nuclear RNA export factor 1 (208922_s_at), score: 0.75
OXTRoxytocin receptor (206825_at), score: -0.79
PAN2PAN2 poly(A) specific ribonuclease subunit homolog (S. cerevisiae) (203117_s_at), score: 0.8
PCIF1PDX1 C-terminal inhibiting factor 1 (222045_s_at), score: 0.91
PEX5peroxisomal biogenesis factor 5 (203244_at), score: 0.77
PMS2CLPMS2 C-terminal like pseudogene (221206_at), score: 0.76
PPP3CBprotein phosphatase 3 (formerly 2B), catalytic subunit, beta isoform (209817_at), score: -0.8
PRCCpapillary renal cell carcinoma (translocation-associated) (208938_at), score: 0.73
PSAPprosaposin (200866_s_at), score: 0.74
PSMD5proteasome (prosome, macropain) 26S subunit, non-ATPase, 5 (203447_at), score: -0.81
RAB2ARAB2A, member RAS oncogene family (208734_x_at), score: 0.75
RAB5CRAB5C, member RAS oncogene family (201156_s_at), score: 0.83
RNF19Aring finger protein 19A (220483_s_at), score: 0.74
RPL22ribosomal protein L22 (221726_at), score: -0.78
RPL31ribosomal protein L31 (221593_s_at), score: -0.92
RPP14ribonuclease P/MRP 14kDa subunit (204245_s_at), score: 0.73
RSAD1radical S-adenosyl methionine domain containing 1 (218307_at), score: 0.76
S100A11S100 calcium binding protein A11 (200660_at), score: -0.81
SAPS2SAPS domain family, member 2 (202792_s_at), score: 0.76
SCAND2SCAN domain containing 2 pseudogene (222177_s_at), score: 0.84
SEH1LSEH1-like (S. cerevisiae) (221931_s_at), score: -0.79
SH2D3ASH2 domain containing 3A (222169_x_at), score: 0.79
SLC11A1solute carrier family 11 (proton-coupled divalent metal ion transporters), member 1 (217473_x_at), score: 0.75
SLC23A2solute carrier family 23 (nucleobase transporters), member 2 (209236_at), score: 0.87
SLC25A28solute carrier family 25, member 28 (221432_s_at), score: 0.81
SLC25A36solute carrier family 25, member 36 (201918_at), score: 0.82
SLC25A37solute carrier family 25, member 37 (218136_s_at), score: 0.84
SMA5glucuronidase, beta pseudogene (215043_s_at), score: 0.79
SMG1SMG1 homolog, phosphatidylinositol 3-kinase-related kinase (C. elegans) (210057_at), score: 0.83
SPHARS-phase response (cyclin-related) (206272_at), score: -0.81
SSR3signal sequence receptor, gamma (translocon-associated protein gamma) (217790_s_at), score: -0.87
STAU2staufen, RNA binding protein, homolog 2 (Drosophila) (204226_at), score: -0.81
STK4serine/threonine kinase 4 (211085_s_at), score: 0.79
STX16syntaxin 16 (221499_s_at), score: 0.75
SYPL1synaptophysin-like 1 (201259_s_at), score: 0.81
TAF9BTAF9B RNA polymerase II, TATA box binding protein (TBP)-associated factor, 31kDa (221618_s_at), score: 0.82
TEStestis derived transcript (3 LIM domains) (202720_at), score: -0.81
TMEM168transmembrane protein 168 (218962_s_at), score: -0.81
TMEM2transmembrane protein 2 (218113_at), score: -0.87
TSPYL5TSPY-like 5 (213122_at), score: -0.83
UBAP2Lubiquitin associated protein 2-like (201378_s_at), score: 0.76
UGDHUDP-glucose dehydrogenase (203343_at), score: -0.83
ULK1unc-51-like kinase 1 (C. elegans) (209333_at), score: 0.85
USF2upstream transcription factor 2, c-fos interacting (214879_x_at), score: 0.75
VAMP2vesicle-associated membrane protein 2 (synaptobrevin 2) (201557_at), score: 0.75
VCPIP1valosin containing protein (p97)/p47 complex interacting protein 1 (219810_at), score: 0.75
VGLL3vestigial like 3 (Drosophila) (220327_at), score: -0.81
WACWW domain containing adaptor with coiled-coil (219679_s_at), score: 0.88
WASF1WAS protein family, member 1 (204165_at), score: -0.82
WASLWiskott-Aldrich syndrome-like (205809_s_at), score: 0.75
WBSCR22Williams Beuren syndrome chromosome region 22 (207628_s_at), score: 0.76
WT1Wilms tumor 1 (206067_s_at), score: 0.74
ZFRzinc finger RNA binding protein (33148_at), score: 0.76
ZNF117zinc finger protein 117 (207605_x_at), score: 0.74
ZNF192zinc finger protein 192 (206579_at), score: 0.76
ZNF212zinc finger protein 212 (203985_at), score: 0.75
ZNF273zinc finger protein 273 (215239_x_at), score: 0.74
Non-Entrez genes
Unknown, score:
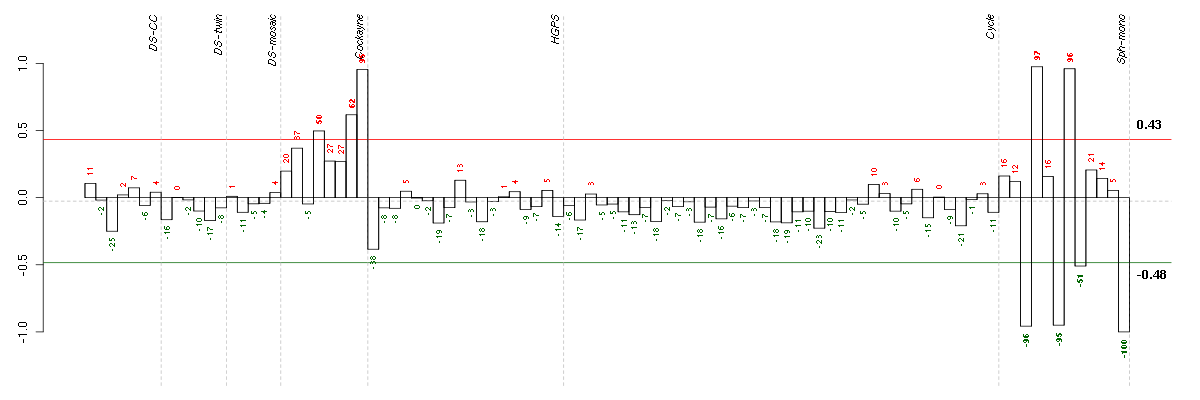
HELP
Conditions in the module, given in the same order as on the expression
plot above. Red color means over-expression, green under-expression in
the given condition.
The barplot below shows the condition (sample) scores. A separate bar
is shown for each sample, its height is the corresponding score of the
sample in the module. The red and green numbers on the bars are the
sample scores expressed in percents, i.e. 100% is 1.0.
The red and green lines show the module thresholds, samples above
the red line and below the green line are included in the module.
The different experiments that were part of the study, are separated
by dashed vertical lines.
— Click on the Help button again to close this help window.
| Id | sample | Experiment | ExpName | Array | Syndrome | Cell.line |
| E-GEOD-4219-raw-cel-1311956824.cel | 24 | 7 | Sph-mono | hgu133plus2 | none | Sph-mon 1 |
| E-GEOD-4219-raw-cel-1311956178.cel | 6 | 7 | Sph-mono | hgu133plus2 | none | Sph-mon 1 |
| E-GEOD-4219-raw-cel-1311956358.cel | 10 | 7 | Sph-mono | hgu133plus2 | none | Sph-mon 1 |
| E-GEOD-4219-raw-cel-1311956418.cel | 13 | 7 | Sph-mono | hgu133plus2 | none | Sph-mon 1 |
| E-GEOD-3407-raw-cel-1437949704.cel | 4 | 4 | Cockayne | hgu133a | CS | eGFP |
| E-GEOD-3407-raw-cel-1437949854.cel | 7 | 4 | Cockayne | hgu133a | CS | eGFP |
| E-GEOD-3407-raw-cel-1437949938.cel | 8 | 4 | Cockayne | hgu133a | none | CSB |
| E-GEOD-4219-raw-cel-1311956398.cel | 12 | 7 | Sph-mono | hgu133plus2 | none | Sph-mon 1 |
| E-GEOD-4219-raw-cel-1311956275.cel | 8 | 7 | Sph-mono | hgu133plus2 | none | Sph-mon 1 |


© 2008-2010 Computational Biology Group, Department of Medical Genetics,
University of Lausanne, Switzerland