
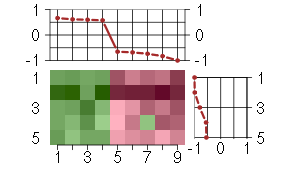

Under-expression is coded with green,
over-expression with red color.

ALDH1L1aldehyde dehydrogenase 1 family, member L1 (215798_at), score: 0.58 CYP3A43cytochrome P450, family 3, subfamily A, polypeptide 43 (211440_x_at), score: 0.66 FCER1GFc fragment of IgE, high affinity I, receptor for; gamma polypeptide (204232_at), score: 0.6 KIAA1305KIAA1305 (220911_s_at), score: -0.65 NAG18NAG18 mRNA (210496_at), score: 0.61 NDRG4NDRG family member 4 (209159_s_at), score: -1 SUOXsulfite oxidase (204067_at), score: -0.74 TMSB15Athymosin beta 15a (205347_s_at), score: -0.68 UCP2uncoupling protein 2 (mitochondrial, proton carrier) (208998_at), score: -0.83
| Id | sample | Experiment | ExpName | Array | Syndrome | Cell.line |
|---|---|---|---|---|---|---|
| E-TABM-263-raw-cel-1515485831.cel | 10 | 6 | Cycle | hgu133a2 | none | Cycle 1 |
| F055_WBS.CEL | 14 | 8 | WBS | hgu133plus2 | WBS | WBS 1 |
| E-TABM-263-raw-cel-1515486051.cel | 21 | 6 | Cycle | hgu133a2 | none | Cycle 1 |
| E-GEOD-3860-raw-cel-1561690215.cel | 2 | 5 | HGPS | hgu133a | HGPS | AG11513 |
| E-TABM-263-raw-cel-1515486211.cel | 29 | 6 | Cycle | hgu133a2 | none | Cycle 1 |

![]()

