
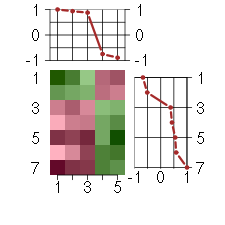

Under-expression is coded with green,
over-expression with red color.

HIST1H4Hhistone cluster 1, H4h (208180_s_at), score: -0.75 LRP2low density lipoprotein-related protein 2 (205710_at), score: -0.89 MTHFSDmethenyltetrahydrofolate synthetase domain containing (218879_s_at), score: 1 PTCD1pentatricopeptide repeat domain 1 (218956_s_at), score: 0.93 UCP2uncoupling protein 2 (mitochondrial, proton carrier) (208998_at), score: 0.88
| Id | sample | Experiment | ExpName | Array | Syndrome | Cell.line |
|---|---|---|---|---|---|---|
| E-TABM-263-raw-cel-1515485971.cel | 17 | 6 | Cycle | hgu133a2 | none | Cycle 1 |
| 47B.CEL | 4 | 3 | DS-mosaic | hgu133plus2 | Down mosaic | DS-mosaic 4 |
| E-GEOD-4219-raw-cel-1311956614.cel | 18 | 7 | Sph-mono | hgu133plus2 | none | Sph-mon 1 |
| 46B.CEL | 2 | 3 | DS-mosaic | hgu133plus2 | none | DS-mosaic 2 |
| F348_WBS.CEL | 16 | 8 | WBS | hgu133plus2 | WBS | WBS 1 |
| E-TABM-263-raw-cel-1515486391.cel | 38 | 6 | Cycle | hgu133a2 | none | Cycle 1 |
| E-TABM-263-raw-cel-1515486191.cel | 28 | 6 | Cycle | hgu133a2 | none | Cycle 1 |
![]()

