Previous module |
Next module
Module #417, TG: 3.2, TC: 1.8, 101 probes, 101 Entrez genes, 10 conditions


HELP
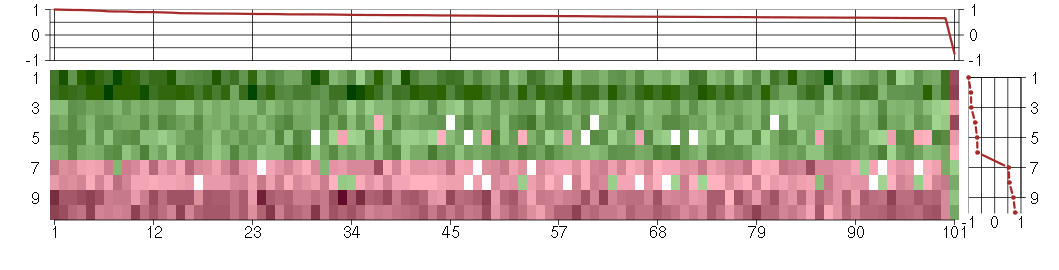
The image plot shows the color-coded level of gene expression, for the
genes and conditions in a given transcription module. The genes are on
the horizontal, the conditions on the vertical axis.
The genes are ordered according to their ISA gene scores, similarly
the conditions are ordered according to their condition scores. The
score of a gene means the «degree of inclusion» in
the module: a high score gene is essential in the module.
Condition scores can also be negative, that means that the genes of
the module are all down-regulated in the condition. Here the absolute
value of the score gives the «degree of inclusion».
The plots above and beside the expression matrix show the gene scores
and condition scores, respectively.
Note that the plot is interactive, you can see the name of the gene
and condition under the mouse cursor.
The expression matrix was normalized to have mean zero and standard
deviation one for every gene separately across all conditions
(i.e. not just for the conditions in the module).
— Click on the Help button again to close this help window.

Under-expression is coded with green,
over-expression with red color.
Help |
Hide |
Top
Help |
Show |
Top
The GO tree — Biological processes
HELP
This is one of three sections showing Gene Ontology enrichment of the
current module: in this case for biological processes.
The graph shows the hierarchy of the GO categories, their enrichment
for the current module is color coded, and the blue number beside the
category is the minus log ten p-value of the enrichment. (Calculated
using the standard hypergeometric test.) The color of the arrows code
«is a» (cyan) and «part of» relationships.
The tree was built the following way. First all GO terms with more
significant enrichment p-value than 0.05 were collected. Then all
paths from these terms to the root node of the GO tree were included
too. If a GO term is included more than once in the tree, then the
green numbers show 1) the id of the node, this makes it easier to find
other appereances of the term, and 2) the number of appearences.
Note that the same GO category might show up on the graph many
times. This is because the GO was «straightened» for this
graph, i.e. if there are more paths from a GO term to the root node of
the tree, all of them are included. The green numbers
Move the mouse cursor over the terms to get their definition. Clicking
on them takes you to the corresponding Gene Ontology web page.
If you cannot see a graph here at all, that means that there were no
significantly enriched GO categories, at the 0.05 level.
— Click on the Help button again to close this help window.

biological_process
Any process specifically pertinent to the functioning of integrated living units: cells, tissues, organs, and organisms. A process is a collection of molecular events with a defined beginning and end.
cellular process
Any process that is carried out at the cellular level, but not necessarily restricted to a single cell. For example, cell communication occurs among more than one cell, but occurs at the cellular level.
cellular component organization
A process that is carried out at the cellular level which results in the formation, arrangement of constituent parts, or disassembly of a cellular component.
membrane organization
A process that is carried out at the cellular level which results in the formation, arrangement of constituent parts, or disassembly of a membrane. A membrane is a double layer of lipid molecules that encloses all cells, and, in eukaryotes, many organelles; may be a single or double lipid bilayer; also includes associated proteins.
all
This term is the most general term possible
Help |
Hide |
Top
Help |
Show |
Top
The GO tree — Cellular Components
HELP
This is one of three sections showing Gene Ontology enrichment of the
current module: in this case for cellular components.
The graph shows the hierarchy of the GO categories, their enrichment
for the current module is color coded, and the blue number beside the
category is the minus log ten p-value of the enrichment. (Calculated
using the standard hypergeometric test.) The color of the arrows code
«is a» (cyan) and «part of» relationships.
The tree was built the following way. First all GO terms with more
significant enrichment p-value than 0.05 were collected. Then all
paths from these terms to the root node of the GO tree were included
too. If a GO term is included more than once in the tree, then the
green numbers show 1) the id of the node, this makes it easier to find
other appereances of the term, and 2) the number of appearences.
Note that the same GO category might show up on the graph many
times. This is because the GO was «straightened» for this
graph, i.e. if there are more paths from a GO term to the root node of
the tree, all of them are included. The green numbers
Move the mouse cursor over the terms to get their definition. Clicking
on them takes you to the corresponding Gene Ontology web page.
If you cannot see a graph here at all, that means that there were no
significantly enriched GO categories, at the 0.05 level.
— Click on the Help button again to close this help window.
intracellular
The living contents of a cell; the matter contained within (but not including) the plasma membrane, usually taken to exclude large vacuoles and masses of secretory or ingested material. In eukaryotes it includes the nucleus and cytoplasm.
cellular_component
The part of a cell or its extracellular environment in which a gene product is located. A gene product may be located in one or more parts of a cell and its location may be as specific as a particular macromolecular complex, that is, a stable, persistent association of macromolecules that function together.
cell
The basic structural and functional unit of all organisms. Includes the plasma membrane and any external encapsulating structures such as the cell wall and cell envelope.
cytoplasm
All of the contents of a cell excluding the plasma membrane and nucleus, but including other subcellular structures.
cytoplasmic vesicle
A vesicle formed of membrane or protein, found in the cytoplasm of a cell.
vesicle
Any small, fluid-filled, spherical organelle enclosed by membrane or protein.
organelle
Organized structure of distinctive morphology and function. Includes the nucleus, mitochondria, plastids, vacuoles, vesicles, ribosomes and the cytoskeleton. Excludes the plasma membrane.
intracellular organelle
Organized structure of distinctive morphology and function, occurring within the cell. Includes the nucleus, mitochondria, plastids, vacuoles, vesicles, ribosomes and the cytoskeleton. Excludes the plasma membrane.
intracellular part
Any constituent part of the living contents of a cell; the matter contained within (but not including) the plasma membrane, usually taken to exclude large vacuoles and masses of secretory or ingested material. In eukaryotes it includes the nucleus and cytoplasm.
cytoplasmic part
Any constituent part of the cytoplasm, all of the contents of a cell excluding the plasma membrane and nucleus, but including other subcellular structures.
cell part
Any constituent part of a cell, the basic structural and functional unit of all organisms.
all
This term is the most general term possible
cell part
Any constituent part of a cell, the basic structural and functional unit of all organisms.
cytoplasmic vesicle
A vesicle formed of membrane or protein, found in the cytoplasm of a cell.
intracellular part
Any constituent part of the living contents of a cell; the matter contained within (but not including) the plasma membrane, usually taken to exclude large vacuoles and masses of secretory or ingested material. In eukaryotes it includes the nucleus and cytoplasm.
intracellular organelle
Organized structure of distinctive morphology and function, occurring within the cell. Includes the nucleus, mitochondria, plastids, vacuoles, vesicles, ribosomes and the cytoskeleton. Excludes the plasma membrane.
cytoplasmic part
Any constituent part of the cytoplasm, all of the contents of a cell excluding the plasma membrane and nucleus, but including other subcellular structures.
cytoplasmic vesicle
A vesicle formed of membrane or protein, found in the cytoplasm of a cell.
Help |
Hide |
Top
Help |
Show |
Top
The GO tree — Molecular Function
HELP
This is one of three sections showing Gene Ontology enrichment of the
current module: in this case for molecular function.
The graph shows the hierarchy of the GO categories, their enrichment
for the current module is color coded, and the blue number beside the
category is the minus log ten p-value of the enrichment. (Calculated
using the standard hypergeometric test.) The color of the arrows code
«is a» (cyan) and «part of» relationships.
The tree was built the following way. First all GO terms with more
significant enrichment p-value than 0.05 were collected. Then all
paths from these terms to the root node of the GO tree were included
too. If a GO term is included more than once in the tree, then the
green numbers show 1) the id of the node, this makes it easier to find
other appereances of the term, and 2) the number of appearences.
Note that the same GO category might show up on the graph many
times. This is because the GO was «straightened» for this
graph, i.e. if there are more paths from a GO term to the root node of
the tree, all of them are included. The green numbers
Move the mouse cursor over the terms to get their definition. Clicking
on them takes you to the corresponding Gene Ontology web page.
If you cannot see a graph here at all, that means that there were no
significantly enriched GO categories, at the 0.05 level.
— Click on the Help button again to close this help window.
Help |
Hide |
Top
Help |
Show |
Top
GO BP test for over-representation
HELP
List of all enriched GO categories (biological processes), at the 0.05
p-value level.
The columns:
- ExpCount is the expected count of genes in the
module annotated with the given GO term, just by chance.
- Count
is the number of genes in the module annotated with the given GO
term.
- Size is the total number of genes (in our universe)
annotated with the GO term.
Clicking on Count shows the genes that drive the
enrichment. You can also click on the individual numbers in
the Count column, to show the driving genes for that individual
GO category.
Clicking on the GO identifiers takes you to the Gene Ontology web
pages.
— Click on the Help button again to close this help window.
| Id | Pvalue | ExpCount | Count | Size | Term |
| GO:0016044 | 7.205e-03 | 2.706 | 11
ARF1, BCL2L1, CLINT1, COPA, HSPA4, MFN2, PICALM, RAB5A, SNAP23, TGFBR2, VAMP3 | 235 | membrane organization |
| GO:0051640 | 1.200e-02 | 0.5066 | 5
ARF1, COPA, MFN2, PAFAH1B1, SNAP23 | 44 | organelle localization |
| GO:0006901 | 2.630e-02 | 0.1497 | 3
ARF1, COPA, PICALM | 13 | vesicle coating |
| GO:0006900 | 3.097e-02 | 0.1612 | 3
ARF1, COPA, PICALM | 14 | membrane budding |
| GO:0016192 | 4.154e-02 | 4.122 | 12
ARF1, BET1L, CLINT1, COPA, LMAN1, PICALM, RAB5A, SCAMP1, SNAP23, TGFBR2, TMED2, VAMP3 | 358 | vesicle-mediated transport |
| GO:0051656 | 4.380e-02 | 0.426 | 4
ARF1, COPA, PAFAH1B1, SNAP23 | 37 | establishment of organelle localization |
| GO:0006903 | 4.630e-02 | 0.1957 | 3
ARF1, COPA, SNAP23 | 17 | vesicle targeting |
Help |
Hide |
Top
Help |
Show |
Top
GO CC test for over-representation
HELP
List of all enriched GO categories (cellular components), at the 0.05
p-value level.
The columns:
- ExpCount is the expected count of genes in the
module annotated with the given GO term, just by chance.
- Count
is the number of genes in the module annotated with the given GO
term.
- Size is the total number of genes (in our universe)
annotated with the GO term.
Clicking on Count shows the genes that drive the
enrichment. You can also click on the individual numbers in
the Count column, to show the driving genes for that individual
GO category.
Clicking on the GO identifiers takes you to the Gene Ontology web
pages.
— Click on the Help button again to close this help window.
| Id | Pvalue | ExpCount | Count | Size | Term |
| GO:0031410 | 3.609e-03 | 3.83 | 13
BGN, CALU, CANX, CLIC4, CLINT1, COPA, FN1, GNA13, PICALM, RAB5A, SPAG9, TMED2, YWHAZ | 323 | cytoplasmic vesicle |
| GO:0031982 | 4.479e-03 | 3.925 | 13
BGN, CALU, CANX, CLIC4, CLINT1, COPA, FN1, GNA13, PICALM, RAB5A, SPAG9, TMED2, YWHAZ | 331 | vesicle |
| GO:0016020 | 1.236e-02 | 37.55 | 54
ADAM15, ARF1, ASPH, ATP13A3, ATP6V1A, BCL2L1, BET1L, C19orf6, CACNA2D1, CANX, CAPRIN1, CD44, CLIC4, CLINT1, COL1A1, COPA, CPD, DDX3X, ERLIN1, GDI2, GNA13, GPR137, IL6ST, KCTD20, KPNA4, LMAN1, LOXL2, MADD, MFN2, MTMR1, NOTCH2, PAFAH1B1, PCDHGA11, PCDHGA3, PICALM, PTPRA, PXN, RAB5A, RASA3, SCAMP1, SCARB2, SDHC, SHC1, SLC12A4, SNAP23, SPAG9, SPPL2B, SRPR, TGFBR2, TM9SF4, TMED2, UBXN4, UTRN, VAMP3 | 3167 | membrane |
| GO:0042470 | 4.703e-02 | 0.913 | 5
CALU, CANX, GNA13, RAB5A, YWHAZ | 77 | melanosome |
| GO:0048770 | 4.703e-02 | 0.913 | 5
CALU, CANX, GNA13, RAB5A, YWHAZ | 77 | pigment granule |
Help |
Hide |
Top
Help |
Show |
Top
GO MF test for over-representation
HELP
List of all enriched GO categories (molecular function), at the 0.05
p-value level.
The columns:
- ExpCount is the expected count of genes in the
module annotated with the given GO term, just by chance.
- Count
is the number of genes in the module annotated with the given GO
term.
- Size is the total number of genes (in our universe)
annotated with the GO term.
Clicking on Count shows the genes that drive the
enrichment. You can also click on the individual numbers in
the Count column, to show the driving genes for that individual
GO category.
Clicking on the GO identifiers takes you to the Gene Ontology web
pages.
— Click on the Help button again to close this help window.
Help |
Hide |
Top
Help |
Show |
Top
KEGG Pathway test for over-representation
HELP
List of all enriched KEGG pathways, at the 0.05
p-value level.
The columns:
- ExpCount is the expected count of genes in the
module annotated with the given KEGG pathway, just by chance.
- Count
is the number of genes in the module annotated with the given KEGG
pathway.
- Size is the total number of genes (in our universe)
annotated with the KEGG pathway.
Clicking on Count shows the genes that drive the
enrichment. You can also click on the individual numbers in
the Count column, to show the driving genes for that individual
KEGG pathway.
Clicking on the KEGG identifiers takes you to the KEGG web site.
— Click on the Help button again to close this help window.
Help |
Hide |
Top
Help |
Show |
Top
miRNA test for over-representation
HELP
List of all enriched miRNA families, at the 0.05
p-value level.
The columns:
- ExpCount is the expected count of genes in the
module regulated by the given miRNA family, just by chance.
- Count
is the number of genes in the module regulated by the given miRNA
family.
- Size is the total number of genes (in our universe)
regulated with the given miRNA family.
Clicking on Count shows the genes that drive the
enrichment. You can also click on the individual numbers in
the Count column, to show the driving genes for that individual
miRNA family.
The miRNA regulation data was taken from the TargetScan database.
(Only the conserved sites were used for the current analysis.)
Clicking on the miRNA names takes you to the TargetScan web site.
— Click on the Help button again to close this help window.
| Id | Pvalue | ExpCount | Count | Size |
| miR-320/320abcd | 2.382e-02 | 5.788 | 19
ARF1, ATP13A3, ATP6V1A, CAPRIN1, CPD, GNS, HNRNPC, HSPA4, MAT2A, MAX, NONO, PHTF2, PRKAR1A, SDHC, SS18, TGFBR2, UBE2D3, WDR1, YWHAZ | 377 |
Help |
Hide |
Top
Help |
Show |
Top
Chromosome test for over-representation
HELP
List of all enriched Chromosomes, at the 0.05
p-value level.
The columns:
- ExpCount is the expected number of genes in the
module on the given chromosome, just by chance.
- Count
is the number of genes in the module on the given chromosome.
- Size is the total number of genes (in our universe)
on the given chromosome.
Clicking on Count shows the genes that drive the
enrichment. You can also click on the individual numbers in
the Count column, to show the driving genes for that individual
chromosome.
— Click on the Help button again to close this help window.
HELP
A list of all genes in the current module, in alphabetical order. The
size of the text corresponds to the gene scores.
Note that some gene symbols may show up more than once, if many
probes match the same Entrez gene.
Genes with no Entrez mapping are given separately, with their
Affymetrics probe ID.
— Click on the Help button again to close this help window.
Entrez genes
ADAM15ADAM metallopeptidase domain 15 (217007_s_at), score: 0.66
ARF1ADP-ribosylation factor 1 (208750_s_at), score: 0.72
ARHGDIARho GDP dissociation inhibitor (GDI) alpha (213606_s_at), score: 0.75
ASPHaspartate beta-hydroxylase (205808_at), score: 0.71
ATP13A3ATPase type 13A3 (219558_at), score: 0.83
ATP6V1AATPase, H+ transporting, lysosomal 70kDa, V1 subunit A (201971_s_at), score: 0.86
BCL2L1BCL2-like 1 (215037_s_at), score: 0.75
BET1Lblocked early in transport 1 homolog (S. cerevisiae)-like (220470_at), score: 0.66
BGNbiglycan (201262_s_at), score: 0.74
C19orf6chromosome 19 open reading frame 6 (213986_s_at), score: 0.92
CACNA2D1calcium channel, voltage-dependent, alpha 2/delta subunit 1 (207050_at), score: 0.77
CALUcalumenin (214845_s_at), score: 0.67
CANXcalnexin (208853_s_at), score: 0.8
CAPRIN1cell cycle associated protein 1 (200722_s_at), score: 0.7
CD44CD44 molecule (Indian blood group) (210916_s_at), score: 0.85
CDV3CDV3 homolog (mouse) (213548_s_at), score: 0.93
CLIC4chloride intracellular channel 4 (201559_s_at), score: 0.71
CLINT1clathrin interactor 1 (201768_s_at), score: 0.66
COL1A1collagen, type I, alpha 1 (217430_x_at), score: 0.67
COL6A1collagen, type VI, alpha 1 (212940_at), score: 0.8
COPAcoatomer protein complex, subunit alpha (214336_s_at), score: 0.99
CPDcarboxypeptidase D (201942_s_at), score: 0.84
DAPK3death-associated protein kinase 3 (203890_s_at), score: 0.81
DDX3XDEAD (Asp-Glu-Ala-Asp) box polypeptide 3, X-linked (201211_s_at), score: 0.97
DHX9DEAH (Asp-Glu-Ala-His) box polypeptide 9 (212105_s_at), score: 1
ELK1ELK1, member of ETS oncogene family (210376_x_at), score: 0.68
EPRSglutamyl-prolyl-tRNA synthetase (200841_s_at), score: 0.69
ERLIN1ER lipid raft associated 1 (202444_s_at), score: 0.78
FKBP15FK506 binding protein 15, 133kDa (76897_s_at), score: 0.68
FN1fibronectin 1 (214701_s_at), score: 0.92
GDI2GDP dissociation inhibitor 2 (200008_s_at), score: 0.71
GLULglutamate-ammonia ligase (glutamine synthetase) (200648_s_at), score: 0.72
GNA13guanine nucleotide binding protein (G protein), alpha 13 (206917_at), score: 0.67
GNSglucosamine (N-acetyl)-6-sulfatase (203676_at), score: 0.82
GPR137G protein-coupled receptor 137 (43934_at), score: 0.82
GTF2Igeneral transcription factor II, i (210892_s_at), score: 0.9
HMGA1high mobility group AT-hook 1 (210457_x_at), score: 0.68
HNRNPCheterogeneous nuclear ribonucleoprotein C (C1/C2) (200751_s_at), score: 0.7
HP1BP3heterochromatin protein 1, binding protein 3 (220633_s_at), score: 0.84
HSPA4heat shock 70kDa protein 4 (211016_x_at), score: 0.78
IL6STinterleukin 6 signal transducer (gp130, oncostatin M receptor) (204864_s_at), score: 0.78
KCTD20potassium channel tetramerisation domain containing 20 (214849_at), score: 0.69
KPNA4karyopherin alpha 4 (importin alpha 3) (209653_at), score: 0.7
LMAN1lectin, mannose-binding, 1 (203294_s_at), score: 0.74
LOC285412similar to KIAA0737 protein (217448_s_at), score: 0.76
LOC730092RRN3 RNA polymerase I transcription factor homolog (S. cerevisiae) pseudogene (216908_x_at), score: 0.78
LOXL2lysyl oxidase-like 2 (202997_s_at), score: 0.7
LSSlanosterol synthase (2,3-oxidosqualene-lanosterol cyclase) (211019_s_at), score: 0.71
MADDMAP-kinase activating death domain (38398_at), score: -0.73
MAP3K7mitogen-activated protein kinase kinase kinase 7 (211537_x_at), score: 0.66
MAPKAPK2mitogen-activated protein kinase-activated protein kinase 2 (201461_s_at), score: 0.75
MAT2Amethionine adenosyltransferase II, alpha (200769_s_at), score: 0.81
MAXMYC associated factor X (210734_x_at), score: 0.84
MAZMYC-associated zinc finger protein (purine-binding transcription factor) (207824_s_at), score: 0.73
MFN2mitofusin 2 (216205_s_at), score: 0.85
MTMR1myotubularin related protein 1 (214975_s_at), score: 0.69
NONOnon-POU domain containing, octamer-binding (208698_s_at), score: 0.72
NOTCH2Notch homolog 2 (Drosophila) (210756_s_at), score: 0.79
NUMA1nuclear mitotic apparatus protein 1 (214251_s_at), score: 0.78
PAFAH1B1platelet-activating factor acetylhydrolase, isoform Ib, alpha subunit 45kDa (211547_s_at), score: 0.84
PCDHGA11protocadherin gamma subfamily A, 11 (211876_x_at), score: 0.95
PCDHGA3protocadherin gamma subfamily A, 3 (216352_x_at), score: 0.98
PHTF2putative homeodomain transcription factor 2 (217097_s_at), score: 0.81
PICALMphosphatidylinositol binding clathrin assembly protein (215236_s_at), score: 0.77
POLDIP3polymerase (DNA-directed), delta interacting protein 3 (215357_s_at), score: 0.78
PRKAR1Aprotein kinase, cAMP-dependent, regulatory, type I, alpha (tissue specific extinguisher 1) (200604_s_at), score: 0.7
PRPF6PRP6 pre-mRNA processing factor 6 homolog (S. cerevisiae) (208879_x_at), score: 0.68
PRRX1paired related homeobox 1 (205991_s_at), score: 0.75
PTBP1polypyrimidine tract binding protein 1 (212016_s_at), score: 0.98
PTPRAprotein tyrosine phosphatase, receptor type, A (213799_s_at), score: 0.69
PXNpaxillin (211823_s_at), score: 0.82
RAB5ARAB5A, member RAS oncogene family (206113_s_at), score: 0.89
RASA3RAS p21 protein activator 3 (206220_s_at), score: 0.72
RRN3RRN3 RNA polymerase I transcription factor homolog (S. cerevisiae) (216902_s_at), score: 0.69
RXRBretinoid X receptor, beta (215099_s_at), score: 0.83
SCAMP1secretory carrier membrane protein 1 (206667_s_at), score: 0.79
SCARB2scavenger receptor class B, member 2 (201647_s_at), score: 0.76
SDHCsuccinate dehydrogenase complex, subunit C, integral membrane protein, 15kDa (216591_s_at), score: 0.72
SEPT11septin 11 (201308_s_at), score: 0.74
SFRS1splicing factor, arginine/serine-rich 1 (201742_x_at), score: 0.73
SHC1SHC (Src homology 2 domain containing) transforming protein 1 (201469_s_at), score: 0.67
SLC12A4solute carrier family 12 (potassium/chloride transporters), member 4 (209401_s_at), score: 0.7
SMEK1SMEK homolog 1, suppressor of mek1 (Dictyostelium) (220368_s_at), score: 0.8
SNAP23synaptosomal-associated protein, 23kDa (214544_s_at), score: 0.77
SPAG9sperm associated antigen 9 (206748_s_at), score: 0.68
SPPL2Bsignal peptide peptidase-like 2B (215833_s_at), score: 0.73
SRPRsignal recognition particle receptor (docking protein) (200917_s_at), score: 0.81
SS18synovial sarcoma translocation, chromosome 18 (216684_s_at), score: 0.76
STIP1stress-induced-phosphoprotein 1 (212009_s_at), score: 0.9
TGFBR2transforming growth factor, beta receptor II (70/80kDa) (207334_s_at), score: 0.9
TM9SF4transmembrane 9 superfamily protein member 4 (212194_s_at), score: 0.68
TMED2transmembrane emp24 domain trafficking protein 2 (204426_at), score: 0.75
TMOD3tropomodulin 3 (ubiquitous) (220800_s_at), score: 0.7
UBE2D3ubiquitin-conjugating enzyme E2D 3 (UBC4/5 homolog, yeast) (200669_s_at), score: 0.74
UBXN4UBX domain protein 4 (212008_at), score: 0.72
UTRNutrophin (213022_s_at), score: 0.75
VAMP3vesicle-associated membrane protein 3 (cellubrevin) (201337_s_at), score: 0.76
WACWW domain containing adaptor with coiled-coil (219679_s_at), score: 0.88
WDR1WD repeat domain 1 (210935_s_at), score: 0.78
YWHAZtyrosine 3-monooxygenase/tryptophan 5-monooxygenase activation protein, zeta polypeptide (200641_s_at), score: 0.75
ZFAND5zinc finger, AN1-type domain 5 (217741_s_at), score: 0.68
Non-Entrez genes
Unknown, score:
HELP
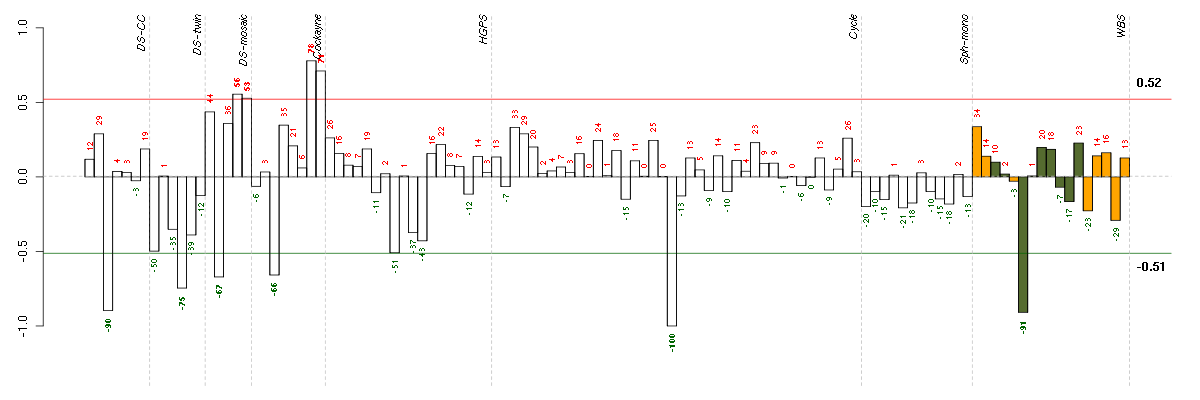
Conditions in the module, given in the same order as on the expression
plot above. Red color means over-expression, green under-expression in
the given condition.
The barplot below shows the condition (sample) scores. A separate bar
is shown for each sample, its height is the corresponding score of the
sample in the module. The red and green numbers on the bars are the
sample scores expressed in percents, i.e. 100% is 1.0.
The red and green lines show the module thresholds, samples above
the red line and below the green line are included in the module.
The different experiments that were part of the study, are separated
by dashed vertical lines.
— Click on the Help button again to close this help window.
| Id | sample | Experiment | ExpName | Array | Syndrome | Cell.line |
| E-TABM-263-raw-cel-1515486031.cel | 20 | 6 | Cycle | hgu133a2 | none | Cycle 1 |
| 5042_CNTL.CEL | 6 | 8 | WBS | hgu133plus2 | none | WBS 1 |
| ctrl c 08-03.CEL | 3 | 1 | DS-CC | hgu133a | none | DS-CC 3 |
| 4Twin.CEL | 4 | 2 | DS-twin | hgu133plus2 | none | DS-twin 4 |
| 46B.CEL | 2 | 3 | DS-mosaic | hgu133plus2 | none | DS-mosaic 2 |
| E-GEOD-3407-raw-cel-1437949655.cel | 3 | 4 | Cockayne | hgu133a | none | CSB |
| 47C.CEL | 5 | 3 | DS-mosaic | hgu133plus2 | Down mosaic | DS-mosaic 5 |
| 47B.CEL | 4 | 3 | DS-mosaic | hgu133plus2 | Down mosaic | DS-mosaic 4 |
| E-GEOD-3407-raw-cel-1437949938.cel | 8 | 4 | Cockayne | hgu133a | none | CSB |
| E-GEOD-3407-raw-cel-1437949854.cel | 7 | 4 | Cockayne | hgu133a | CS | eGFP |


© 2008-2010 Computational Biology Group, Department of Medical Genetics,
University of Lausanne, Switzerland