Previous module |
Next module
Module #538, TG: 3, TC: 1.8, 151 probes, 151 Entrez genes, 5 conditions


HELP
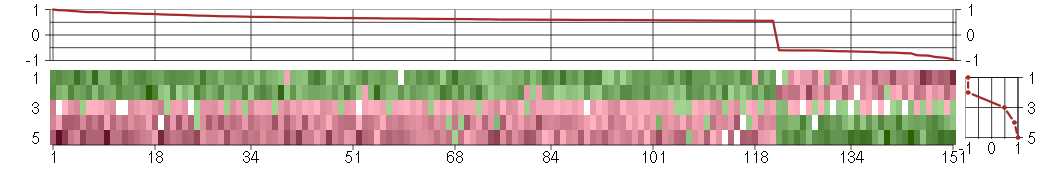
The image plot shows the color-coded level of gene expression, for the
genes and conditions in a given transcription module. The genes are on
the horizontal, the conditions on the vertical axis.
The genes are ordered according to their ISA gene scores, similarly
the conditions are ordered according to their condition scores. The
score of a gene means the «degree of inclusion» in
the module: a high score gene is essential in the module.
Condition scores can also be negative, that means that the genes of
the module are all down-regulated in the condition. Here the absolute
value of the score gives the «degree of inclusion».
The plots above and beside the expression matrix show the gene scores
and condition scores, respectively.
Note that the plot is interactive, you can see the name of the gene
and condition under the mouse cursor.
The expression matrix was normalized to have mean zero and standard
deviation one for every gene separately across all conditions
(i.e. not just for the conditions in the module).
— Click on the Help button again to close this help window.

Under-expression is coded with green,
over-expression with red color.
Help |
Hide |
Top
Help |
Show |
Top
The GO tree — Biological processes
HELP
This is one of three sections showing Gene Ontology enrichment of the
current module: in this case for biological processes.
The graph shows the hierarchy of the GO categories, their enrichment
for the current module is color coded, and the blue number beside the
category is the minus log ten p-value of the enrichment. (Calculated
using the standard hypergeometric test.) The color of the arrows code
«is a» (cyan) and «part of» relationships.
The tree was built the following way. First all GO terms with more
significant enrichment p-value than 0.05 were collected. Then all
paths from these terms to the root node of the GO tree were included
too. If a GO term is included more than once in the tree, then the
green numbers show 1) the id of the node, this makes it easier to find
other appereances of the term, and 2) the number of appearences.
Note that the same GO category might show up on the graph many
times. This is because the GO was «straightened» for this
graph, i.e. if there are more paths from a GO term to the root node of
the tree, all of them are included. The green numbers
Move the mouse cursor over the terms to get their definition. Clicking
on them takes you to the corresponding Gene Ontology web page.
If you cannot see a graph here at all, that means that there were no
significantly enriched GO categories, at the 0.05 level.
— Click on the Help button again to close this help window.

Help |
Hide |
Top
Help |
Show |
Top
The GO tree — Cellular Components
HELP
This is one of three sections showing Gene Ontology enrichment of the
current module: in this case for cellular components.
The graph shows the hierarchy of the GO categories, their enrichment
for the current module is color coded, and the blue number beside the
category is the minus log ten p-value of the enrichment. (Calculated
using the standard hypergeometric test.) The color of the arrows code
«is a» (cyan) and «part of» relationships.
The tree was built the following way. First all GO terms with more
significant enrichment p-value than 0.05 were collected. Then all
paths from these terms to the root node of the GO tree were included
too. If a GO term is included more than once in the tree, then the
green numbers show 1) the id of the node, this makes it easier to find
other appereances of the term, and 2) the number of appearences.
Note that the same GO category might show up on the graph many
times. This is because the GO was «straightened» for this
graph, i.e. if there are more paths from a GO term to the root node of
the tree, all of them are included. The green numbers
Move the mouse cursor over the terms to get their definition. Clicking
on them takes you to the corresponding Gene Ontology web page.
If you cannot see a graph here at all, that means that there were no
significantly enriched GO categories, at the 0.05 level.
— Click on the Help button again to close this help window.
plasma membrane
The membrane surrounding a cell that separates the cell from its external environment. It consists of a phospholipid bilayer and associated proteins.
membrane
Double layer of lipid molecules that encloses all cells, and, in eukaryotes, many organelles; may be a single or double lipid bilayer; also includes associated proteins.
cellular_component
The part of a cell or its extracellular environment in which a gene product is located. A gene product may be located in one or more parts of a cell and its location may be as specific as a particular macromolecular complex, that is, a stable, persistent association of macromolecules that function together.
cell
The basic structural and functional unit of all organisms. Includes the plasma membrane and any external encapsulating structures such as the cell wall and cell envelope.
cell part
Any constituent part of a cell, the basic structural and functional unit of all organisms.
all
This term is the most general term possible
cell part
Any constituent part of a cell, the basic structural and functional unit of all organisms.
Help |
Hide |
Top
Help |
Show |
Top
The GO tree — Molecular Function
HELP
This is one of three sections showing Gene Ontology enrichment of the
current module: in this case for molecular function.
The graph shows the hierarchy of the GO categories, their enrichment
for the current module is color coded, and the blue number beside the
category is the minus log ten p-value of the enrichment. (Calculated
using the standard hypergeometric test.) The color of the arrows code
«is a» (cyan) and «part of» relationships.
The tree was built the following way. First all GO terms with more
significant enrichment p-value than 0.05 were collected. Then all
paths from these terms to the root node of the GO tree were included
too. If a GO term is included more than once in the tree, then the
green numbers show 1) the id of the node, this makes it easier to find
other appereances of the term, and 2) the number of appearences.
Note that the same GO category might show up on the graph many
times. This is because the GO was «straightened» for this
graph, i.e. if there are more paths from a GO term to the root node of
the tree, all of them are included. The green numbers
Move the mouse cursor over the terms to get their definition. Clicking
on them takes you to the corresponding Gene Ontology web page.
If you cannot see a graph here at all, that means that there were no
significantly enriched GO categories, at the 0.05 level.
— Click on the Help button again to close this help window.
Help |
Hide |
Top
Help |
Show |
Top
GO BP test for over-representation
HELP
List of all enriched GO categories (biological processes), at the 0.05
p-value level.
The columns:
- ExpCount is the expected count of genes in the
module annotated with the given GO term, just by chance.
- Count
is the number of genes in the module annotated with the given GO
term.
- Size is the total number of genes (in our universe)
annotated with the GO term.
Clicking on Count shows the genes that drive the
enrichment. You can also click on the individual numbers in
the Count column, to show the driving genes for that individual
GO category.
Clicking on the GO identifiers takes you to the Gene Ontology web
pages.
— Click on the Help button again to close this help window.
| Id | Pvalue | ExpCount | Count | Size | Term |
| GO:0006811 | 3.305e-02 | 4.519 | 13
APOL1, ATP2C2, BEST1, CATSPER2, CHRNB2, CNNM3, CYBB, KCTD17, PLCG2, SLC30A4, SLC5A5, TRPC1, TRPV4 | 297 | ion transport |
Help |
Hide |
Top
Help |
Show |
Top
GO CC test for over-representation
HELP
List of all enriched GO categories (cellular components), at the 0.05
p-value level.
The columns:
- ExpCount is the expected count of genes in the
module annotated with the given GO term, just by chance.
- Count
is the number of genes in the module annotated with the given GO
term.
- Size is the total number of genes (in our universe)
annotated with the GO term.
Clicking on Count shows the genes that drive the
enrichment. You can also click on the individual numbers in
the Count column, to show the driving genes for that individual
GO category.
Clicking on the GO identifiers takes you to the Gene Ontology web
pages.
— Click on the Help button again to close this help window.
| Id | Pvalue | ExpCount | Count | Size | Term |
| GO:0005886 | 8.797e-03 | 22.02 | 38
ABCA7, ADORA1, ADRA1D, ALPPL2, APP, BCAM, BEST1, CATSPER2, CD79B, CHRNB2, CNNM3, CYBB, EDA, EPN1, FLT3LG, GPR144, GRM1, HLA-DRB1, HPN, ICAM2, INHA, ITGAL, KCTD17, KRT8, LILRB3, LILRB4, MERTK, OPRL1, PLCG2, ROS1, SEPT5, SIGLEC1, SLC5A5, SORBS1, TMPRSS6, TNFRSF8, TRPC1, TRPV4 | 1443 | plasma membrane |
| GO:0031224 | 4.590e-02 | 31.3 | 46
ABCA7, ADORA1, ADRA1D, ALPPL2, ANKRD46, APOL1, APP, ASPHD1, ATP2C2, BCAM, BEST1, C2orf37, CATSPER2, CD79B, CHRNB2, CNNM3, CTAGE1, CYBB, EDA, FLT3LG, GGT1, GPR144, GRM1, HLA-DRB1, HPN, ICAM2, ITGAL, KCTD17, LILRA5, LILRB3, LILRB4, MERTK, OPRL1, PCNXL2, PLXNB3, RNF121, ROS1, SIGLEC1, SLC30A4, SLC5A5, ST8SIA3, TMC5, TMPRSS6, TNFRSF8, TRPC1, TRPV4 | 2051 | intrinsic to membrane |
Help |
Hide |
Top
Help |
Show |
Top
GO MF test for over-representation
HELP
List of all enriched GO categories (molecular function), at the 0.05
p-value level.
The columns:
- ExpCount is the expected count of genes in the
module annotated with the given GO term, just by chance.
- Count
is the number of genes in the module annotated with the given GO
term.
- Size is the total number of genes (in our universe)
annotated with the GO term.
Clicking on Count shows the genes that drive the
enrichment. You can also click on the individual numbers in
the Count column, to show the driving genes for that individual
GO category.
Clicking on the GO identifiers takes you to the Gene Ontology web
pages.
— Click on the Help button again to close this help window.
| Id | Pvalue | ExpCount | Count | Size | Term |
| GO:0005078 | 2.371e-02 | 0.03156 | 2
MAPK8IP1, MAPK8IP2 | 2 | MAP-kinase scaffold activity |
| GO:0005216 | 3.856e-02 | 1.846 | 8
APOL1, BEST1, CATSPER2, CHRNB2, CYBB, KCTD17, TRPC1, TRPV4 | 117 | ion channel activity |
| GO:0022838 | 4.144e-02 | 1.878 | 8
APOL1, BEST1, CATSPER2, CHRNB2, CYBB, KCTD17, TRPC1, TRPV4 | 119 | substrate specific channel activity |
| GO:0015267 | 4.616e-02 | 1.925 | 8
APOL1, BEST1, CATSPER2, CHRNB2, CYBB, KCTD17, TRPC1, TRPV4 | 122 | channel activity |
| GO:0022803 | 4.616e-02 | 1.925 | 8
APOL1, BEST1, CATSPER2, CHRNB2, CYBB, KCTD17, TRPC1, TRPV4 | 122 | passive transmembrane transporter activity |
Help |
Hide |
Top
Help |
Show |
Top
KEGG Pathway test for over-representation
HELP
List of all enriched KEGG pathways, at the 0.05
p-value level.
The columns:
- ExpCount is the expected count of genes in the
module annotated with the given KEGG pathway, just by chance.
- Count
is the number of genes in the module annotated with the given KEGG
pathway.
- Size is the total number of genes (in our universe)
annotated with the KEGG pathway.
Clicking on Count shows the genes that drive the
enrichment. You can also click on the individual numbers in
the Count column, to show the driving genes for that individual
KEGG pathway.
Clicking on the KEGG identifiers takes you to the KEGG web site.
— Click on the Help button again to close this help window.
Help |
Hide |
Top
Help |
Show |
Top
miRNA test for over-representation
HELP
List of all enriched miRNA families, at the 0.05
p-value level.
The columns:
- ExpCount is the expected count of genes in the
module regulated by the given miRNA family, just by chance.
- Count
is the number of genes in the module regulated by the given miRNA
family.
- Size is the total number of genes (in our universe)
regulated with the given miRNA family.
Clicking on Count shows the genes that drive the
enrichment. You can also click on the individual numbers in
the Count column, to show the driving genes for that individual
miRNA family.
The miRNA regulation data was taken from the TargetScan database.
(Only the conserved sites were used for the current analysis.)
Clicking on the miRNA names takes you to the TargetScan web site.
— Click on the Help button again to close this help window.
Help |
Hide |
Top
Help |
Show |
Top
Chromosome test for over-representation
HELP
List of all enriched Chromosomes, at the 0.05
p-value level.
The columns:
- ExpCount is the expected number of genes in the
module on the given chromosome, just by chance.
- Count
is the number of genes in the module on the given chromosome.
- Size is the total number of genes (in our universe)
on the given chromosome.
Clicking on Count shows the genes that drive the
enrichment. You can also click on the individual numbers in
the Count column, to show the driving genes for that individual
chromosome.
— Click on the Help button again to close this help window.
HELP
A list of all genes in the current module, in alphabetical order. The
size of the text corresponds to the gene scores.
Note that some gene symbols may show up more than once, if many
probes match the same Entrez gene.
Genes with no Entrez mapping are given separately, with their
Affymetrics probe ID.
— Click on the Help button again to close this help window.
Entrez genes
ABCA7ATP-binding cassette, sub-family A (ABC1), member 7 (219577_s_at), score: 0.97
ADAMTS7ADAM metallopeptidase with thrombospondin type 1 motif, 7 (220705_s_at), score: 0.68
ADORA1adenosine A1 receptor (216220_s_at), score: 0.71
ADRA1Dadrenergic, alpha-1D-, receptor (210961_s_at), score: 0.84
ALDH1L1aldehyde dehydrogenase 1 family, member L1 (215798_at), score: 0.6
ALPPL2alkaline phosphatase, placental-like 2 (216377_x_at), score: 0.63
AMELXamelogenin (amelogenesis imperfecta 1, X-linked) (208410_x_at), score: 0.59
ANKRD46ankyrin repeat domain 46 (212731_at), score: -0.7
APOC4apolipoprotein C-IV (206738_at), score: 0.65
APOL1apolipoprotein L, 1 (209546_s_at), score: 0.62
APPamyloid beta (A4) precursor protein (214953_s_at), score: 0.8
ARHGEF15Rho guanine nucleotide exchange factor (GEF) 15 (217348_x_at), score: 0.56
ASPHD1aspartate beta-hydroxylase domain containing 1 (214993_at), score: 0.81
ATHL1ATH1, acid trehalase-like 1 (yeast) (219359_at), score: 0.62
ATP2C2ATPase, Ca++ transporting, type 2C, member 2 (214798_at), score: 0.58
BCAMbasal cell adhesion molecule (Lutheran blood group) (40093_at), score: 0.73
BEST1bestrophin 1 (207671_s_at), score: 0.71
BRAFv-raf murine sarcoma viral oncogene homolog B1 (206044_s_at), score: -0.81
C10orf84chromosome 10 open reading frame 84 (218390_s_at), score: -0.64
C1orf69chromosome 1 open reading frame 69 (215490_at), score: 0.58
C2orf37chromosome 2 open reading frame 37 (220172_at), score: -0.61
C7orf28Achromosome 7 open reading frame 28A (201974_s_at), score: 0.56
CATSPER2cation channel, sperm associated 2 (217588_at), score: 0.59
CC2D1Acoiled-coil and C2 domain containing 1A (58994_at), score: 0.64
CCDC33coiled-coil domain containing 33 (220908_at), score: 0.64
CCDC40coiled-coil domain containing 40 (220592_at), score: 0.9
CCDC9coiled-coil domain containing 9 (206257_at), score: 0.56
CD79BCD79b molecule, immunoglobulin-associated beta (205297_s_at), score: 0.69
CFHR2complement factor H-related 2 (206910_x_at), score: 0.57
CHRNB2cholinergic receptor, nicotinic, beta 2 (neuronal) (206635_at), score: 0.66
CNNM3cyclin M3 (220739_s_at), score: -0.61
CNTLNcentlein, centrosomal protein (220095_at), score: -0.63
CTAGE1cutaneous T-cell lymphoma-associated antigen 1 (220957_at), score: -0.72
CYBBcytochrome b-245, beta polypeptide (203923_s_at), score: 0.63
CYorf14chromosome Y open reading frame 14 (207063_at), score: -0.69
CYTH4cytohesin 4 (219183_s_at), score: 0.68
DCAKDdephospho-CoA kinase domain containing (221224_s_at), score: 0.68
DLX4distal-less homeobox 4 (208216_at), score: 0.59
DMBT1deleted in malignant brain tumors 1 (208250_s_at), score: 0.76
DSPPdentin sialophosphoprotein (221681_s_at), score: 0.73
EDAectodysplasin A (211130_x_at), score: 0.93
EPN1epsin 1 (221141_x_at), score: 0.79
EPS8L1EPS8-like 1 (218778_x_at), score: 0.6
ETNK2ethanolamine kinase 2 (219268_at), score: 0.56
EXPH5exophilin 5 (214734_at), score: -0.79
F11coagulation factor XI (206610_s_at), score: 0.66
FKBP10FK506 binding protein 10, 65 kDa (219249_s_at), score: 0.97
FLCNfolliculin (215645_at), score: 0.56
FLT3LGfms-related tyrosine kinase 3 ligand (210607_at), score: 0.58
GARNL1GTPase activating Rap/RanGAP domain-like 1 (214855_s_at), score: -0.64
GASTgastrin (208138_at), score: 0.66
GATMglycine amidinotransferase (L-arginine:glycine amidinotransferase) (203178_at), score: -0.66
GBA3glucosidase, beta, acid 3 (cytosolic) (219954_s_at), score: 0.61
GGT1gamma-glutamyltransferase 1 (209919_x_at), score: 0.63
GPR144G protein-coupled receptor 144 (216289_at), score: 0.83
GRM1glutamate receptor, metabotropic 1 (210939_s_at), score: 0.57
GSDMBgasdermin B (215659_at), score: -0.8
HAB1B1 for mucin (215778_x_at), score: 0.73
HAO2hydroxyacid oxidase 2 (long chain) (220801_s_at), score: 0.59
HIPK2homeodomain interacting protein kinase 2 (219028_at), score: 0.6
HIST1H2AGhistone cluster 1, H2ag (207156_at), score: -0.6
HLA-DRB1major histocompatibility complex, class II, DR beta 1 (209312_x_at), score: 0.6
HPNhepsin (204934_s_at), score: 0.59
HSPA6heat shock 70kDa protein 6 (HSP70B') (117_at), score: 0.61
ICAM2intercellular adhesion molecule 2 (204683_at), score: 0.67
IFT140intraflagellar transport 140 homolog (Chlamydomonas) (204792_s_at), score: 0.68
IGLL3immunoglobulin lambda-like polypeptide 3 (215946_x_at), score: 0.57
IL23Ainterleukin 23, alpha subunit p19 (211796_s_at), score: 0.66
INAinternexin neuronal intermediate filament protein, alpha (204465_s_at), score: -0.62
INHAinhibin, alpha (210141_s_at), score: 0.6
ITGALintegrin, alpha L (antigen CD11A (p180), lymphocyte function-associated antigen 1; alpha polypeptide) (213475_s_at), score: 0.75
KCTD17potassium channel tetramerisation domain containing 17 (205561_at), score: 0.67
KIF26Bkinesin family member 26B (220002_at), score: 0.63
KRT8keratin 8 (209008_x_at), score: 0.67
KRT86keratin 86 (215189_at), score: 0.6
KRT8P12keratin 8 pseudogene 12 (222060_at), score: 0.88
KSR1kinase suppressor of ras 1 (213769_at), score: 0.76
LATS1LATS, large tumor suppressor, homolog 1 (Drosophila) (219813_at), score: -0.67
LILRA5leukocyte immunoglobulin-like receptor, subfamily A (with TM domain), member 5 (215838_at), score: 0.79
LILRB3leukocyte immunoglobulin-like receptor, subfamily B (with TM and ITIM domains), member 3 (211133_x_at), score: 0.68
LILRB4leukocyte immunoglobulin-like receptor, subfamily B (with TM and ITIM domains), member 4 (210152_at), score: 0.57
LOC100128919similar to HSPC157 (219865_at), score: -0.69
LOC100133748similar to GTF2IRD2 protein (215569_at), score: 0.57
LOC149478hypothetical protein LOC149478 (215462_at), score: 0.63
LOC149501similar to keratin 8 (216821_at), score: 0.56
LRBALPS-responsive vesicle trafficking, beach and anchor containing (214109_at), score: -0.69
MAPK8IP1mitogen-activated protein kinase 8 interacting protein 1 (213013_at), score: 0.86
MAPK8IP2mitogen-activated protein kinase 8 interacting protein 2 (205050_s_at), score: 0.72
MDM2Mdm2 p53 binding protein homolog (mouse) (205386_s_at), score: -0.66
MERTKc-mer proto-oncogene tyrosine kinase (211913_s_at), score: 0.71
MICAL3microtubule associated monoxygenase, calponin and LIM domain containing 3 (212715_s_at), score: -0.6
MOCS1molybdenum cofactor synthesis 1 (211673_s_at), score: 0.58
MSTP9macrophage stimulating, pseudogene 9 (213382_at), score: 0.59
MUC5ACmucin 5AC, oligomeric mucus/gel-forming (217182_at), score: 0.78
MYL10myosin, light chain 10, regulatory (221659_s_at), score: 0.66
MYO15Amyosin XVA (220288_at), score: 0.74
MYO5Bmyosin VB (202002_at), score: 0.6
NOVA2neuro-oncological ventral antigen 2 (206477_s_at), score: 0.69
NPEPL1aminopeptidase-like 1 (89476_r_at), score: 0.59
OPRL1opiate receptor-like 1 (206564_at), score: 0.85
PCNXL2pecanex-like 2 (Drosophila) (39650_s_at), score: 0.64
PHC1polyhomeotic homolog 1 (Drosophila) (218338_at), score: -0.65
PHF2PHD finger protein 2 (212726_at), score: -0.72
PIPOXpipecolic acid oxidase (221605_s_at), score: 0.82
PKLRpyruvate kinase, liver and RBC (222078_at), score: 0.95
PLCG2phospholipase C, gamma 2 (phosphatidylinositol-specific) (204613_at), score: 0.59
PLXNB3plexin B3 (205957_at), score: 0.57
PMS2L2postmeiotic segregation increased 2-like 2 pseudogene (215410_at), score: 1
PNMAL1PNMA-like 1 (218824_at), score: -0.61
POM121L2POM121 membrane glycoprotein-like 2 (rat) (216582_at), score: 0.9
PYHIN1pyrin and HIN domain family, member 1 (216748_at), score: 0.56
RAP1GAPRAP1 GTPase activating protein (203911_at), score: 0.56
RBM12BRNA binding motif protein 12B (51228_at), score: -0.86
RBM38RNA binding motif protein 38 (212430_at), score: 0.86
RLN1relaxin 1 (211753_s_at), score: 0.7
RNF121ring finger protein 121 (219021_at), score: 0.86
ROS1c-ros oncogene 1 , receptor tyrosine kinase (207569_at), score: 0.59
RPL18AP6ribosomal protein L18a pseudogene 6 (216383_at), score: 0.59
RPS6KA1ribosomal protein S6 kinase, 90kDa, polypeptide 1 (203379_at), score: 0.58
SCLYselenocysteine lyase (221575_at), score: -0.96
SEPT5septin 5 (209767_s_at), score: 0.83
SH2D3ASH2 domain containing 3A (222169_x_at), score: 0.64
SIGLEC1sialic acid binding Ig-like lectin 1, sialoadhesin (44673_at), score: 0.62
SIX6SIX homeobox 6 (207250_at), score: 0.56
SLC30A4solute carrier family 30 (zinc transporter), member 4 (207362_at), score: -0.88
SLC5A5solute carrier family 5 (sodium iodide symporter), member 5 (211123_at), score: 0.59
SORBS1sorbin and SH3 domain containing 1 (218087_s_at), score: 0.59
SSX3synovial sarcoma, X breakpoint 3 (211731_x_at), score: 0.7
ST8SIA3ST8 alpha-N-acetyl-neuraminide alpha-2,8-sialyltransferase 3 (208064_s_at), score: 0.9
STXBP2syntaxin binding protein 2 (209367_at), score: 0.65
TAF15TAF15 RNA polymerase II, TATA box binding protein (TBP)-associated factor, 68kDa (202840_at), score: 0.77
TAL1T-cell acute lymphocytic leukemia 1 (206283_s_at), score: 0.58
TBX10T-box 10 (207689_at), score: 0.6
TMC5transmembrane channel-like 5 (219580_s_at), score: 0.57
TMPRSS6transmembrane protease, serine 6 (214955_at), score: 0.91
TMSB4Ythymosin beta 4, Y-linked (206769_at), score: 0.71
TNFRSF8tumor necrosis factor receptor superfamily, member 8 (206729_at), score: 0.66
TNK1tyrosine kinase, non-receptor, 1 (217149_x_at), score: 0.6
TRMT61AtRNA methyltransferase 61 homolog A (S. cerevisiae) (52741_at), score: 0.56
TRPC1transient receptor potential cation channel, subfamily C, member 1 (205802_at), score: -0.6
TRPV4transient receptor potential cation channel, subfamily V, member 4 (219516_at), score: 0.65
TSKStestis-specific serine kinase substrate (220545_s_at), score: 0.6
TULP2tubby like protein 2 (206733_at), score: 0.62
VCPIP1valosin containing protein (p97)/p47 complex interacting protein 1 (219810_at), score: 0.63
WFDC8WAP four-disulfide core domain 8 (215276_at), score: 0.6
XYLBxylulokinase homolog (H. influenzae) (214776_x_at), score: 0.62
YPEL1yippee-like 1 (Drosophila) (206063_x_at), score: 0.72
ZNF192zinc finger protein 192 (206579_at), score: -0.64
ZNF214zinc finger protein 214 (220497_at), score: -0.9
ZNF571zinc finger protein 571 (206648_at), score: -0.61
ZNF702Pzinc finger protein 702 pseudogene (206557_at), score: -0.61
Non-Entrez genes
Unknown, score:
HELP
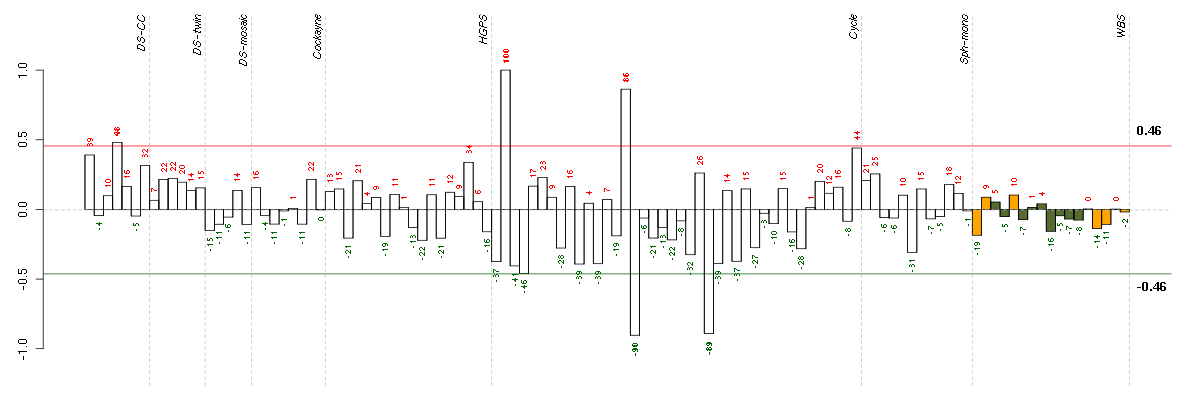
Conditions in the module, given in the same order as on the expression
plot above. Red color means over-expression, green under-expression in
the given condition.
The barplot below shows the condition (sample) scores. A separate bar
is shown for each sample, its height is the corresponding score of the
sample in the module. The red and green numbers on the bars are the
sample scores expressed in percents, i.e. 100% is 1.0.
The red and green lines show the module thresholds, samples above
the red line and below the green line are included in the module.
The different experiments that were part of the study, are separated
by dashed vertical lines.
— Click on the Help button again to close this help window.
| Id | sample | Experiment | ExpName | Array | Syndrome | Cell.line |
| E-TABM-263-raw-cel-1515486111.cel | 24 | 6 | Cycle | hgu133a2 | none | Cycle 1 |
| E-TABM-263-raw-cel-1515485951.cel | 16 | 6 | Cycle | hgu133a2 | none | Cycle 1 |
| t21a 08-03.CEL | 4 | 1 | DS-CC | hgu133a | Down | DS-CC 4 |
| E-TABM-263-raw-cel-1515485931.cel | 15 | 6 | Cycle | hgu133a2 | none | Cycle 1 |
| E-TABM-263-raw-cel-1515485671.cel | 2 | 6 | Cycle | hgu133a2 | none | Cycle 1 |


© 2008-2010 Computational Biology Group, Department of Medical Genetics,
University of Lausanne, Switzerland