Previous module |
Next module
Module #619, TG: 2.8, TC: 2, 96 probes, 96 Entrez genes, 5 conditions


HELP
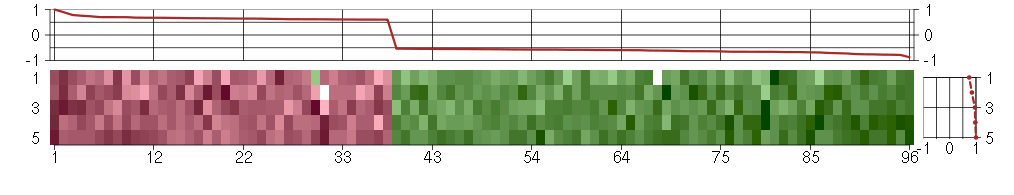
The image plot shows the color-coded level of gene expression, for the
genes and conditions in a given transcription module. The genes are on
the horizontal, the conditions on the vertical axis.
The genes are ordered according to their ISA gene scores, similarly
the conditions are ordered according to their condition scores. The
score of a gene means the «degree of inclusion» in
the module: a high score gene is essential in the module.
Condition scores can also be negative, that means that the genes of
the module are all down-regulated in the condition. Here the absolute
value of the score gives the «degree of inclusion».
The plots above and beside the expression matrix show the gene scores
and condition scores, respectively.
Note that the plot is interactive, you can see the name of the gene
and condition under the mouse cursor.
The expression matrix was normalized to have mean zero and standard
deviation one for every gene separately across all conditions
(i.e. not just for the conditions in the module).
— Click on the Help button again to close this help window.

Under-expression is coded with green,
over-expression with red color.
Help |
Hide |
Top
Help |
Show |
Top
The GO tree — Biological processes
HELP
This is one of three sections showing Gene Ontology enrichment of the
current module: in this case for biological processes.
The graph shows the hierarchy of the GO categories, their enrichment
for the current module is color coded, and the blue number beside the
category is the minus log ten p-value of the enrichment. (Calculated
using the standard hypergeometric test.) The color of the arrows code
«is a» (cyan) and «part of» relationships.
The tree was built the following way. First all GO terms with more
significant enrichment p-value than 0.05 were collected. Then all
paths from these terms to the root node of the GO tree were included
too. If a GO term is included more than once in the tree, then the
green numbers show 1) the id of the node, this makes it easier to find
other appereances of the term, and 2) the number of appearences.
Note that the same GO category might show up on the graph many
times. This is because the GO was «straightened» for this
graph, i.e. if there are more paths from a GO term to the root node of
the tree, all of them are included. The green numbers
Move the mouse cursor over the terms to get their definition. Clicking
on them takes you to the corresponding Gene Ontology web page.
If you cannot see a graph here at all, that means that there were no
significantly enriched GO categories, at the 0.05 level.
— Click on the Help button again to close this help window.

Help |
Hide |
Top
Help |
Show |
Top
The GO tree — Cellular Components
HELP
This is one of three sections showing Gene Ontology enrichment of the
current module: in this case for cellular components.
The graph shows the hierarchy of the GO categories, their enrichment
for the current module is color coded, and the blue number beside the
category is the minus log ten p-value of the enrichment. (Calculated
using the standard hypergeometric test.) The color of the arrows code
«is a» (cyan) and «part of» relationships.
The tree was built the following way. First all GO terms with more
significant enrichment p-value than 0.05 were collected. Then all
paths from these terms to the root node of the GO tree were included
too. If a GO term is included more than once in the tree, then the
green numbers show 1) the id of the node, this makes it easier to find
other appereances of the term, and 2) the number of appearences.
Note that the same GO category might show up on the graph many
times. This is because the GO was «straightened» for this
graph, i.e. if there are more paths from a GO term to the root node of
the tree, all of them are included. The green numbers
Move the mouse cursor over the terms to get their definition. Clicking
on them takes you to the corresponding Gene Ontology web page.
If you cannot see a graph here at all, that means that there were no
significantly enriched GO categories, at the 0.05 level.
— Click on the Help button again to close this help window.
extracellular region
The space external to the outermost structure of a cell. For cells without external protective or external encapsulating structures this refers to space outside of the plasma membrane. This term covers the host cell environment outside an intracellular parasite.
cellular_component
The part of a cell or its extracellular environment in which a gene product is located. A gene product may be located in one or more parts of a cell and its location may be as specific as a particular macromolecular complex, that is, a stable, persistent association of macromolecules that function together.
extracellular space
That part of a multicellular organism outside the cells proper, usually taken to be outside the plasma membranes, and occupied by fluid.
extracellular region part
Any constituent part of the extracellular region, the space external to the outermost structure of a cell. For cells without external protective or external encapsulating structures this refers to space outside of the plasma membrane. This term covers constituent parts of the host cell environment outside an intracellular parasite.
all
This term is the most general term possible
extracellular region part
Any constituent part of the extracellular region, the space external to the outermost structure of a cell. For cells without external protective or external encapsulating structures this refers to space outside of the plasma membrane. This term covers constituent parts of the host cell environment outside an intracellular parasite.
Help |
Hide |
Top
Help |
Show |
Top
The GO tree — Molecular Function
HELP
This is one of three sections showing Gene Ontology enrichment of the
current module: in this case for molecular function.
The graph shows the hierarchy of the GO categories, their enrichment
for the current module is color coded, and the blue number beside the
category is the minus log ten p-value of the enrichment. (Calculated
using the standard hypergeometric test.) The color of the arrows code
«is a» (cyan) and «part of» relationships.
The tree was built the following way. First all GO terms with more
significant enrichment p-value than 0.05 were collected. Then all
paths from these terms to the root node of the GO tree were included
too. If a GO term is included more than once in the tree, then the
green numbers show 1) the id of the node, this makes it easier to find
other appereances of the term, and 2) the number of appearences.
Note that the same GO category might show up on the graph many
times. This is because the GO was «straightened» for this
graph, i.e. if there are more paths from a GO term to the root node of
the tree, all of them are included. The green numbers
Move the mouse cursor over the terms to get their definition. Clicking
on them takes you to the corresponding Gene Ontology web page.
If you cannot see a graph here at all, that means that there were no
significantly enriched GO categories, at the 0.05 level.
— Click on the Help button again to close this help window.
molecular_function
Elemental activities, such as catalysis or binding, describing the actions of a gene product at the molecular level. A given gene product may exhibit one or more molecular functions.
serine-type endopeptidase activity
Catalysis of the hydrolysis of internal, alpha-peptide bonds in a polypeptide chain by a catalytic mechanism that involves a catalytic triad consisting of a serine nucleophile that is activated by a proton relay involving an acidic residue (e.g. aspartate or glutamate) and a basic residue (usually histidine).
catalytic activity
Catalysis of a biochemical reaction at physiological temperatures. In biologically catalyzed reactions, the reactants are known as substrates, and the catalysts are naturally occurring macromolecular substances known as enzymes. Enzymes possess specific binding sites for substrates, and are usually composed wholly or largely of protein, but RNA that has catalytic activity (ribozyme) is often also regarded as enzymatic.
endopeptidase activity
Catalysis of the hydrolysis of internal, alpha-peptide bonds in a polypeptide chain.
serine-type peptidase activity
Catalysis of the hydrolysis of peptide bonds in a polypeptide chain by a catalytic mechanism that involves a catalytic triad consisting of a serine nucleophile that is activated by a proton relay involving an acidic residue (e.g. aspartate or glutamate) and a basic residue (usually histidine).
peptidase activity
Catalysis of the hydrolysis of a peptide bond. A peptide bond is a covalent bond formed when the carbon atom from the carboxyl group of one amino acid shares electrons with the nitrogen atom from the amino group of a second amino acid.
peptidase activity, acting on L-amino acid peptides
Catalysis of the hydrolysis of peptide bonds formed between L-amino acids.
hydrolase activity
Catalysis of the hydrolysis of various bonds, e.g. C-O, C-N, C-C, phosphoric anhydride bonds, etc. Hydrolase is the systematic name for any enzyme of EC class 3.
serine hydrolase activity
Catalysis of the hydrolysis of a substrate by a catalytic mechanism that involves a catalytic triad consisting of a serine nucleophile that is activated by a proton relay involving an acidic residue (e.g. aspartate or glutamate) and a basic residue (usually histidine).
all
This term is the most general term possible
serine-type peptidase activity
Catalysis of the hydrolysis of peptide bonds in a polypeptide chain by a catalytic mechanism that involves a catalytic triad consisting of a serine nucleophile that is activated by a proton relay involving an acidic residue (e.g. aspartate or glutamate) and a basic residue (usually histidine).
serine-type endopeptidase activity
Catalysis of the hydrolysis of internal, alpha-peptide bonds in a polypeptide chain by a catalytic mechanism that involves a catalytic triad consisting of a serine nucleophile that is activated by a proton relay involving an acidic residue (e.g. aspartate or glutamate) and a basic residue (usually histidine).
Help |
Hide |
Top
Help |
Show |
Top
GO BP test for over-representation
HELP
List of all enriched GO categories (biological processes), at the 0.05
p-value level.
The columns:
- ExpCount is the expected count of genes in the
module annotated with the given GO term, just by chance.
- Count
is the number of genes in the module annotated with the given GO
term.
- Size is the total number of genes (in our universe)
annotated with the GO term.
Clicking on Count shows the genes that drive the
enrichment. You can also click on the individual numbers in
the Count column, to show the driving genes for that individual
GO category.
Clicking on the GO identifiers takes you to the Gene Ontology web
pages.
— Click on the Help button again to close this help window.
| Id | Pvalue | ExpCount | Count | Size | Term |
| GO:0006349 | 2.190e-02 | 0.03043 | 2
DIRAS3, IGF2 | 3 | genetic imprinting |
Help |
Hide |
Top
Help |
Show |
Top
GO CC test for over-representation
HELP
List of all enriched GO categories (cellular components), at the 0.05
p-value level.
The columns:
- ExpCount is the expected count of genes in the
module annotated with the given GO term, just by chance.
- Count
is the number of genes in the module annotated with the given GO
term.
- Size is the total number of genes (in our universe)
annotated with the GO term.
Clicking on Count shows the genes that drive the
enrichment. You can also click on the individual numbers in
the Count column, to show the driving genes for that individual
GO category.
Clicking on the GO identifiers takes you to the Gene Ontology web
pages.
— Click on the Help button again to close this help window.
| Id | Pvalue | ExpCount | Count | Size | Term |
| GO:0005576 | 9.300e-06 | 7.417 | 24
ACAN, ASPN, CCL11, CDCP1, CLEC3B, CLU, COL14A1, COL5A3, CST6, CTSS, DPP4, EMCN, EREG, HGF, IGF2, IL13RA2, IL33, KAL1, MSTP9, OLFML2A, PRSS1, PRSS2, PRSS3, SEMA3C | 700 | extracellular region |
| GO:0044421 | 5.095e-04 | 4.1 | 15
ACAN, ASPN, CCL11, CLU, COL14A1, COL5A3, EREG, IGF2, IL13RA2, IL33, KAL1, OLFML2A, PRSS2, PRSS3, SEMA3C | 387 | extracellular region part |
| GO:0005615 | 7.922e-03 | 2.606 | 10
CCL11, CLU, EREG, IGF2, IL13RA2, IL33, KAL1, PRSS2, PRSS3, SEMA3C | 246 | extracellular space |
| GO:0060053 | 1.807e-02 | 0.04238 | 2
NEFL, SYNM | 4 | neurofilament cytoskeleton |
| GO:0031012 | 4.149e-02 | 1.759 | 7
ACAN, ASPN, COL14A1, COL5A3, KAL1, OLFML2A, PRSS2 | 166 | extracellular matrix |
Help |
Hide |
Top
Help |
Show |
Top
GO MF test for over-representation
HELP
List of all enriched GO categories (molecular function), at the 0.05
p-value level.
The columns:
- ExpCount is the expected count of genes in the
module annotated with the given GO term, just by chance.
- Count
is the number of genes in the module annotated with the given GO
term.
- Size is the total number of genes (in our universe)
annotated with the GO term.
Clicking on Count shows the genes that drive the
enrichment. You can also click on the individual numbers in
the Count column, to show the driving genes for that individual
GO category.
Clicking on the GO identifiers takes you to the Gene Ontology web
pages.
— Click on the Help button again to close this help window.
| Id | Pvalue | ExpCount | Count | Size | Term |
| GO:0004252 | 3.080e-03 | 0.5548 | 6
DPP4, HGF, MSTP9, PRSS1, PRSS2, PRSS3 | 55 | serine-type endopeptidase activity |
| GO:0008236 | 6.968e-03 | 0.6658 | 6
DPP4, HGF, MSTP9, PRSS1, PRSS2, PRSS3 | 66 | serine-type peptidase activity |
| GO:0017171 | 6.968e-03 | 0.6658 | 6
DPP4, HGF, MSTP9, PRSS1, PRSS2, PRSS3 | 66 | serine hydrolase activity |
| GO:0004175 | 1.012e-02 | 1.826 | 9
CTSK, CTSO, CTSS, DPP4, HGF, MSTP9, PRSS1, PRSS2, PRSS3 | 181 | endopeptidase activity |
Help |
Hide |
Top
Help |
Show |
Top
KEGG Pathway test for over-representation
HELP
List of all enriched KEGG pathways, at the 0.05
p-value level.
The columns:
- ExpCount is the expected count of genes in the
module annotated with the given KEGG pathway, just by chance.
- Count
is the number of genes in the module annotated with the given KEGG
pathway.
- Size is the total number of genes (in our universe)
annotated with the KEGG pathway.
Clicking on Count shows the genes that drive the
enrichment. You can also click on the individual numbers in
the Count column, to show the driving genes for that individual
KEGG pathway.
Clicking on the KEGG identifiers takes you to the KEGG web site.
— Click on the Help button again to close this help window.
Help |
Hide |
Top
Help |
Show |
Top
miRNA test for over-representation
HELP
List of all enriched miRNA families, at the 0.05
p-value level.
The columns:
- ExpCount is the expected count of genes in the
module regulated by the given miRNA family, just by chance.
- Count
is the number of genes in the module regulated by the given miRNA
family.
- Size is the total number of genes (in our universe)
regulated with the given miRNA family.
Clicking on Count shows the genes that drive the
enrichment. You can also click on the individual numbers in
the Count column, to show the driving genes for that individual
miRNA family.
The miRNA regulation data was taken from the TargetScan database.
(Only the conserved sites were used for the current analysis.)
Clicking on the miRNA names takes you to the TargetScan web site.
— Click on the Help button again to close this help window.
Help |
Hide |
Top
Help |
Show |
Top
Chromosome test for over-representation
HELP
List of all enriched Chromosomes, at the 0.05
p-value level.
The columns:
- ExpCount is the expected number of genes in the
module on the given chromosome, just by chance.
- Count
is the number of genes in the module on the given chromosome.
- Size is the total number of genes (in our universe)
on the given chromosome.
Clicking on Count shows the genes that drive the
enrichment. You can also click on the individual numbers in
the Count column, to show the driving genes for that individual
chromosome.
— Click on the Help button again to close this help window.
HELP
A list of all genes in the current module, in alphabetical order. The
size of the text corresponds to the gene scores.
Note that some gene symbols may show up more than once, if many
probes match the same Entrez gene.
Genes with no Entrez mapping are given separately, with their
Affymetrics probe ID.
— Click on the Help button again to close this help window.
Entrez genes
ACANaggrecan (205679_x_at), score: 0.61
ANXA10annexin A10 (210143_at), score: -0.67
ARMC9armadillo repeat containing 9 (219637_at), score: 0.61
ARNT2aryl-hydrocarbon receptor nuclear translocator 2 (202986_at), score: 0.61
ASPNasporin (219087_at), score: -0.56
ASTN2astrotactin 2 (209693_at), score: 0.65
B3GNTL1UDP-GlcNAc:betaGal beta-1,3-N-acetylglucosaminyltransferase-like 1 (213589_s_at), score: 0.62
C11orf67chromosome 11 open reading frame 67 (221600_s_at), score: 0.62
C17orf39chromosome 17 open reading frame 39 (220058_at), score: 0.64
C1orf9chromosome 1 open reading frame 9 (203429_s_at), score: -0.61
C2CD2LC2CD2-like (204757_s_at), score: -0.54
CCL11chemokine (C-C motif) ligand 11 (210133_at), score: -0.57
CD320CD320 molecule (218529_at), score: 0.7
CD55CD55 molecule, decay accelerating factor for complement (Cromer blood group) (201925_s_at), score: -0.66
CDCP1CUB domain containing protein 1 (218451_at), score: -0.58
CDH18cadherin 18, type 2 (206280_at), score: 0.6
CLEC3BC-type lectin domain family 3, member B (205200_at), score: -0.77
CLK1CDC-like kinase 1 (214683_s_at), score: -0.6
CLK4CDC-like kinase 4 (210346_s_at), score: -0.57
CLUclusterin (208791_at), score: -0.59
COL14A1collagen, type XIV, alpha 1 (212865_s_at), score: -0.59
COL5A3collagen, type V, alpha 3 (52255_s_at), score: -0.77
CORO2Bcoronin, actin binding protein, 2B (209789_at), score: -0.61
CST6cystatin E/M (206595_at), score: -0.7
CTSKcathepsin K (202450_s_at), score: -0.56
CTSOcathepsin O (203758_at), score: -0.58
CTSScathepsin S (202901_x_at), score: -0.54
DIRAS3DIRAS family, GTP-binding RAS-like 3 (215506_s_at), score: -0.72
DNAJB9DnaJ (Hsp40) homolog, subfamily B, member 9 (202843_at), score: -0.54
DPP4dipeptidyl-peptidase 4 (211478_s_at), score: -0.57
DUS4Ldihydrouridine synthase 4-like (S. cerevisiae) (205761_s_at), score: 0.6
DUSP5dual specificity phosphatase 5 (209457_at), score: -0.56
DUSP6dual specificity phosphatase 6 (208892_s_at), score: -0.55
EMCNendomucin (219436_s_at), score: 0.68
EML1echinoderm microtubule associated protein like 1 (204797_s_at), score: -0.68
EREGepiregulin (205767_at), score: -0.55
EVI2Becotropic viral integration site 2B (211742_s_at), score: 0.66
FAM29Afamily with sequence similarity 29, member A (218602_s_at), score: -0.55
FAM86Cfamily with sequence similarity 86, member C (220353_at), score: 0.62
FBXO31F-box protein 31 (219785_s_at), score: 0.6
FZD4frizzled homolog 4 (Drosophila) (218665_at), score: 0.7
GAAglucosidase, alpha; acid (202812_at), score: -0.59
GKglycerol kinase (207387_s_at), score: -0.57
GPM6Bglycoprotein M6B (209170_s_at), score: -0.75
GPR177G protein-coupled receptor 177 (221958_s_at), score: -0.63
GPRASP1G protein-coupled receptor associated sorting protein 1 (204793_at), score: 0.78
HGFhepatocyte growth factor (hepapoietin A; scatter factor) (209960_at), score: -0.65
HSPB2heat shock 27kDa protein 2 (205824_at), score: 0.64
IGF2insulin-like growth factor 2 (somatomedin A) (202409_at), score: -0.57
IL13RA2interleukin 13 receptor, alpha 2 (206172_at), score: -0.64
IL33interleukin 33 (209821_at), score: -0.87
KAL1Kallmann syndrome 1 sequence (205206_at), score: -0.63
KCNE4potassium voltage-gated channel, Isk-related family, member 4 (222379_at), score: 0.65
KRT33Akeratin 33A (208483_x_at), score: -0.66
LMAN2Llectin, mannose-binding 2-like (221274_s_at), score: 0.68
LOC388152hypothetical LOC388152 (220602_s_at), score: 0.64
MLPHmelanophilin (218211_s_at), score: 0.68
MSTP9macrophage stimulating, pseudogene 9 (213382_at), score: -0.6
NAGPAN-acetylglucosamine-1-phosphodiester alpha-N-acetylglucosaminidase (205090_s_at), score: 0.62
NEFLneurofilament, light polypeptide (221805_at), score: -0.76
NFATC2IPnuclear factor of activated T-cells, cytoplasmic, calcineurin-dependent 2 interacting protein (217526_at), score: -0.66
NOL8nucleolar protein 8 (218244_at), score: 0.63
OLFML2Aolfactomedin-like 2A (213075_at), score: -0.64
PAFAH1B3platelet-activating factor acetylhydrolase, isoform Ib, gamma subunit 29kDa (203228_at), score: 0.6
PKIAprotein kinase (cAMP-dependent, catalytic) inhibitor alpha (204612_at), score: -0.64
PMAIP1phorbol-12-myristate-13-acetate-induced protein 1 (204286_s_at), score: -0.71
PNRC2proline-rich nuclear receptor coactivator 2 (217779_s_at), score: -0.67
PRKG2protein kinase, cGMP-dependent, type II (207505_at), score: -0.66
PRSS1protease, serine, 1 (trypsin 1) (216470_x_at), score: -0.66
PRSS2protease, serine, 2 (trypsin 2) (205402_x_at), score: -0.61
PRSS3protease, serine, 3 (207463_x_at), score: -0.78
PTGS1prostaglandin-endoperoxide synthase 1 (prostaglandin G/H synthase and cyclooxygenase) (215813_s_at), score: -0.58
RAB8BRAB8B, member RAS oncogene family (219210_s_at), score: 0.66
RASA2RAS p21 protein activator 2 (206636_at), score: -0.54
RASSF2Ras association (RalGDS/AF-6) domain family member 2 (203185_at), score: -0.56
RBM3RNA binding motif (RNP1, RRM) protein 3 (208319_s_at), score: -0.76
RBM4BRNA binding motif protein 4B (209497_s_at), score: 0.67
RP2retinitis pigmentosa 2 (X-linked recessive) (205191_at), score: -0.57
RPL23ribosomal protein L23 (214744_s_at), score: -0.55
SAT1spermidine/spermine N1-acetyltransferase 1 (213988_s_at), score: -0.62
SEMA3Csema domain, immunoglobulin domain (Ig), short basic domain, secreted, (semaphorin) 3C (203788_s_at), score: -0.67
SETMARSET domain and mariner transposase fusion gene (206554_x_at), score: 0.68
SLC16A5solute carrier family 16, member 5 (monocarboxylic acid transporter 6) (206600_s_at), score: 0.73
SLC16A6solute carrier family 16, member 6 (monocarboxylic acid transporter 7) (207038_at), score: -0.55
SLC38A4solute carrier family 38, member 4 (220786_s_at), score: 0.9
SYNMsynemin, intermediate filament protein (212730_at), score: 0.67
SYT11synaptotagmin XI (209198_s_at), score: 0.7
TFDP2transcription factor Dp-2 (E2F dimerization partner 2) (203588_s_at), score: 0.7
TMSB15Athymosin beta 15a (205347_s_at), score: 0.76
TPK1thiamin pyrophosphokinase 1 (221218_s_at), score: -0.69
TRIAP1TP53 regulated inhibitor of apoptosis 1 (218403_at), score: 0.62
TRIB2tribbles homolog 2 (Drosophila) (202478_at), score: 0.65
UCP2uncoupling protein 2 (mitochondrial, proton carrier) (208998_at), score: 1
VWA5Avon Willebrand factor A domain containing 5A (210102_at), score: 0.63
XPO4exportin 4 (218479_s_at), score: 0.65
ZNF219zinc finger protein 219 (219314_s_at), score: -0.59
Non-Entrez genes
Unknown, score:
HELP
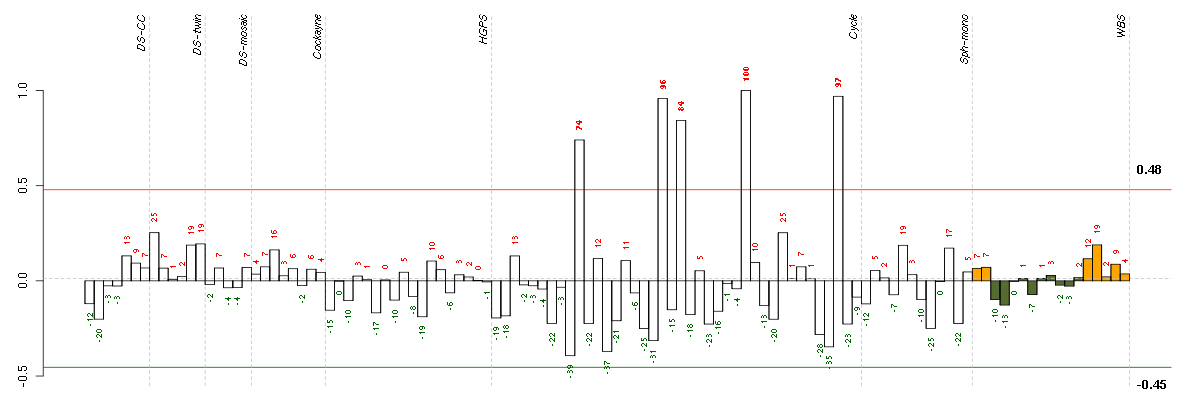
Conditions in the module, given in the same order as on the expression
plot above. Red color means over-expression, green under-expression in
the given condition.
The barplot below shows the condition (sample) scores. A separate bar
is shown for each sample, its height is the corresponding score of the
sample in the module. The red and green numbers on the bars are the
sample scores expressed in percents, i.e. 100% is 1.0.
The red and green lines show the module thresholds, samples above
the red line and below the green line are included in the module.
The different experiments that were part of the study, are separated
by dashed vertical lines.
— Click on the Help button again to close this help window.
| Id | sample | Experiment | ExpName | Array | Syndrome | Cell.line |
| E-TABM-263-raw-cel-1515485831.cel | 10 | 6 | Cycle | hgu133a2 | none | Cycle 1 |
| E-TABM-263-raw-cel-1515486051.cel | 21 | 6 | Cycle | hgu133a2 | none | Cycle 1 |
| E-TABM-263-raw-cel-1515486011.cel | 19 | 6 | Cycle | hgu133a2 | none | Cycle 1 |
| E-TABM-263-raw-cel-1515486391.cel | 38 | 6 | Cycle | hgu133a2 | none | Cycle 1 |
| E-TABM-263-raw-cel-1515486191.cel | 28 | 6 | Cycle | hgu133a2 | none | Cycle 1 |


© 2008-2010 Computational Biology Group, Department of Medical Genetics,
University of Lausanne, Switzerland