Previous module |
Next module
Module #620, TG: 2.8, TC: 2, 113 probes, 113 Entrez genes, 4 conditions


HELP
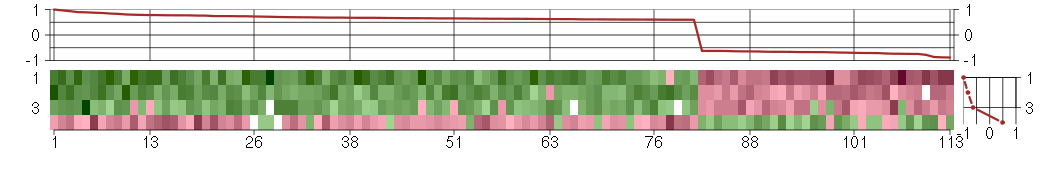
The image plot shows the color-coded level of gene expression, for the
genes and conditions in a given transcription module. The genes are on
the horizontal, the conditions on the vertical axis.
The genes are ordered according to their ISA gene scores, similarly
the conditions are ordered according to their condition scores. The
score of a gene means the «degree of inclusion» in
the module: a high score gene is essential in the module.
Condition scores can also be negative, that means that the genes of
the module are all down-regulated in the condition. Here the absolute
value of the score gives the «degree of inclusion».
The plots above and beside the expression matrix show the gene scores
and condition scores, respectively.
Note that the plot is interactive, you can see the name of the gene
and condition under the mouse cursor.
The expression matrix was normalized to have mean zero and standard
deviation one for every gene separately across all conditions
(i.e. not just for the conditions in the module).
— Click on the Help button again to close this help window.

Under-expression is coded with green,
over-expression with red color.
Help |
Hide |
Top
Help |
Show |
Top
The GO tree — Biological processes
HELP
This is one of three sections showing Gene Ontology enrichment of the
current module: in this case for biological processes.
The graph shows the hierarchy of the GO categories, their enrichment
for the current module is color coded, and the blue number beside the
category is the minus log ten p-value of the enrichment. (Calculated
using the standard hypergeometric test.) The color of the arrows code
«is a» (cyan) and «part of» relationships.
The tree was built the following way. First all GO terms with more
significant enrichment p-value than 0.05 were collected. Then all
paths from these terms to the root node of the GO tree were included
too. If a GO term is included more than once in the tree, then the
green numbers show 1) the id of the node, this makes it easier to find
other appereances of the term, and 2) the number of appearences.
Note that the same GO category might show up on the graph many
times. This is because the GO was «straightened» for this
graph, i.e. if there are more paths from a GO term to the root node of
the tree, all of them are included. The green numbers
Move the mouse cursor over the terms to get their definition. Clicking
on them takes you to the corresponding Gene Ontology web page.
If you cannot see a graph here at all, that means that there were no
significantly enriched GO categories, at the 0.05 level.
— Click on the Help button again to close this help window.

immune system process
Any process involved in the development or functioning of the immune system, an organismal system for calibrated responses to potential internal or invasive threats.
immune response
Any immune system process that functions in the calibrated response of an organism to a potential internal or invasive threat.
biological_process
Any process specifically pertinent to the functioning of integrated living units: cells, tissues, organs, and organisms. A process is a collection of molecular events with a defined beginning and end.
response to stimulus
A change in state or activity of a cell or an organism (in terms of movement, secretion, enzyme production, gene expression, etc.) as a result of a stimulus.
all
This term is the most general term possible
immune response
Any immune system process that functions in the calibrated response of an organism to a potential internal or invasive threat.
Help |
Hide |
Top
Help |
Show |
Top
The GO tree — Cellular Components
HELP
This is one of three sections showing Gene Ontology enrichment of the
current module: in this case for cellular components.
The graph shows the hierarchy of the GO categories, their enrichment
for the current module is color coded, and the blue number beside the
category is the minus log ten p-value of the enrichment. (Calculated
using the standard hypergeometric test.) The color of the arrows code
«is a» (cyan) and «part of» relationships.
The tree was built the following way. First all GO terms with more
significant enrichment p-value than 0.05 were collected. Then all
paths from these terms to the root node of the GO tree were included
too. If a GO term is included more than once in the tree, then the
green numbers show 1) the id of the node, this makes it easier to find
other appereances of the term, and 2) the number of appearences.
Note that the same GO category might show up on the graph many
times. This is because the GO was «straightened» for this
graph, i.e. if there are more paths from a GO term to the root node of
the tree, all of them are included. The green numbers
Move the mouse cursor over the terms to get their definition. Clicking
on them takes you to the corresponding Gene Ontology web page.
If you cannot see a graph here at all, that means that there were no
significantly enriched GO categories, at the 0.05 level.
— Click on the Help button again to close this help window.
extracellular region
The space external to the outermost structure of a cell. For cells without external protective or external encapsulating structures this refers to space outside of the plasma membrane. This term covers the host cell environment outside an intracellular parasite.
cellular_component
The part of a cell or its extracellular environment in which a gene product is located. A gene product may be located in one or more parts of a cell and its location may be as specific as a particular macromolecular complex, that is, a stable, persistent association of macromolecules that function together.
all
This term is the most general term possible
Help |
Hide |
Top
Help |
Show |
Top
The GO tree — Molecular Function
HELP
This is one of three sections showing Gene Ontology enrichment of the
current module: in this case for molecular function.
The graph shows the hierarchy of the GO categories, their enrichment
for the current module is color coded, and the blue number beside the
category is the minus log ten p-value of the enrichment. (Calculated
using the standard hypergeometric test.) The color of the arrows code
«is a» (cyan) and «part of» relationships.
The tree was built the following way. First all GO terms with more
significant enrichment p-value than 0.05 were collected. Then all
paths from these terms to the root node of the GO tree were included
too. If a GO term is included more than once in the tree, then the
green numbers show 1) the id of the node, this makes it easier to find
other appereances of the term, and 2) the number of appearences.
Note that the same GO category might show up on the graph many
times. This is because the GO was «straightened» for this
graph, i.e. if there are more paths from a GO term to the root node of
the tree, all of them are included. The green numbers
Move the mouse cursor over the terms to get their definition. Clicking
on them takes you to the corresponding Gene Ontology web page.
If you cannot see a graph here at all, that means that there were no
significantly enriched GO categories, at the 0.05 level.
— Click on the Help button again to close this help window.
Help |
Hide |
Top
Help |
Show |
Top
GO BP test for over-representation
HELP
List of all enriched GO categories (biological processes), at the 0.05
p-value level.
The columns:
- ExpCount is the expected count of genes in the
module annotated with the given GO term, just by chance.
- Count
is the number of genes in the module annotated with the given GO
term.
- Size is the total number of genes (in our universe)
annotated with the GO term.
Clicking on Count shows the genes that drive the
enrichment. You can also click on the individual numbers in
the Count column, to show the driving genes for that individual
GO category.
Clicking on the GO identifiers takes you to the Gene Ontology web
pages.
— Click on the Help button again to close this help window.
| Id | Pvalue | ExpCount | Count | Size | Term |
| GO:0006955 | 7.722e-03 | 3.235 | 12
ABCC9, CD70, DMBT1, EDA, FCER1G, HAMP, IL12B, ITGAL, LAT2, LILRB3, MASP1, OLR1 | 295 | immune response |
| GO:0006952 | 3.365e-02 | 2.884 | 10
ABCC9, DMBT1, FCER1G, HAMP, IFNA7, IL12B, ITGAL, LILRB3, MASP1, OLR1 | 263 | defense response |
| GO:0002448 | 3.972e-02 | 0.04386 | 2
FCER1G, LAT2 | 4 | mast cell mediated immunity |
| GO:0043303 | 3.972e-02 | 0.04386 | 2
FCER1G, LAT2 | 4 | mast cell degranulation |
| GO:0051707 | 4.768e-02 | 1.14 | 6
ABCC9, DMBT1, FCER1G, HAMP, IFNA7, PKLR | 104 | response to other organism |
Help |
Hide |
Top
Help |
Show |
Top
GO CC test for over-representation
HELP
List of all enriched GO categories (cellular components), at the 0.05
p-value level.
The columns:
- ExpCount is the expected count of genes in the
module annotated with the given GO term, just by chance.
- Count
is the number of genes in the module annotated with the given GO
term.
- Size is the total number of genes (in our universe)
annotated with the GO term.
Clicking on Count shows the genes that drive the
enrichment. You can also click on the individual numbers in
the Count column, to show the driving genes for that individual
GO category.
Clicking on the GO identifiers takes you to the Gene Ontology web
pages.
— Click on the Help button again to close this help window.
| Id | Pvalue | ExpCount | Count | Size | Term |
| GO:0005576 | 3.090e-03 | 7.947 | 20
ADAMTS12, AFP, C2orf72, CD70, DHRS11, DMBT1, DSPP, EDA, F11, F7, FGL1, FLJ21075, FLRT3, HAMP, IFNA7, IL12B, IL9R, MASP1, NDP, OLR1 | 700 | extracellular region |
| GO:0030659 | 2.857e-02 | 0.7947 | 5
AP1G2, COPG2, CSPG5, DMBT1, GP1BA | 70 | cytoplasmic vesicle membrane |
| GO:0005887 | 2.967e-02 | 6.232 | 15
ABCC9, CD70, CSPG5, FCER1G, FLRT3, GP1BA, GPR32, GRM1, IL9R, ITGAL, LILRB3, OLR1, RASGRP3, SLC6A11, SLCO2A1 | 549 | integral to plasma membrane |
| GO:0031226 | 3.188e-02 | 6.289 | 15
ABCC9, CD70, CSPG5, FCER1G, FLRT3, GP1BA, GPR32, GRM1, IL9R, ITGAL, LILRB3, OLR1, RASGRP3, SLC6A11, SLCO2A1 | 554 | intrinsic to plasma membrane |
| GO:0012506 | 3.664e-02 | 0.8514 | 5
AP1G2, COPG2, CSPG5, DMBT1, GP1BA | 75 | vesicle membrane |
| GO:0044459 | 3.733e-02 | 9.933 | 20
ABCC9, CD70, CSPG5, FCER1G, FLRT3, GP1BA, GPR32, GRM1, IL9R, ITGAL, LILRB3, LRP2, OLR1, PCDH24, PXN, RASGRP3, SLC6A11, SLCO2A1, SNTG1, SORBS1 | 875 | plasma membrane part |
| GO:0030660 | 4.705e-02 | 0.2611 | 3
AP1G2, COPG2, CSPG5 | 23 | Golgi-associated vesicle membrane |
Help |
Hide |
Top
Help |
Show |
Top
GO MF test for over-representation
HELP
List of all enriched GO categories (molecular function), at the 0.05
p-value level.
The columns:
- ExpCount is the expected count of genes in the
module annotated with the given GO term, just by chance.
- Count
is the number of genes in the module annotated with the given GO
term.
- Size is the total number of genes (in our universe)
annotated with the GO term.
Clicking on Count shows the genes that drive the
enrichment. You can also click on the individual numbers in
the Count column, to show the driving genes for that individual
GO category.
Clicking on the GO identifiers takes you to the Gene Ontology web
pages.
— Click on the Help button again to close this help window.
Help |
Hide |
Top
Help |
Show |
Top
KEGG Pathway test for over-representation
HELP
List of all enriched KEGG pathways, at the 0.05
p-value level.
The columns:
- ExpCount is the expected count of genes in the
module annotated with the given KEGG pathway, just by chance.
- Count
is the number of genes in the module annotated with the given KEGG
pathway.
- Size is the total number of genes (in our universe)
annotated with the KEGG pathway.
Clicking on Count shows the genes that drive the
enrichment. You can also click on the individual numbers in
the Count column, to show the driving genes for that individual
KEGG pathway.
Clicking on the KEGG identifiers takes you to the KEGG web site.
— Click on the Help button again to close this help window.
Help |
Hide |
Top
Help |
Show |
Top
miRNA test for over-representation
HELP
List of all enriched miRNA families, at the 0.05
p-value level.
The columns:
- ExpCount is the expected count of genes in the
module regulated by the given miRNA family, just by chance.
- Count
is the number of genes in the module regulated by the given miRNA
family.
- Size is the total number of genes (in our universe)
regulated with the given miRNA family.
Clicking on Count shows the genes that drive the
enrichment. You can also click on the individual numbers in
the Count column, to show the driving genes for that individual
miRNA family.
The miRNA regulation data was taken from the TargetScan database.
(Only the conserved sites were used for the current analysis.)
Clicking on the miRNA names takes you to the TargetScan web site.
— Click on the Help button again to close this help window.
Help |
Hide |
Top
Help |
Show |
Top
Chromosome test for over-representation
HELP
List of all enriched Chromosomes, at the 0.05
p-value level.
The columns:
- ExpCount is the expected number of genes in the
module on the given chromosome, just by chance.
- Count
is the number of genes in the module on the given chromosome.
- Size is the total number of genes (in our universe)
on the given chromosome.
Clicking on Count shows the genes that drive the
enrichment. You can also click on the individual numbers in
the Count column, to show the driving genes for that individual
chromosome.
— Click on the Help button again to close this help window.
HELP
A list of all genes in the current module, in alphabetical order. The
size of the text corresponds to the gene scores.
Note that some gene symbols may show up more than once, if many
probes match the same Entrez gene.
Genes with no Entrez mapping are given separately, with their
Affymetrics probe ID.
— Click on the Help button again to close this help window.
Entrez genes
ABCC9ATP-binding cassette, sub-family C (CFTR/MRP), member 9 (208561_at), score: -0.66
ADAMTS12ADAM metallopeptidase with thrombospondin type 1 motif, 12 (221421_s_at), score: 0.62
AFPalpha-fetoprotein (204694_at), score: -0.7
ALPPL2alkaline phosphatase, placental-like 2 (216377_x_at), score: 0.94
ANXA8L2annexin A8-like 2 (203074_at), score: 0.6
AP1G2adaptor-related protein complex 1, gamma 2 subunit (201613_s_at), score: 0.77
ATMataxia telangiectasia mutated (210858_x_at), score: 0.74
ATP6V1G2ATPase, H+ transporting, lysosomal 13kDa, V1 subunit G2 (214762_at), score: 0.77
BAT2LHLA-B associated transcript 2-like (212068_s_at), score: -0.86
C19orf28chromosome 19 open reading frame 28 (220178_at), score: 0.62
C19orf40chromosome 19 open reading frame 40 (214816_x_at), score: 0.6
C19orf61chromosome 19 open reading frame 61 (221335_x_at), score: -0.64
C2orf37chromosome 2 open reading frame 37 (220172_at), score: -0.69
C2orf72chromosome 2 open reading frame 72 (213143_at), score: 0.78
C6orf155chromosome 6 open reading frame 155 (220324_at), score: -0.64
C7orf58chromosome 7 open reading frame 58 (220032_at), score: -0.67
CCDC33coiled-coil domain containing 33 (220908_at), score: 0.64
CCDC40coiled-coil domain containing 40 (220592_at), score: 0.74
CD70CD70 molecule (206508_at), score: 0.76
COPG2coatomer protein complex, subunit gamma 2 (213486_at), score: 0.62
CPNE3copine III (202118_s_at), score: -0.62
CSPG5chondroitin sulfate proteoglycan 5 (neuroglycan C) (39966_at), score: 0.6
CTNScystinosis, nephropathic (36566_at), score: 0.69
DHRS11dehydrogenase/reductase (SDR family) member 11 (218756_s_at), score: -0.66
DMBT1deleted in malignant brain tumors 1 (208250_s_at), score: 0.68
DNAJC2DnaJ (Hsp40) homolog, subfamily C, member 2 (213097_s_at), score: 0.69
DOK4docking protein 4 (209691_s_at), score: -0.74
DSCR6Down syndrome critical region gene 6 (207267_s_at), score: -0.66
DSPPdentin sialophosphoprotein (221681_s_at), score: 0.79
EDAectodysplasin A (211130_x_at), score: 0.68
EPM2Aepilepsy, progressive myoclonus type 2A, Lafora disease (laforin) (205231_s_at), score: 0.66
ERCC6excision repair cross-complementing rodent repair deficiency, complementation group 6 (207347_at), score: -0.73
F11coagulation factor XI (206610_s_at), score: 0.81
F7coagulation factor VII (serum prothrombin conversion accelerator) (207300_s_at), score: 0.6
FAM105Afamily with sequence similarity 105, member A (219694_at), score: -0.66
FBXO11F-box protein 11 (203255_at), score: 0.61
FCER1GFc fragment of IgE, high affinity I, receptor for; gamma polypeptide (204232_at), score: 0.65
FGL1fibrinogen-like 1 (205305_at), score: 0.67
FLJ21075hypothetical protein FLJ21075 (221172_at), score: 0.69
FLRT3fibronectin leucine rich transmembrane protein 3 (219250_s_at), score: -0.88
GABARAPL1GABA(A) receptor-associated protein like 1 (208868_s_at), score: 0.66
GABARAPL3GABA(A) receptors associated protein like 3 (pseudogene) (211458_s_at), score: 0.66
GANgigaxonin (220124_at), score: -0.67
GCHFRGTP cyclohydrolase I feedback regulator (204867_at), score: 0.73
GNL3LPguanine nucleotide binding protein-like 3 (nucleolar)-like pseudogene (220716_at), score: 0.7
GP1BAglycoprotein Ib (platelet), alpha polypeptide (207389_at), score: 0.88
GPR144G protein-coupled receptor 144 (216289_at), score: 1
GPR32G protein-coupled receptor 32 (221469_at), score: 0.72
GRM1glutamate receptor, metabotropic 1 (210939_s_at), score: 0.84
GSTM5glutathione S-transferase mu 5 (205752_s_at), score: 0.61
HAB1B1 for mucin (215778_x_at), score: 0.74
HAMPhepcidin antimicrobial peptide (220491_at), score: 0.83
HAND1heart and neural crest derivatives expressed 1 (220138_at), score: 0.9
IDI2isopentenyl-diphosphate delta isomerase 2 (217631_at), score: 0.65
IFNA7interferon, alpha 7 (208259_x_at), score: 0.66
IFT140intraflagellar transport 140 homolog (Chlamydomonas) (204792_s_at), score: 0.73
IKZF5IKAROS family zinc finger 5 (Pegasus) (220086_at), score: -0.64
IL12Binterleukin 12B (natural killer cell stimulatory factor 2, cytotoxic lymphocyte maturation factor 2, p40) (207901_at), score: -0.73
IL9Rinterleukin 9 receptor (214950_at), score: 0.89
ITGALintegrin, alpha L (antigen CD11A (p180), lymphocyte function-associated antigen 1; alpha polypeptide) (213475_s_at), score: 0.67
KIF26Bkinesin family member 26B (220002_at), score: 0.61
LAT2linker for activation of T cells family, member 2 (211768_at), score: 0.65
LEPREL2leprecan-like 2 (204854_at), score: -0.63
LILRB3leukocyte immunoglobulin-like receptor, subfamily B (with TM and ITIM domains), member 3 (211133_x_at), score: 0.68
LOC100129500hypothetical protein LOC100129500 (212884_x_at), score: 0.64
LOC149478hypothetical protein LOC149478 (215462_at), score: 0.61
LOC149501similar to keratin 8 (216821_at), score: 0.6
LRP2low density lipoprotein-related protein 2 (205710_at), score: -0.88
MAFGv-maf musculoaponeurotic fibrosarcoma oncogene homolog G (avian) (204970_s_at), score: 0.61
MAPK10mitogen-activated protein kinase 10 (204813_at), score: 0.62
MASP1mannan-binding lectin serine peptidase 1 (C4/C2 activating component of Ra-reactive factor) (213749_at), score: 0.6
MEF2Bmyocyte enhancer factor 2B (209926_at), score: 0.64
MEF2Cmyocyte enhancer factor 2C (209199_s_at), score: -0.69
MEG3maternally expressed 3 (non-protein coding) (210794_s_at), score: 0.7
MEOX1mesenchyme homeobox 1 (205619_s_at), score: 0.63
MOCS1molybdenum cofactor synthesis 1 (211673_s_at), score: 0.77
MRPS6mitochondrial ribosomal protein S6 (213167_s_at), score: -0.65
MTMR8myotubularin related protein 8 (220537_at), score: -0.71
NDPNorrie disease (pseudoglioma) (206022_at), score: -0.78
NOL10nucleolar protein 10 (218591_s_at), score: 0.63
NOVA2neuro-oncological ventral antigen 2 (206477_s_at), score: 0.68
OLR1oxidized low density lipoprotein (lectin-like) receptor 1 (210004_at), score: 0.74
PCDH24protocadherin 24 (220186_s_at), score: 0.67
PDE5Aphosphodiesterase 5A, cGMP-specific (206757_at), score: -0.67
PEG3paternally expressed 3 (209242_at), score: 0.61
PHF7PHD finger protein 7 (215622_x_at), score: 0.68
PKLRpyruvate kinase, liver and RBC (222078_at), score: 0.65
PNMAL1PNMA-like 1 (218824_at), score: -0.71
PPP1R13Bprotein phosphatase 1, regulatory (inhibitor) subunit 13B (216347_s_at), score: 0.86
PTPN6protein tyrosine phosphatase, non-receptor type 6 (206687_s_at), score: 0.66
PXNpaxillin (211823_s_at), score: -0.63
RASGRP3RAS guanyl releasing protein 3 (calcium and DAG-regulated) (205801_s_at), score: -0.74
RNF121ring finger protein 121 (219021_at), score: 0.63
RPL18AP6ribosomal protein L18a pseudogene 6 (216383_at), score: 0.64
RPRD2regulation of nuclear pre-mRNA domain containing 2 (212553_at), score: -0.67
RPS6KA6ribosomal protein S6 kinase, 90kDa, polypeptide 6 (220738_s_at), score: -0.7
SLC1A7solute carrier family 1 (glutamate transporter), member 7 (210923_at), score: 0.77
SLC6A11solute carrier family 6 (neurotransmitter transporter, GABA), member 11 (207048_at), score: 0.97
SLCO2A1solute carrier organic anion transporter family, member 2A1 (204368_at), score: 0.76
SNTG1syntrophin, gamma 1 (220405_at), score: -0.68
SORBS1sorbin and SH3 domain containing 1 (218087_s_at), score: 0.71
SPATA1spermatogenesis associated 1 (221057_at), score: 0.8
TAL1T-cell acute lymphocytic leukemia 1 (206283_s_at), score: 0.72
TMEM121transmembrane protein 121 (219663_s_at), score: 0.63
TOM1L2target of myb1-like 2 (chicken) (214840_at), score: -0.62
TP53TG1TP53 target 1 (non-protein coding) (210241_s_at), score: 0.63
TTLL3tubulin tyrosine ligase-like family, member 3 (210129_s_at), score: 0.67
TULP2tubby like protein 2 (206733_at), score: 0.78
TYMPthymidine phosphorylase (217497_at), score: 0.61
YIPF1Yip1 domain family, member 1 (214733_s_at), score: 0.61
ZNF460zinc finger protein 460 (216279_at), score: -0.74
ZNF587zinc finger protein 587 (219981_x_at), score: 0.61
ZNF652zinc finger protein 652 (205594_at), score: 0.65
Non-Entrez genes
Unknown, score:
HELP
Conditions in the module, given in the same order as on the expression
plot above. Red color means over-expression, green under-expression in
the given condition.
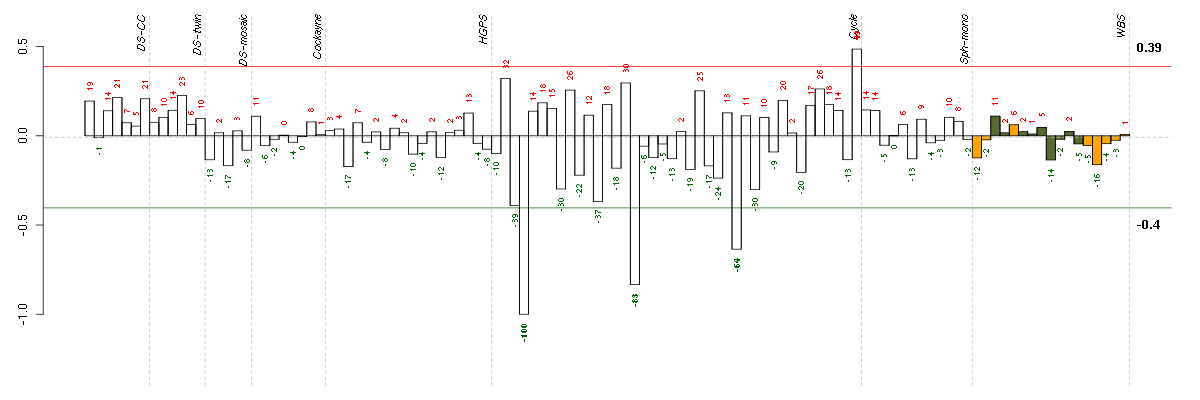
The barplot below shows the condition (sample) scores. A separate bar
is shown for each sample, its height is the corresponding score of the
sample in the module. The red and green numbers on the bars are the
sample scores expressed in percents, i.e. 100% is 1.0.
The red and green lines show the module thresholds, samples above
the red line and below the green line are included in the module.
The different experiments that were part of the study, are separated
by dashed vertical lines.
— Click on the Help button again to close this help window.
| Id | sample | Experiment | ExpName | Array | Syndrome | Cell.line |
| E-TABM-263-raw-cel-1515485711.cel | 4 | 6 | Cycle | hgu133a2 | none | Cycle 1 |
| E-TABM-263-raw-cel-1515485951.cel | 16 | 6 | Cycle | hgu133a2 | none | Cycle 1 |
| E-TABM-263-raw-cel-1515486171.cel | 27 | 6 | Cycle | hgu133a2 | none | Cycle 1 |
| E-TABM-263-raw-cel-1515486431.cel | 40 | 6 | Cycle | hgu133a2 | none | Cycle 1 |


© 2008-2010 Computational Biology Group, Department of Medical Genetics,
University of Lausanne, Switzerland