Previous module |
Next module
Module #646, TG: 2.8, TC: 1.8, 92 probes, 92 Entrez genes, 7 conditions


HELP
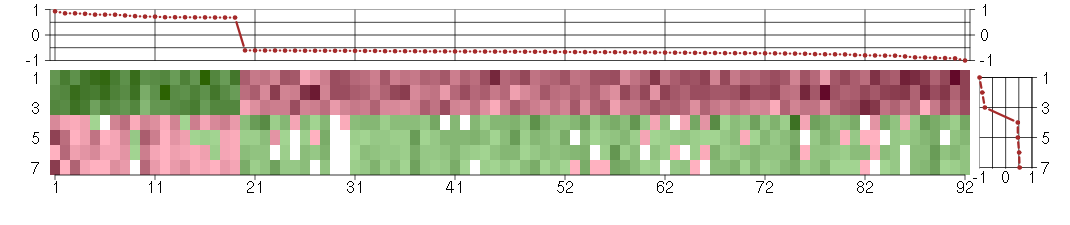
The image plot shows the color-coded level of gene expression, for the
genes and conditions in a given transcription module. The genes are on
the horizontal, the conditions on the vertical axis.
The genes are ordered according to their ISA gene scores, similarly
the conditions are ordered according to their condition scores. The
score of a gene means the «degree of inclusion» in
the module: a high score gene is essential in the module.
Condition scores can also be negative, that means that the genes of
the module are all down-regulated in the condition. Here the absolute
value of the score gives the «degree of inclusion».
The plots above and beside the expression matrix show the gene scores
and condition scores, respectively.
Note that the plot is interactive, you can see the name of the gene
and condition under the mouse cursor.
The expression matrix was normalized to have mean zero and standard
deviation one for every gene separately across all conditions
(i.e. not just for the conditions in the module).
— Click on the Help button again to close this help window.

Under-expression is coded with green,
over-expression with red color.
Help |
Hide |
Top
Help |
Show |
Top
The GO tree — Biological processes
HELP
This is one of three sections showing Gene Ontology enrichment of the
current module: in this case for biological processes.
The graph shows the hierarchy of the GO categories, their enrichment
for the current module is color coded, and the blue number beside the
category is the minus log ten p-value of the enrichment. (Calculated
using the standard hypergeometric test.) The color of the arrows code
«is a» (cyan) and «part of» relationships.
The tree was built the following way. First all GO terms with more
significant enrichment p-value than 0.05 were collected. Then all
paths from these terms to the root node of the GO tree were included
too. If a GO term is included more than once in the tree, then the
green numbers show 1) the id of the node, this makes it easier to find
other appereances of the term, and 2) the number of appearences.
Note that the same GO category might show up on the graph many
times. This is because the GO was «straightened» for this
graph, i.e. if there are more paths from a GO term to the root node of
the tree, all of them are included. The green numbers
Move the mouse cursor over the terms to get their definition. Clicking
on them takes you to the corresponding Gene Ontology web page.
If you cannot see a graph here at all, that means that there were no
significantly enriched GO categories, at the 0.05 level.
— Click on the Help button again to close this help window.

immune system process
Any process involved in the development or functioning of the immune system, an organismal system for calibrated responses to potential internal or invasive threats.
immune response
Any immune system process that functions in the calibrated response of an organism to a potential internal or invasive threat.
biological_process
Any process specifically pertinent to the functioning of integrated living units: cells, tissues, organs, and organisms. A process is a collection of molecular events with a defined beginning and end.
antigen processing and presentation
The process by which an antigen-presenting cell expresses antigen (peptide or lipid) on its cell surface in association with an MHC protein complex.
response to stimulus
A change in state or activity of a cell or an organism (in terms of movement, secretion, enzyme production, gene expression, etc.) as a result of a stimulus.
all
This term is the most general term possible
immune response
Any immune system process that functions in the calibrated response of an organism to a potential internal or invasive threat.
Help |
Hide |
Top
Help |
Show |
Top
The GO tree — Cellular Components
HELP
This is one of three sections showing Gene Ontology enrichment of the
current module: in this case for cellular components.
The graph shows the hierarchy of the GO categories, their enrichment
for the current module is color coded, and the blue number beside the
category is the minus log ten p-value of the enrichment. (Calculated
using the standard hypergeometric test.) The color of the arrows code
«is a» (cyan) and «part of» relationships.
The tree was built the following way. First all GO terms with more
significant enrichment p-value than 0.05 were collected. Then all
paths from these terms to the root node of the GO tree were included
too. If a GO term is included more than once in the tree, then the
green numbers show 1) the id of the node, this makes it easier to find
other appereances of the term, and 2) the number of appearences.
Note that the same GO category might show up on the graph many
times. This is because the GO was «straightened» for this
graph, i.e. if there are more paths from a GO term to the root node of
the tree, all of them are included. The green numbers
Move the mouse cursor over the terms to get their definition. Clicking
on them takes you to the corresponding Gene Ontology web page.
If you cannot see a graph here at all, that means that there were no
significantly enriched GO categories, at the 0.05 level.
— Click on the Help button again to close this help window.
Help |
Hide |
Top
Help |
Show |
Top
The GO tree — Molecular Function
HELP
This is one of three sections showing Gene Ontology enrichment of the
current module: in this case for molecular function.
The graph shows the hierarchy of the GO categories, their enrichment
for the current module is color coded, and the blue number beside the
category is the minus log ten p-value of the enrichment. (Calculated
using the standard hypergeometric test.) The color of the arrows code
«is a» (cyan) and «part of» relationships.
The tree was built the following way. First all GO terms with more
significant enrichment p-value than 0.05 were collected. Then all
paths from these terms to the root node of the GO tree were included
too. If a GO term is included more than once in the tree, then the
green numbers show 1) the id of the node, this makes it easier to find
other appereances of the term, and 2) the number of appearences.
Note that the same GO category might show up on the graph many
times. This is because the GO was «straightened» for this
graph, i.e. if there are more paths from a GO term to the root node of
the tree, all of them are included. The green numbers
Move the mouse cursor over the terms to get their definition. Clicking
on them takes you to the corresponding Gene Ontology web page.
If you cannot see a graph here at all, that means that there were no
significantly enriched GO categories, at the 0.05 level.
— Click on the Help button again to close this help window.
protein binding
Interacting selectively with any protein or protein complex (a complex of two or more proteins that may include other nonprotein molecules).
molecular_function
Elemental activities, such as catalysis or binding, describing the actions of a gene product at the molecular level. A given gene product may exhibit one or more molecular functions.
binding
The selective, often stoichiometric, interaction of a molecule with one or more specific sites on another molecule.
cytokine binding
Interacting selectively with a cytokine, any of a group of proteins that function to control the survival, growth and differentiation of tissues and cells, and which have autocrine and paracrine activity.
all
This term is the most general term possible
Help |
Hide |
Top
Help |
Show |
Top
GO BP test for over-representation
HELP
List of all enriched GO categories (biological processes), at the 0.05
p-value level.
The columns:
- ExpCount is the expected count of genes in the
module annotated with the given GO term, just by chance.
- Count
is the number of genes in the module annotated with the given GO
term.
- Size is the total number of genes (in our universe)
annotated with the GO term.
Clicking on Count shows the genes that drive the
enrichment. You can also click on the individual numbers in
the Count column, to show the driving genes for that individual
GO category.
Clicking on the GO identifiers takes you to the Gene Ontology web
pages.
— Click on the Help button again to close this help window.
| Id | Pvalue | ExpCount | Count | Size | Term |
| GO:0006955 | 3.607e-03 | 2.952 | 12
CCRL1, CTSC, ERAP1, GBP2, HLA-E, IL27RA, IL6R, MR1, PSMB8, PSMB9, RELB, TAP1 | 295 | immune response |
| GO:0019882 | 4.843e-03 | 0.4002 | 5
ERAP1, HLA-E, MR1, PSMB8, RELB | 40 | antigen processing and presentation |
| GO:0001525 | 3.439e-02 | 1.041 | 6
ERAP1, FGF9, ID1, KLF5, LEPR, TNFAIP2 | 104 | angiogenesis |
| GO:0002474 | 3.534e-02 | 0.1701 | 3
ERAP1, HLA-E, MR1 | 17 | antigen processing and presentation of peptide antigen via MHC class I |
| GO:0002376 | 4.169e-02 | 4.753 | 13
CCRL1, CTSC, ERAP1, GBP2, HLA-E, IGBP1, IL27RA, IL6R, MR1, PSMB8, PSMB9, RELB, TAP1 | 475 | immune system process |
Help |
Hide |
Top
Help |
Show |
Top
GO CC test for over-representation
HELP
List of all enriched GO categories (cellular components), at the 0.05
p-value level.
The columns:
- ExpCount is the expected count of genes in the
module annotated with the given GO term, just by chance.
- Count
is the number of genes in the module annotated with the given GO
term.
- Size is the total number of genes (in our universe)
annotated with the GO term.
Clicking on Count shows the genes that drive the
enrichment. You can also click on the individual numbers in
the Count column, to show the driving genes for that individual
GO category.
Clicking on the GO identifiers takes you to the Gene Ontology web
pages.
— Click on the Help button again to close this help window.
| Id | Pvalue | ExpCount | Count | Size | Term |
| GO:0042825 | 1.807e-02 | 0.04238 | 2
PSMB8, TAP1 | 4 | TAP complex |
| GO:0031224 | 2.764e-02 | 21.73 | 35
ABHD14A, AKAP6, B3GNT1, BTN3A1, BTN3A2, BTN3A3, C1orf115, C9orf127, CCRL1, CHST7, DNAJC4, ERAP1, EVI2A, GDPD5, GFRA1, GLRB, GOLSYN, HLA-E, IFITM1, IL27RA, IL6R, ITM2B, KCTD15, LEPR, LHFP, MEGF9, MR1, NRCAM, SLC46A3, SLC6A9, SSPN, TAP1, TNFRSF1B, TOMM7, VAMP1 | 2051 | intrinsic to membrane |
| GO:0042824 | 3.782e-02 | 0.06357 | 2
PSMB8, TAP1 | 6 | MHC class I peptide loading complex |
| GO:0016021 | 4.082e-02 | 21.42 | 34
ABHD14A, AKAP6, B3GNT1, BTN3A1, BTN3A2, BTN3A3, C1orf115, C9orf127, CCRL1, CHST7, DNAJC4, ERAP1, EVI2A, GDPD5, GLRB, GOLSYN, HLA-E, IFITM1, IL27RA, IL6R, ITM2B, KCTD15, LEPR, LHFP, MEGF9, MR1, NRCAM, SLC46A3, SLC6A9, SSPN, TAP1, TNFRSF1B, TOMM7, VAMP1 | 2022 | integral to membrane |
Help |
Hide |
Top
Help |
Show |
Top
GO MF test for over-representation
HELP
List of all enriched GO categories (molecular function), at the 0.05
p-value level.
The columns:
- ExpCount is the expected count of genes in the
module annotated with the given GO term, just by chance.
- Count
is the number of genes in the module annotated with the given GO
term.
- Size is the total number of genes (in our universe)
annotated with the GO term.
Clicking on Count shows the genes that drive the
enrichment. You can also click on the individual numbers in
the Count column, to show the driving genes for that individual
GO category.
Clicking on the GO identifiers takes you to the Gene Ontology web
pages.
— Click on the Help button again to close this help window.
| Id | Pvalue | ExpCount | Count | Size | Term |
| GO:0019955 | 2.046e-03 | 0.5072 | 6
CCRL1, GFRA1, IL27RA, IL6R, LEPR, TNFRSF1B | 53 | cytokine binding |
| GO:0004896 | 2.023e-02 | 0.2967 | 4
GFRA1, IL27RA, IL6R, LEPR | 31 | cytokine receptor activity |
Help |
Hide |
Top
Help |
Show |
Top
KEGG Pathway test for over-representation
HELP
List of all enriched KEGG pathways, at the 0.05
p-value level.
The columns:
- ExpCount is the expected count of genes in the
module annotated with the given KEGG pathway, just by chance.
- Count
is the number of genes in the module annotated with the given KEGG
pathway.
- Size is the total number of genes (in our universe)
annotated with the KEGG pathway.
Clicking on Count shows the genes that drive the
enrichment. You can also click on the individual numbers in
the Count column, to show the driving genes for that individual
KEGG pathway.
Clicking on the KEGG identifiers takes you to the KEGG web site.
— Click on the Help button again to close this help window.
Help |
Hide |
Top
Help |
Show |
Top
miRNA test for over-representation
HELP
List of all enriched miRNA families, at the 0.05
p-value level.
The columns:
- ExpCount is the expected count of genes in the
module regulated by the given miRNA family, just by chance.
- Count
is the number of genes in the module regulated by the given miRNA
family.
- Size is the total number of genes (in our universe)
regulated with the given miRNA family.
Clicking on Count shows the genes that drive the
enrichment. You can also click on the individual numbers in
the Count column, to show the driving genes for that individual
miRNA family.
The miRNA regulation data was taken from the TargetScan database.
(Only the conserved sites were used for the current analysis.)
Clicking on the miRNA names takes you to the TargetScan web site.
— Click on the Help button again to close this help window.
Help |
Hide |
Top
Help |
Show |
Top
Chromosome test for over-representation
HELP
List of all enriched Chromosomes, at the 0.05
p-value level.
The columns:
- ExpCount is the expected number of genes in the
module on the given chromosome, just by chance.
- Count
is the number of genes in the module on the given chromosome.
- Size is the total number of genes (in our universe)
on the given chromosome.
Clicking on Count shows the genes that drive the
enrichment. You can also click on the individual numbers in
the Count column, to show the driving genes for that individual
chromosome.
— Click on the Help button again to close this help window.
| Id | Pvalue | ExpCount | Count | Size |
| 13 | 3.964e-03 | 1.684 | 10
C13orf15, CRYL1, F10, FGF9, ITM2B, KLF5, LHFP, P2RY5, SLC46A3, TSC22D1 | 173 |
HELP
A list of all genes in the current module, in alphabetical order. The
size of the text corresponds to the gene scores.
Note that some gene symbols may show up more than once, if many
probes match the same Entrez gene.
Genes with no Entrez mapping are given separately, with their
Affymetrics probe ID.
— Click on the Help button again to close this help window.
Entrez genes
ABHD14Aabhydrolase domain containing 14A (210006_at), score: -0.62
AGBL5ATP/GTP binding protein-like 5 (218480_at), score: -0.76
AKAP6A kinase (PRKA) anchor protein 6 (205359_at), score: -0.71
ALDH6A1aldehyde dehydrogenase 6 family, member A1 (221589_s_at), score: -0.66
ANKRD11ankyrin repeat domain 11 (219437_s_at), score: 0.72
B3GNT1UDP-GlcNAc:betaGal beta-1,3-N-acetylglucosaminyltransferase 1 (203188_at), score: -0.78
BDH23-hydroxybutyrate dehydrogenase, type 2 (218285_s_at), score: -0.62
BTN3A1butyrophilin, subfamily 3, member A1 (209770_at), score: -0.7
BTN3A2butyrophilin, subfamily 3, member A2 (209846_s_at), score: -0.88
BTN3A3butyrophilin, subfamily 3, member A3 (204820_s_at), score: -0.71
C13orf15chromosome 13 open reading frame 15 (218723_s_at), score: -0.64
C1orf115chromosome 1 open reading frame 115 (218546_at), score: 0.85
C4orf30chromosome 4 open reading frame 30 (219717_at), score: -0.7
C7orf58chromosome 7 open reading frame 58 (220032_at), score: -0.69
C9orf127chromosome 9 open reading frame 127 (207839_s_at), score: -0.91
CCND2cyclin D2 (200953_s_at), score: 0.72
CCRL1chemokine (C-C motif) receptor-like 1 (220351_at), score: -0.63
CDC14BCDC14 cell division cycle 14 homolog B (S. cerevisiae) (208022_s_at), score: -0.73
CHST7carbohydrate (N-acetylglucosamine 6-O) sulfotransferase 7 (206756_at), score: -0.65
CRYL1crystallin, lambda 1 (220753_s_at), score: -0.74
CTSCcathepsin C (201487_at), score: -0.64
CTSOcathepsin O (203758_at), score: -0.62
DDIT4DNA-damage-inducible transcript 4 (202887_s_at), score: 0.68
DNAJC4DnaJ (Hsp40) homolog, subfamily C, member 4 (206782_s_at), score: -0.72
DPYSL4dihydropyrimidinase-like 4 (205493_s_at), score: 0.7
EGFL6EGF-like-domain, multiple 6 (219454_at), score: 0.83
ERAP1endoplasmic reticulum aminopeptidase 1 (214012_at), score: -0.67
EVI2Aecotropic viral integration site 2A (204774_at), score: -0.65
F10coagulation factor X (205620_at), score: -0.75
FCHSD2FCH and double SH3 domains 2 (203620_s_at), score: -0.63
FGF9fibroblast growth factor 9 (glia-activating factor) (206404_at), score: 0.7
FLGfilaggrin (215704_at), score: 0.93
GBP2guanylate binding protein 2, interferon-inducible (202748_at), score: -0.66
GDPD5glycerophosphodiester phosphodiesterase domain containing 5 (32502_at), score: -0.81
GFRA1GDNF family receptor alpha 1 (205696_s_at), score: -0.63
GLRBglycine receptor, beta (205280_at), score: -0.72
GOLSYNGolgi-localized protein (218692_at), score: 0.85
GTF2A1Lgeneral transcription factor IIA, 1-like (213413_at), score: -0.65
HLA-Emajor histocompatibility complex, class I, E (200904_at), score: -0.71
HLXH2.0-like homeobox (214438_at), score: -0.66
HOXA7homeobox A7 (206848_at), score: 0.69
HSPB3heat shock 27kDa protein 3 (206375_s_at), score: -0.69
ID1inhibitor of DNA binding 1, dominant negative helix-loop-helix protein (208937_s_at), score: 0.69
IFFO1intermediate filament family orphan 1 (36030_at), score: -0.63
IFI35interferon-induced protein 35 (209417_s_at), score: -0.61
IFITM1interferon induced transmembrane protein 1 (9-27) (214022_s_at), score: -0.73
IGBP1immunoglobulin (CD79A) binding protein 1 (202105_at), score: -0.62
IL27RAinterleukin 27 receptor, alpha (205926_at), score: -0.8
IL6Rinterleukin 6 receptor (205945_at), score: -0.61
ITM2Bintegral membrane protein 2B (217732_s_at), score: -0.71
KAT2BK(lysine) acetyltransferase 2B (203845_at), score: -0.65
KCTD15potassium channel tetramerisation domain containing 15 (218553_s_at), score: 0.8
KLF5Kruppel-like factor 5 (intestinal) (209212_s_at), score: -0.71
LEPRleptin receptor (209894_at), score: -0.76
LEPREL2leprecan-like 2 (204854_at), score: -0.71
LHFPlipoma HMGIC fusion partner (218656_s_at), score: -0.9
LMOD1leiomodin 1 (smooth muscle) (203766_s_at), score: -0.67
MAGI2membrane associated guanylate kinase, WW and PDZ domain containing 2 (209737_at), score: -0.62
MEGF9multiple EGF-like-domains 9 (212830_at), score: -0.66
MR1major histocompatibility complex, class I-related (207565_s_at), score: -0.88
NME3non-metastatic cells 3, protein expressed in (204862_s_at), score: -1
NRCAMneuronal cell adhesion molecule (204105_s_at), score: 0.8
P2RY5purinergic receptor P2Y, G-protein coupled, 5 (218589_at), score: -0.62
PAPPA2pappalysin 2 (213332_at), score: 0.8
PCYOX1Lprenylcysteine oxidase 1 like (218953_s_at), score: -0.69
PRELPproline/arginine-rich end leucine-rich repeat protein (204223_at), score: -0.61
PSMB8proteasome (prosome, macropain) subunit, beta type, 8 (large multifunctional peptidase 7) (209040_s_at), score: -0.68
PSMB9proteasome (prosome, macropain) subunit, beta type, 9 (large multifunctional peptidase 2) (204279_at), score: -0.75
QPCTglutaminyl-peptide cyclotransferase (205174_s_at), score: -0.65
RAGErenal tumor antigen (205130_at), score: -0.62
RALGPS2Ral GEF with PH domain and SH3 binding motif 2 (220338_at), score: 0.77
RELBv-rel reticuloendotheliosis viral oncogene homolog B (205205_at), score: -0.6
RFX5regulatory factor X, 5 (influences HLA class II expression) (202963_at), score: -0.61
SCG5secretogranin V (7B2 protein) (203889_at), score: -0.64
SLC46A3solute carrier family 46, member 3 (214719_at), score: -0.92
SLC6A9solute carrier family 6 (neurotransmitter transporter, glycine), member 9 (207043_s_at), score: 0.69
SPON1spondin 1, extracellular matrix protein (209436_at), score: 0.74
SSPNsarcospan (Kras oncogene-associated gene) (204963_at), score: -0.64
STARD5StAR-related lipid transfer (START) domain containing 5 (213820_s_at), score: -0.84
TAP1transporter 1, ATP-binding cassette, sub-family B (MDR/TAP) (202307_s_at), score: -0.6
TLE1transducin-like enhancer of split 1 (E(sp1) homolog, Drosophila) (203221_at), score: -0.68
TNFAIP2tumor necrosis factor, alpha-induced protein 2 (202510_s_at), score: -0.67
TNFRSF1Btumor necrosis factor receptor superfamily, member 1B (203508_at), score: -0.67
TOMM7translocase of outer mitochondrial membrane 7 homolog (yeast) (201812_s_at), score: -0.67
TRAF3IP2TRAF3 interacting protein 2 (215411_s_at), score: -0.66
TRAPPC6Atrafficking protein particle complex 6A (204985_s_at), score: -0.68
TSC22D1TSC22 domain family, member 1 (215111_s_at), score: -0.65
TUBA3Dtubulin, alpha 3d (216323_x_at), score: 0.68
UBA7ubiquitin-like modifier activating enzyme 7 (203281_s_at), score: -0.81
VAMP1vesicle-associated membrane protein 1 (synaptobrevin 1) (213326_at), score: -0.8
WWC1WW and C2 domain containing 1 (213085_s_at), score: -0.62
ZNF334zinc finger protein 334 (220022_at), score: 0.7
Non-Entrez genes
Unknown, score:
HELP
Conditions in the module, given in the same order as on the expression
plot above. Red color means over-expression, green under-expression in
the given condition.
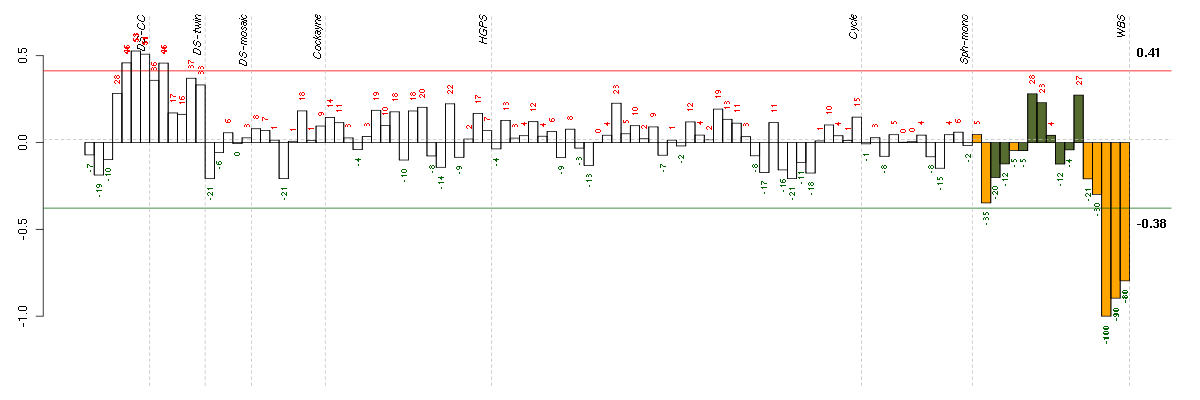
The barplot below shows the condition (sample) scores. A separate bar
is shown for each sample, its height is the corresponding score of the
sample in the module. The red and green numbers on the bars are the
sample scores expressed in percents, i.e. 100% is 1.0.
The red and green lines show the module thresholds, samples above
the red line and below the green line are included in the module.
The different experiments that were part of the study, are separated
by dashed vertical lines.
— Click on the Help button again to close this help window.
| Id | sample | Experiment | ExpName | Array | Syndrome | Cell.line |
| F223_WBS.CEL | 15 | 8 | WBS | hgu133plus2 | WBS | WBS 1 |
| F348_WBS.CEL | 16 | 8 | WBS | hgu133plus2 | WBS | WBS 1 |
| H652_WBS.CEL | 17 | 8 | WBS | hgu133plus2 | WBS | WBS 1 |
| 2Twin.CEL | 2 | 2 | DS-twin | hgu133plus2 | none | DS-twin 2 |
| t21b 08-03.CEL | 5 | 1 | DS-CC | hgu133a | Down | DS-CC 5 |
| t21d 08-03.CEL | 7 | 1 | DS-CC | hgu133a | Down | DS-CC 7 |
| t21c 08-03.CEL | 6 | 1 | DS-CC | hgu133a | Down | DS-CC 6 |


© 2008-2010 Computational Biology Group, Department of Medical Genetics,
University of Lausanne, Switzerland