Previous module |
Next module
Module #647, TG: 2.8, TC: 1.8, 109 probes, 109 Entrez genes, 5 conditions


HELP
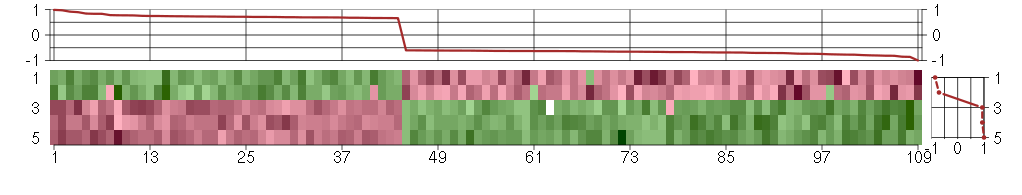
The image plot shows the color-coded level of gene expression, for the
genes and conditions in a given transcription module. The genes are on
the horizontal, the conditions on the vertical axis.
The genes are ordered according to their ISA gene scores, similarly
the conditions are ordered according to their condition scores. The
score of a gene means the «degree of inclusion» in
the module: a high score gene is essential in the module.
Condition scores can also be negative, that means that the genes of
the module are all down-regulated in the condition. Here the absolute
value of the score gives the «degree of inclusion».
The plots above and beside the expression matrix show the gene scores
and condition scores, respectively.
Note that the plot is interactive, you can see the name of the gene
and condition under the mouse cursor.
The expression matrix was normalized to have mean zero and standard
deviation one for every gene separately across all conditions
(i.e. not just for the conditions in the module).
— Click on the Help button again to close this help window.

Under-expression is coded with green,
over-expression with red color.
Help |
Hide |
Top
Help |
Show |
Top
The GO tree — Biological processes
HELP
This is one of three sections showing Gene Ontology enrichment of the
current module: in this case for biological processes.
The graph shows the hierarchy of the GO categories, their enrichment
for the current module is color coded, and the blue number beside the
category is the minus log ten p-value of the enrichment. (Calculated
using the standard hypergeometric test.) The color of the arrows code
«is a» (cyan) and «part of» relationships.
The tree was built the following way. First all GO terms with more
significant enrichment p-value than 0.05 were collected. Then all
paths from these terms to the root node of the GO tree were included
too. If a GO term is included more than once in the tree, then the
green numbers show 1) the id of the node, this makes it easier to find
other appereances of the term, and 2) the number of appearences.
Note that the same GO category might show up on the graph many
times. This is because the GO was «straightened» for this
graph, i.e. if there are more paths from a GO term to the root node of
the tree, all of them are included. The green numbers
Move the mouse cursor over the terms to get their definition. Clicking
on them takes you to the corresponding Gene Ontology web page.
If you cannot see a graph here at all, that means that there were no
significantly enriched GO categories, at the 0.05 level.
— Click on the Help button again to close this help window.

Help |
Hide |
Top
Help |
Show |
Top
The GO tree — Cellular Components
HELP
This is one of three sections showing Gene Ontology enrichment of the
current module: in this case for cellular components.
The graph shows the hierarchy of the GO categories, their enrichment
for the current module is color coded, and the blue number beside the
category is the minus log ten p-value of the enrichment. (Calculated
using the standard hypergeometric test.) The color of the arrows code
«is a» (cyan) and «part of» relationships.
The tree was built the following way. First all GO terms with more
significant enrichment p-value than 0.05 were collected. Then all
paths from these terms to the root node of the GO tree were included
too. If a GO term is included more than once in the tree, then the
green numbers show 1) the id of the node, this makes it easier to find
other appereances of the term, and 2) the number of appearences.
Note that the same GO category might show up on the graph many
times. This is because the GO was «straightened» for this
graph, i.e. if there are more paths from a GO term to the root node of
the tree, all of them are included. The green numbers
Move the mouse cursor over the terms to get their definition. Clicking
on them takes you to the corresponding Gene Ontology web page.
If you cannot see a graph here at all, that means that there were no
significantly enriched GO categories, at the 0.05 level.
— Click on the Help button again to close this help window.
Help |
Hide |
Top
Help |
Show |
Top
The GO tree — Molecular Function
HELP
This is one of three sections showing Gene Ontology enrichment of the
current module: in this case for molecular function.
The graph shows the hierarchy of the GO categories, their enrichment
for the current module is color coded, and the blue number beside the
category is the minus log ten p-value of the enrichment. (Calculated
using the standard hypergeometric test.) The color of the arrows code
«is a» (cyan) and «part of» relationships.
The tree was built the following way. First all GO terms with more
significant enrichment p-value than 0.05 were collected. Then all
paths from these terms to the root node of the GO tree were included
too. If a GO term is included more than once in the tree, then the
green numbers show 1) the id of the node, this makes it easier to find
other appereances of the term, and 2) the number of appearences.
Note that the same GO category might show up on the graph many
times. This is because the GO was «straightened» for this
graph, i.e. if there are more paths from a GO term to the root node of
the tree, all of them are included. The green numbers
Move the mouse cursor over the terms to get their definition. Clicking
on them takes you to the corresponding Gene Ontology web page.
If you cannot see a graph here at all, that means that there were no
significantly enriched GO categories, at the 0.05 level.
— Click on the Help button again to close this help window.
Help |
Hide |
Top
Help |
Show |
Top
GO BP test for over-representation
HELP
List of all enriched GO categories (biological processes), at the 0.05
p-value level.
The columns:
- ExpCount is the expected count of genes in the
module annotated with the given GO term, just by chance.
- Count
is the number of genes in the module annotated with the given GO
term.
- Size is the total number of genes (in our universe)
annotated with the GO term.
Clicking on Count shows the genes that drive the
enrichment. You can also click on the individual numbers in
the Count column, to show the driving genes for that individual
GO category.
Clicking on the GO identifiers takes you to the Gene Ontology web
pages.
— Click on the Help button again to close this help window.
| Id | Pvalue | ExpCount | Count | Size | Term |
| GO:0014826 | 1.138e-02 | 0.02275 | 2
EDN1, EDNRB | 2 | vein smooth muscle contraction |
| GO:0006349 | 2.595e-02 | 0.03413 | 2
DIRAS3, IGF2 | 3 | genetic imprinting |
| GO:0015672 | 4.027e-02 | 1.502 | 7
C16orf7, KCNE4, KCNJ15, KCTD14, SLC20A2, SLC38A4, UCP2 | 132 | monovalent inorganic cation transport |
| GO:0014821 | 4.188e-02 | 0.0455 | 2
EDN1, EDNRB | 4 | phasic smooth muscle contraction |
| GO:0014829 | 4.188e-02 | 0.0455 | 2
EDN1, EDNRB | 4 | vascular smooth muscle contraction |
| GO:0007422 | 4.524e-02 | 0.1934 | 3
EDNRB, EGR2, EGR3 | 17 | peripheral nervous system development |
| GO:0043405 | 4.980e-02 | 0.7736 | 5
DUSP6, EDN1, HGF, SPRY4, TRIB1 | 68 | regulation of MAP kinase activity |
Help |
Hide |
Top
Help |
Show |
Top
GO CC test for over-representation
HELP
List of all enriched GO categories (cellular components), at the 0.05
p-value level.
The columns:
- ExpCount is the expected count of genes in the
module annotated with the given GO term, just by chance.
- Count
is the number of genes in the module annotated with the given GO
term.
- Size is the total number of genes (in our universe)
annotated with the GO term.
Clicking on Count shows the genes that drive the
enrichment. You can also click on the individual numbers in
the Count column, to show the driving genes for that individual
GO category.
Clicking on the GO identifiers takes you to the Gene Ontology web
pages.
— Click on the Help button again to close this help window.
Help |
Hide |
Top
Help |
Show |
Top
GO MF test for over-representation
HELP
List of all enriched GO categories (molecular function), at the 0.05
p-value level.
The columns:
- ExpCount is the expected count of genes in the
module annotated with the given GO term, just by chance.
- Count
is the number of genes in the module annotated with the given GO
term.
- Size is the total number of genes (in our universe)
annotated with the GO term.
Clicking on Count shows the genes that drive the
enrichment. You can also click on the individual numbers in
the Count column, to show the driving genes for that individual
GO category.
Clicking on the GO identifiers takes you to the Gene Ontology web
pages.
— Click on the Help button again to close this help window.
| Id | Pvalue | ExpCount | Count | Size | Term |
| GO:0008083 | 4.680e-02 | 1.07 | 6
CD320, CLCF1, EREG, HGF, IGF2, LIF | 94 | growth factor activity |
Help |
Hide |
Top
Help |
Show |
Top
KEGG Pathway test for over-representation
HELP
List of all enriched KEGG pathways, at the 0.05
p-value level.
The columns:
- ExpCount is the expected count of genes in the
module annotated with the given KEGG pathway, just by chance.
- Count
is the number of genes in the module annotated with the given KEGG
pathway.
- Size is the total number of genes (in our universe)
annotated with the KEGG pathway.
Clicking on Count shows the genes that drive the
enrichment. You can also click on the individual numbers in
the Count column, to show the driving genes for that individual
KEGG pathway.
Clicking on the KEGG identifiers takes you to the KEGG web site.
— Click on the Help button again to close this help window.
Help |
Hide |
Top
Help |
Show |
Top
miRNA test for over-representation
HELP
List of all enriched miRNA families, at the 0.05
p-value level.
The columns:
- ExpCount is the expected count of genes in the
module regulated by the given miRNA family, just by chance.
- Count
is the number of genes in the module regulated by the given miRNA
family.
- Size is the total number of genes (in our universe)
regulated with the given miRNA family.
Clicking on Count shows the genes that drive the
enrichment. You can also click on the individual numbers in
the Count column, to show the driving genes for that individual
miRNA family.
The miRNA regulation data was taken from the TargetScan database.
(Only the conserved sites were used for the current analysis.)
Clicking on the miRNA names takes you to the TargetScan web site.
— Click on the Help button again to close this help window.
Help |
Hide |
Top
Help |
Show |
Top
Chromosome test for over-representation
HELP
List of all enriched Chromosomes, at the 0.05
p-value level.
The columns:
- ExpCount is the expected number of genes in the
module on the given chromosome, just by chance.
- Count
is the number of genes in the module on the given chromosome.
- Size is the total number of genes (in our universe)
on the given chromosome.
Clicking on Count shows the genes that drive the
enrichment. You can also click on the individual numbers in
the Count column, to show the driving genes for that individual
chromosome.
— Click on the Help button again to close this help window.
HELP
A list of all genes in the current module, in alphabetical order. The
size of the text corresponds to the gene scores.
Note that some gene symbols may show up more than once, if many
probes match the same Entrez gene.
Genes with no Entrez mapping are given separately, with their
Affymetrics probe ID.
— Click on the Help button again to close this help window.
Entrez genes
ADAM21ADAM metallopeptidase domain 21 (207665_at), score: 0.71
ADAMTS6ADAM metallopeptidase with thrombospondin type 1 motif, 6 (220866_at), score: -0.74
ANKRD28ankyrin repeat domain 28 (213035_at), score: 0.71
ANXA10annexin A10 (210143_at), score: -0.74
AOF2amine oxidase (flavin containing) domain 2 (212348_s_at), score: 0.71
ARL17ADP-ribosylation factor-like 17 (210435_at), score: -0.65
B3GNTL1UDP-GlcNAc:betaGal beta-1,3-N-acetylglucosaminyltransferase-like 1 (213589_s_at), score: 0.9
C11orf67chromosome 11 open reading frame 67 (221600_s_at), score: 0.66
C16orf7chromosome 16 open reading frame 7 (205781_at), score: -0.63
C1orf159chromosome 1 open reading frame 159 (219337_at), score: -0.61
C8orf17chromosome 8 open reading frame 17 (208266_at), score: -0.69
CCNE1cyclin E1 (213523_at), score: -0.63
CD320CD320 molecule (218529_at), score: 0.83
CD55CD55 molecule, decay accelerating factor for complement (Cromer blood group) (201925_s_at), score: -0.63
CDCA4cell division cycle associated 4 (218399_s_at), score: -0.65
CLCF1cardiotrophin-like cytokine factor 1 (219500_at), score: -1
CLEC1AC-type lectin domain family 1, member A (219761_at), score: -0.66
CLEC3BC-type lectin domain family 3, member B (205200_at), score: -0.71
COL5A3collagen, type V, alpha 3 (52255_s_at), score: -0.85
COL7A1collagen, type VII, alpha 1 (217312_s_at), score: -0.63
CTSZcathepsin Z (210042_s_at), score: 0.72
CXCL6chemokine (C-X-C motif) ligand 6 (granulocyte chemotactic protein 2) (206336_at), score: -0.63
DIRAS3DIRAS family, GTP-binding RAS-like 3 (215506_s_at), score: -0.79
DNAJC24DnaJ (Hsp40) homolog, subfamily C, member 24 (213853_at), score: 0.69
DNM3dynamin 3 (209839_at), score: -0.66
DUSP5dual specificity phosphatase 5 (209457_at), score: -0.67
DUSP6dual specificity phosphatase 6 (208892_s_at), score: -0.8
EDN1endothelin 1 (218995_s_at), score: -0.63
EDNRBendothelin receptor type B (204271_s_at), score: -0.77
EGR2early growth response 2 (Krox-20 homolog, Drosophila) (205249_at), score: -0.66
EGR3early growth response 3 (206115_at), score: -0.72
EMCNendomucin (219436_s_at), score: 0.92
EREGepiregulin (205767_at), score: -0.64
ESRRAestrogen-related receptor alpha (1487_at), score: -0.6
EVI2Becotropic viral integration site 2B (211742_s_at), score: 0.73
FAM48Afamily with sequence similarity 48, member A (221774_x_at), score: 0.69
FAM63Bfamily with sequence similarity 63, member B (214691_x_at), score: -0.68
FBXO31F-box protein 31 (219785_s_at), score: 0.72
FEM1Cfem-1 homolog c (C. elegans) (213341_at), score: -0.61
FLJ12529pre-mRNA cleavage factor I, 59 kDa subunit (217866_at), score: -0.65
FZD4frizzled homolog 4 (Drosophila) (218665_at), score: 0.74
GAAglucosidase, alpha; acid (202812_at), score: -0.69
GANgigaxonin (220124_at), score: -0.68
GNB1Lguanine nucleotide binding protein (G protein), beta polypeptide 1-like (220762_s_at), score: 0.78
GPM6Bglycoprotein M6B (209170_s_at), score: -0.67
GPRASP1G protein-coupled receptor associated sorting protein 1 (204793_at), score: 0.73
GTF2H4general transcription factor IIH, polypeptide 4, 52kDa (203577_at), score: 0.68
HERC3hect domain and RLD 3 (206183_s_at), score: -0.63
HGFhepatocyte growth factor (hepapoietin A; scatter factor) (209960_at), score: -0.7
HINFPhistone H4 transcription factor (206495_s_at), score: 0.72
HIST1H4Hhistone cluster 1, H4h (208180_s_at), score: -0.67
HOXD1homeobox D1 (205975_s_at), score: -0.61
IER2immediate early response 2 (202081_at), score: -0.67
IGF2insulin-like growth factor 2 (somatomedin A) (202409_at), score: -0.63
IL33interleukin 33 (209821_at), score: -0.8
IPPKinositol 1,3,4,5,6-pentakisphosphate 2-kinase (219092_s_at), score: -0.73
JUNBjun B proto-oncogene (201473_at), score: -0.76
KCNE4potassium voltage-gated channel, Isk-related family, member 4 (222379_at), score: 0.69
KCNJ15potassium inwardly-rectifying channel, subfamily J, member 15 (210119_at), score: -0.64
KCTD14potassium channel tetramerisation domain containing 14 (58916_at), score: 0.72
KIAA0586KIAA0586 (205631_at), score: 0.68
KIRRELkin of IRRE like (Drosophila) (220825_s_at), score: 0.7
LAIR2leukocyte-associated immunoglobulin-like receptor 2 (207509_s_at), score: -0.71
LIFleukemia inhibitory factor (cholinergic differentiation factor) (205266_at), score: -0.7
LOC100128223hypothetical protein LOC100128223 (221264_s_at), score: 0.84
LOC388152hypothetical LOC388152 (220602_s_at), score: 0.67
MAP1Smicrotubule-associated protein 1S (218522_s_at), score: -0.74
MLPHmelanophilin (218211_s_at), score: 0.73
MTHFSDmethenyltetrahydrofolate synthetase domain containing (218879_s_at), score: 0.77
MTMR3myotubularin related protein 3 (202197_at), score: -0.63
MUSKmuscle, skeletal, receptor tyrosine kinase (207633_s_at), score: -0.81
NEFLneurofilament, light polypeptide (221805_at), score: -0.69
NELFnasal embryonic LHRH factor (221214_s_at), score: -0.62
NFATC2IPnuclear factor of activated T-cells, cytoplasmic, calcineurin-dependent 2 interacting protein (217526_at), score: -0.77
NMBneuromedin B (205204_at), score: 0.69
NOL8nucleolar protein 8 (218244_at), score: 0.66
PIGLphosphatidylinositol glycan anchor biosynthesis, class L (213889_at), score: 0.69
PLK3polo-like kinase 3 (Drosophila) (204958_at), score: -0.6
PLXNB1plexin B1 (215807_s_at), score: -0.61
PRKG2protein kinase, cGMP-dependent, type II (207505_at), score: -0.86
PRSS3protease, serine, 3 (207463_x_at), score: -0.7
PTCD1pentatricopeptide repeat domain 1 (218956_s_at), score: 0.83
PTGS1prostaglandin-endoperoxide synthase 1 (prostaglandin G/H synthase and cyclooxygenase) (215813_s_at), score: -0.65
RABL3RAB, member of RAS oncogene family-like 3 (213970_at), score: 0.74
RALGDSral guanine nucleotide dissociation stimulator (209050_s_at), score: 0.69
RASA2RAS p21 protein activator 2 (206636_at), score: -0.61
RFX7regulatory factor X, 7 (218430_s_at), score: 0.77
RNF44ring finger protein 44 (203286_at), score: 0.7
SAT1spermidine/spermine N1-acetyltransferase 1 (213988_s_at), score: -0.68
SETMARSET domain and mariner transposase fusion gene (206554_x_at), score: 0.99
SEZ6L2seizure related 6 homolog (mouse)-like 2 (218720_x_at), score: -0.62
SLC20A2solute carrier family 20 (phosphate transporter), member 2 (202744_at), score: -0.61
SLC25A17solute carrier family 25 (mitochondrial carrier; peroxisomal membrane protein, 34kDa), member 17 (211754_s_at), score: -0.64
SLC25A28solute carrier family 25, member 28 (221432_s_at), score: -0.65
SLC38A4solute carrier family 38, member 4 (220786_s_at), score: 0.75
SNX13sorting nexin 13 (213292_s_at), score: 0.67
SPRY4sprouty homolog 4 (Drosophila) (221489_s_at), score: -0.63
SYT11synaptotagmin XI (209198_s_at), score: 0.75
TMEM160transmembrane protein 160 (219219_at), score: 0.73
TMSB15Athymosin beta 15a (205347_s_at), score: 0.75
TNIKTRAF2 and NCK interacting kinase (213107_at), score: 0.67
TPK1thiamin pyrophosphokinase 1 (221218_s_at), score: -0.81
TRIB1tribbles homolog 1 (Drosophila) (202241_at), score: -0.61
UCP2uncoupling protein 2 (mitochondrial, proton carrier) (208998_at), score: 0.97
ZMAT5zinc finger, matrin type 5 (218752_at), score: 0.71
ZNF219zinc finger protein 219 (219314_s_at), score: -0.76
ZNF667zinc finger protein 667 (207120_at), score: 0.77
ZNF749zinc finger protein 749 (215289_at), score: -0.62
ZRANB1zinc finger, RAN-binding domain containing 1 (201219_at), score: 0.7
Non-Entrez genes
Unknown, score:
HELP
Conditions in the module, given in the same order as on the expression
plot above. Red color means over-expression, green under-expression in
the given condition.
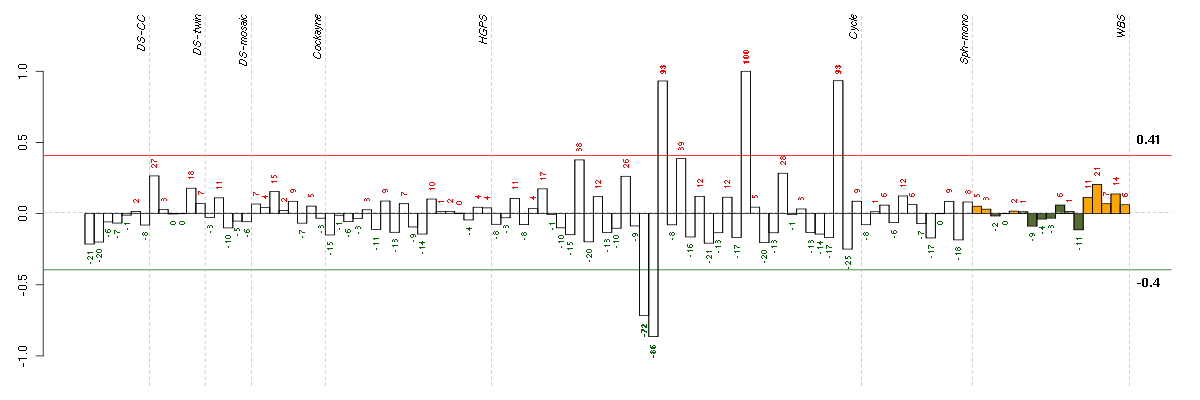
The barplot below shows the condition (sample) scores. A separate bar
is shown for each sample, its height is the corresponding score of the
sample in the module. The red and green numbers on the bars are the
sample scores expressed in percents, i.e. 100% is 1.0.
The red and green lines show the module thresholds, samples above
the red line and below the green line are included in the module.
The different experiments that were part of the study, are separated
by dashed vertical lines.
— Click on the Help button again to close this help window.
| Id | sample | Experiment | ExpName | Array | Syndrome | Cell.line |
| E-TABM-263-raw-cel-1515485991.cel | 18 | 6 | Cycle | hgu133a2 | none | Cycle 1 |
| E-TABM-263-raw-cel-1515485971.cel | 17 | 6 | Cycle | hgu133a2 | none | Cycle 1 |
| E-TABM-263-raw-cel-1515486011.cel | 19 | 6 | Cycle | hgu133a2 | none | Cycle 1 |
| E-TABM-263-raw-cel-1515486391.cel | 38 | 6 | Cycle | hgu133a2 | none | Cycle 1 |
| E-TABM-263-raw-cel-1515486191.cel | 28 | 6 | Cycle | hgu133a2 | none | Cycle 1 |


© 2008-2010 Computational Biology Group, Department of Medical Genetics,
University of Lausanne, Switzerland