Previous module |
Next module
Module #669, TG: 2.8, TC: 1.6, 71 probes, 71 Entrez genes, 10 conditions


HELP
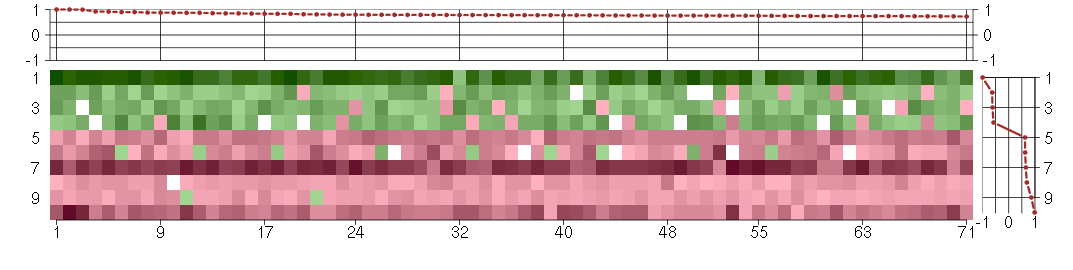
The image plot shows the color-coded level of gene expression, for the
genes and conditions in a given transcription module. The genes are on
the horizontal, the conditions on the vertical axis.
The genes are ordered according to their ISA gene scores, similarly
the conditions are ordered according to their condition scores. The
score of a gene means the «degree of inclusion» in
the module: a high score gene is essential in the module.
Condition scores can also be negative, that means that the genes of
the module are all down-regulated in the condition. Here the absolute
value of the score gives the «degree of inclusion».
The plots above and beside the expression matrix show the gene scores
and condition scores, respectively.
Note that the plot is interactive, you can see the name of the gene
and condition under the mouse cursor.
The expression matrix was normalized to have mean zero and standard
deviation one for every gene separately across all conditions
(i.e. not just for the conditions in the module).
— Click on the Help button again to close this help window.

Under-expression is coded with green,
over-expression with red color.
Help |
Hide |
Top
Help |
Show |
Top
The GO tree — Biological processes
HELP
This is one of three sections showing Gene Ontology enrichment of the
current module: in this case for biological processes.
The graph shows the hierarchy of the GO categories, their enrichment
for the current module is color coded, and the blue number beside the
category is the minus log ten p-value of the enrichment. (Calculated
using the standard hypergeometric test.) The color of the arrows code
«is a» (cyan) and «part of» relationships.
The tree was built the following way. First all GO terms with more
significant enrichment p-value than 0.05 were collected. Then all
paths from these terms to the root node of the GO tree were included
too. If a GO term is included more than once in the tree, then the
green numbers show 1) the id of the node, this makes it easier to find
other appereances of the term, and 2) the number of appearences.
Note that the same GO category might show up on the graph many
times. This is because the GO was «straightened» for this
graph, i.e. if there are more paths from a GO term to the root node of
the tree, all of them are included. The green numbers
Move the mouse cursor over the terms to get their definition. Clicking
on them takes you to the corresponding Gene Ontology web page.
If you cannot see a graph here at all, that means that there were no
significantly enriched GO categories, at the 0.05 level.
— Click on the Help button again to close this help window.

system process
A multicellular organismal process carried out by any of the organs or tissues in an organ system. An organ system is a regularly interacting or interdependent group of organs or tissues that work together to carry out a biological objective.
neurological system process
A organ system process carried out by any of the organs or tissues of neurological system.
sensory perception
The series of events required for an organism to receive a sensory stimulus, convert it to a molecular signal, and recognize and characterize the signal.
biological_process
Any process specifically pertinent to the functioning of integrated living units: cells, tissues, organs, and organisms. A process is a collection of molecular events with a defined beginning and end.
multicellular organismal process
Any biological process, occurring at the level of a multicellular organism, pertinent to its function.
cognition
The operation of the mind by which an organism becomes aware of objects of thought or perception; it includes the mental activities associated with thinking, learning, and memory.
all
This term is the most general term possible
Help |
Hide |
Top
Help |
Show |
Top
The GO tree — Cellular Components
HELP
This is one of three sections showing Gene Ontology enrichment of the
current module: in this case for cellular components.
The graph shows the hierarchy of the GO categories, their enrichment
for the current module is color coded, and the blue number beside the
category is the minus log ten p-value of the enrichment. (Calculated
using the standard hypergeometric test.) The color of the arrows code
«is a» (cyan) and «part of» relationships.
The tree was built the following way. First all GO terms with more
significant enrichment p-value than 0.05 were collected. Then all
paths from these terms to the root node of the GO tree were included
too. If a GO term is included more than once in the tree, then the
green numbers show 1) the id of the node, this makes it easier to find
other appereances of the term, and 2) the number of appearences.
Note that the same GO category might show up on the graph many
times. This is because the GO was «straightened» for this
graph, i.e. if there are more paths from a GO term to the root node of
the tree, all of them are included. The green numbers
Move the mouse cursor over the terms to get their definition. Clicking
on them takes you to the corresponding Gene Ontology web page.
If you cannot see a graph here at all, that means that there were no
significantly enriched GO categories, at the 0.05 level.
— Click on the Help button again to close this help window.
Help |
Hide |
Top
Help |
Show |
Top
The GO tree — Molecular Function
HELP
This is one of three sections showing Gene Ontology enrichment of the
current module: in this case for molecular function.
The graph shows the hierarchy of the GO categories, their enrichment
for the current module is color coded, and the blue number beside the
category is the minus log ten p-value of the enrichment. (Calculated
using the standard hypergeometric test.) The color of the arrows code
«is a» (cyan) and «part of» relationships.
The tree was built the following way. First all GO terms with more
significant enrichment p-value than 0.05 were collected. Then all
paths from these terms to the root node of the GO tree were included
too. If a GO term is included more than once in the tree, then the
green numbers show 1) the id of the node, this makes it easier to find
other appereances of the term, and 2) the number of appearences.
Note that the same GO category might show up on the graph many
times. This is because the GO was «straightened» for this
graph, i.e. if there are more paths from a GO term to the root node of
the tree, all of them are included. The green numbers
Move the mouse cursor over the terms to get their definition. Clicking
on them takes you to the corresponding Gene Ontology web page.
If you cannot see a graph here at all, that means that there were no
significantly enriched GO categories, at the 0.05 level.
— Click on the Help button again to close this help window.
protein binding
Interacting selectively with any protein or protein complex (a complex of two or more proteins that may include other nonprotein molecules).
molecular_function
Elemental activities, such as catalysis or binding, describing the actions of a gene product at the molecular level. A given gene product may exhibit one or more molecular functions.
signal transducer activity
Mediates the transfer of a signal from the outside to the inside of a cell by means other than the introduction of the signal molecule itself into the cell.
receptor activity
Combining with an extracellular or intracellular messenger to initiate a change in cell activity.
transmembrane receptor activity
Combining with an extracellular or intracellular messenger to initiate a change in cell activity, and spanning to the membrane of either the cell or an organelle.
MAP-kinase scaffold activity
Functions as a physical support for the assembly of a multiprotein mitogen-activated protein kinase (MAPK) complex. MAPK scaffold proteins have binding sites for MAPK pathway kinases as well as for upstream signaling proteins.
structural molecule activity
The action of a molecule that contributes to the structural integrity of a complex or assembly within or outside a cell.
binding
The selective, often stoichiometric, interaction of a molecule with one or more specific sites on another molecule.
receptor signaling complex scaffold activity
Functions to provide a physical support for the assembly of a multiprotein receptor signaling complex.
neurotransmitter receptor activity
Combining with a neurotransmitter to initiate a change in cell activity.
protein complex scaffold
Functions to provide a physical support for the assembly of a multiprotein complex.
neurotransmitter binding
Interacting selectively with a neurotransmitter, any chemical substance that is capable of transmitting (or inhibiting the transmission of) a nerve impulse from a neuron to another cell.
molecular transducer activity
The molecular function that accepts an input of one form and creates an output of a different form.
all
This term is the most general term possible
protein complex scaffold
Functions to provide a physical support for the assembly of a multiprotein complex.
neurotransmitter receptor activity
Combining with a neurotransmitter to initiate a change in cell activity.
Help |
Hide |
Top
Help |
Show |
Top
GO BP test for over-representation
HELP
List of all enriched GO categories (biological processes), at the 0.05
p-value level.
The columns:
- ExpCount is the expected count of genes in the
module annotated with the given GO term, just by chance.
- Count
is the number of genes in the module annotated with the given GO
term.
- Size is the total number of genes (in our universe)
annotated with the GO term.
Clicking on Count shows the genes that drive the
enrichment. You can also click on the individual numbers in
the Count column, to show the driving genes for that individual
GO category.
Clicking on the GO identifiers takes you to the Gene Ontology web
pages.
— Click on the Help button again to close this help window.
| Id | Pvalue | ExpCount | Count | Size | Term |
| GO:0007600 | 7.072e-03 | 1.407 | 8
CA4, COL11A2, GABRR2, MYO1A, OR7E24, RPGRIP1, SCN10A, TAS2R9 | 177 | sensory perception |
| GO:0032501 | 1.201e-02 | 13.1 | 26
ADAMTS9, ADRA1D, BRS3, CA4, CATSPER2, COL11A2, DRD5, EDA, GABRR2, KLF1, LHX3, MB, MFNG, MMP9, MOBP, MYL4, MYO1A, NOTCH4, OR7E24, RPGRIP1, SCN10A, SLC15A1, TAS2R9, TBX21, TBX6, VGF | 1648 | multicellular organismal process |
| GO:0003008 | 1.576e-02 | 3.625 | 12
ADRA1D, BRS3, CA4, COL11A2, DRD5, GABRR2, MYL4, MYO1A, OR7E24, RPGRIP1, SCN10A, TAS2R9 | 456 | system process |
| GO:0050877 | 1.738e-02 | 2.607 | 10
ADRA1D, CA4, COL11A2, DRD5, GABRR2, MYO1A, OR7E24, RPGRIP1, SCN10A, TAS2R9 | 328 | neurological system process |
| GO:0050890 | 1.775e-02 | 1.669 | 8
CA4, COL11A2, GABRR2, MYO1A, OR7E24, RPGRIP1, SCN10A, TAS2R9 | 210 | cognition |
| GO:0007186 | 3.219e-02 | 1.884 | 8
ADRA1D, BRS3, DRD5, GABRR2, GPR12, OR7E24, TACR1, TAS2R9 | 237 | G-protein coupled receptor protein signaling pathway |
Help |
Hide |
Top
Help |
Show |
Top
GO CC test for over-representation
HELP
List of all enriched GO categories (cellular components), at the 0.05
p-value level.
The columns:
- ExpCount is the expected count of genes in the
module annotated with the given GO term, just by chance.
- Count
is the number of genes in the module annotated with the given GO
term.
- Size is the total number of genes (in our universe)
annotated with the GO term.
Clicking on Count shows the genes that drive the
enrichment. You can also click on the individual numbers in
the Count column, to show the driving genes for that individual
GO category.
Clicking on the GO identifiers takes you to the Gene Ontology web
pages.
— Click on the Help button again to close this help window.
| Id | Pvalue | ExpCount | Count | Size | Term |
| GO:0031224 | 1.166e-02 | 15.52 | 28
ABCG4, ADRA1D, BRS3, BTNL3, CA4, CATSPER2, CEACAM5, CYBB, DHRS9, DRD5, EDA, FAM75A3, FUT3, GABRR2, GPR12, LILRA5, LRRN2, MFNG, NOTCH4, OR7E24, PECAM1, PRSS7, ROS1, SCN10A, SLC15A1, SLC26A10, SLCO1C1, TACR1 | 2051 | intrinsic to membrane |
| GO:0005576 | 1.612e-02 | 5.298 | 14
ADAMTS7, ADAMTS9, COL11A2, DMBT1, EDA, FGL1, LILRA5, MFNG, MMP9, MMRN2, MSTP9, NOTCH4, PECAM1, VGF | 700 | extracellular region |
| GO:0044421 | 1.617e-02 | 2.929 | 10
ADAMTS7, ADAMTS9, COL11A2, FGL1, MFNG, MMP9, MMRN2, NOTCH4, PECAM1, VGF | 387 | extracellular region part |
| GO:0016021 | 2.114e-02 | 15.3 | 27
ABCG4, ADRA1D, BRS3, BTNL3, CATSPER2, CEACAM5, CYBB, DHRS9, DRD5, EDA, FAM75A3, FUT3, GABRR2, GPR12, LILRA5, LRRN2, MFNG, NOTCH4, OR7E24, PECAM1, PRSS7, ROS1, SCN10A, SLC15A1, SLC26A10, SLCO1C1, TACR1 | 2022 | integral to membrane |
Help |
Hide |
Top
Help |
Show |
Top
GO MF test for over-representation
HELP
List of all enriched GO categories (molecular function), at the 0.05
p-value level.
The columns:
- ExpCount is the expected count of genes in the
module annotated with the given GO term, just by chance.
- Count
is the number of genes in the module annotated with the given GO
term.
- Size is the total number of genes (in our universe)
annotated with the GO term.
Clicking on Count shows the genes that drive the
enrichment. You can also click on the individual numbers in
the Count column, to show the driving genes for that individual
GO category.
Clicking on the GO identifiers takes you to the Gene Ontology web
pages.
— Click on the Help button again to close this help window.
| Id | Pvalue | ExpCount | Count | Size | Term |
| GO:0030594 | 4.894e-03 | 0.1862 | 4
BRS3, DRD5, GABRR2, TACR1 | 24 | neurotransmitter receptor activity |
| GO:0042165 | 4.894e-03 | 0.1862 | 4
BRS3, DRD5, GABRR2, TACR1 | 24 | neurotransmitter binding |
| GO:0004872 | 6.183e-03 | 4.136 | 14
ADRA1D, BRS3, DMBT1, DRD5, GABRR2, GPR12, LILRA5, LRRN2, NOTCH4, OR7E24, PRSS7, ROS1, TACR1, TAS2R9 | 533 | receptor activity |
| GO:0004888 | 6.275e-03 | 2.592 | 11
ADRA1D, BRS3, DMBT1, DRD5, GABRR2, GPR12, OR7E24, PRSS7, ROS1, TACR1, TAS2R9 | 334 | transmembrane receptor activity |
| GO:0005078 | 8.100e-03 | 0.01552 | 2
MAPK8IP1, MAPK8IP2 | 2 | MAP-kinase scaffold activity |
| GO:0004930 | 1.055e-02 | 1.063 | 7
ADRA1D, BRS3, DRD5, GPR12, OR7E24, TACR1, TAS2R9 | 137 | G-protein coupled receptor activity |
| GO:0008188 | 3.030e-02 | 0.03104 | 2
BRS3, TACR1 | 4 | neuropeptide receptor activity |
| GO:0042923 | 3.030e-02 | 0.03104 | 2
BRS3, TACR1 | 4 | neuropeptide binding |
Help |
Hide |
Top
Help |
Show |
Top
KEGG Pathway test for over-representation
HELP
List of all enriched KEGG pathways, at the 0.05
p-value level.
The columns:
- ExpCount is the expected count of genes in the
module annotated with the given KEGG pathway, just by chance.
- Count
is the number of genes in the module annotated with the given KEGG
pathway.
- Size is the total number of genes (in our universe)
annotated with the KEGG pathway.
Clicking on Count shows the genes that drive the
enrichment. You can also click on the individual numbers in
the Count column, to show the driving genes for that individual
KEGG pathway.
Clicking on the KEGG identifiers takes you to the KEGG web site.
— Click on the Help button again to close this help window.
| Id | Pvalue | ExpCount | Count | Size | Term |
| 04080 | 4.962e-02 | 0.7916 | 5
ADRA1D, BRS3, DRD5, GABRR2, TACR1 | 83 | Neuroactive ligand-receptor interaction |
Help |
Hide |
Top
Help |
Show |
Top
miRNA test for over-representation
HELP
List of all enriched miRNA families, at the 0.05
p-value level.
The columns:
- ExpCount is the expected count of genes in the
module regulated by the given miRNA family, just by chance.
- Count
is the number of genes in the module regulated by the given miRNA
family.
- Size is the total number of genes (in our universe)
regulated with the given miRNA family.
Clicking on Count shows the genes that drive the
enrichment. You can also click on the individual numbers in
the Count column, to show the driving genes for that individual
miRNA family.
The miRNA regulation data was taken from the TargetScan database.
(Only the conserved sites were used for the current analysis.)
Clicking on the miRNA names takes you to the TargetScan web site.
— Click on the Help button again to close this help window.
Help |
Hide |
Top
Help |
Show |
Top
Chromosome test for over-representation
HELP
List of all enriched Chromosomes, at the 0.05
p-value level.
The columns:
- ExpCount is the expected number of genes in the
module on the given chromosome, just by chance.
- Count
is the number of genes in the module on the given chromosome.
- Size is the total number of genes (in our universe)
on the given chromosome.
Clicking on Count shows the genes that drive the
enrichment. You can also click on the individual numbers in
the Count column, to show the driving genes for that individual
chromosome.
— Click on the Help button again to close this help window.
HELP
A list of all genes in the current module, in alphabetical order. The
size of the text corresponds to the gene scores.
Note that some gene symbols may show up more than once, if many
probes match the same Entrez gene.
Genes with no Entrez mapping are given separately, with their
Affymetrics probe ID.
— Click on the Help button again to close this help window.
Entrez genes
A1CFAPOBEC1 complementation factor (220951_s_at), score: 0.76
ABCG4ATP-binding cassette, sub-family G (WHITE), member 4 (207593_at), score: 0.73
ADAMTS7ADAM metallopeptidase with thrombospondin type 1 motif, 7 (220705_s_at), score: 0.79
ADAMTS9ADAM metallopeptidase with thrombospondin type 1 motif, 9 (220287_at), score: 0.74
ADRA1Dadrenergic, alpha-1D-, receptor (210961_s_at), score: 0.72
AGMATagmatine ureohydrolase (agmatinase) (219792_at), score: 0.78
BRS3bombesin-like receptor 3 (207369_at), score: 0.76
BTNL3butyrophilin-like 3 (217207_s_at), score: 0.8
C7orf28Achromosome 7 open reading frame 28A (201974_s_at), score: 0.78
CA4carbonic anhydrase IV (206209_s_at), score: 0.84
CASZ1castor zinc finger 1 (220015_at), score: 0.79
CATSPER2cation channel, sperm associated 2 (217588_at), score: 0.85
CCDC9coiled-coil domain containing 9 (206257_at), score: 0.88
CEACAM5carcinoembryonic antigen-related cell adhesion molecule 5 (201884_at), score: 0.75
COL11A2collagen, type XI, alpha 2 (216993_s_at), score: 0.83
CYBBcytochrome b-245, beta polypeptide (203923_s_at), score: 0.9
DHRS9dehydrogenase/reductase (SDR family) member 9 (219799_s_at), score: 0.8
DMBT1deleted in malignant brain tumors 1 (208250_s_at), score: 0.81
DNASE1L3deoxyribonuclease I-like 3 (205554_s_at), score: 0.76
DOHHdeoxyhypusine hydroxylase/monooxygenase (208141_s_at), score: 0.75
DRD5dopamine receptor D5 (208486_at), score: 0.78
EDAectodysplasin A (211130_x_at), score: 0.87
FAM75A3family with sequence similarity 75, member A3 (215935_at), score: 0.76
FGL1fibrinogen-like 1 (205305_at), score: 0.74
FUT3fucosyltransferase 3 (galactoside 3(4)-L-fucosyltransferase, Lewis blood group) (214088_s_at), score: 0.78
GABRR2gamma-aminobutyric acid (GABA) receptor, rho 2 (208217_at), score: 0.75
GBA3glucosidase, beta, acid 3 (cytosolic) (219954_s_at), score: 0.77
GPR12G protein-coupled receptor 12 (214558_at), score: 0.77
HAB1B1 for mucin (215778_x_at), score: 0.78
HAO2hydroxyacid oxidase 2 (long chain) (220801_s_at), score: 0.76
INE1inactivation escape 1 (non-protein coding) (207252_at), score: 0.78
KLF1Kruppel-like factor 1 (erythroid) (210504_at), score: 0.78
KRT8P12keratin 8 pseudogene 12 (222060_at), score: 0.76
LHX3LIM homeobox 3 (221670_s_at), score: 0.83
LILRA5leukocyte immunoglobulin-like receptor, subfamily A (with TM domain), member 5 (215838_at), score: 0.75
LOC643293FLJ44451 pseudogene (215057_at), score: 0.79
LOC80054hypothetical LOC80054 (220465_at), score: 0.74
LONRF3LON peptidase N-terminal domain and ring finger 3 (220009_at), score: 0.74
LRRN2leucine rich repeat neuronal 2 (216164_at), score: 0.78
MAPK8IP1mitogen-activated protein kinase 8 interacting protein 1 (213013_at), score: 0.76
MAPK8IP2mitogen-activated protein kinase 8 interacting protein 2 (205050_s_at), score: 0.77
MBmyoglobin (204179_at), score: 0.79
MFNGMFNG O-fucosylpeptide 3-beta-N-acetylglucosaminyltransferase (204153_s_at), score: 0.92
MMP9matrix metallopeptidase 9 (gelatinase B, 92kDa gelatinase, 92kDa type IV collagenase) (203936_s_at), score: 0.74
MMRN2multimerin 2 (219091_s_at), score: 0.76
MOBPmyelin-associated oligodendrocyte basic protein (210193_at), score: 1
MSTP9macrophage stimulating, pseudogene 9 (213382_at), score: 0.79
MYL4myosin, light chain 4, alkali; atrial, embryonic (210088_x_at), score: 0.83
MYO1Amyosin IA (211916_s_at), score: 0.87
NOTCH4Notch homolog 4 (Drosophila) (205247_at), score: 0.76
OR7E24olfactory receptor, family 7, subfamily E, member 24 (215463_at), score: 0.87
PECAM1platelet/endothelial cell adhesion molecule (208982_at), score: 0.88
PGK2phosphoglycerate kinase 2 (217009_at), score: 0.92
PIPOXpipecolic acid oxidase (221605_s_at), score: 0.76
PRSS7protease, serine, 7 (enterokinase) (217269_s_at), score: 0.99
PYHIN1pyrin and HIN domain family, member 1 (216748_at), score: 0.79
ROS1c-ros oncogene 1 , receptor tyrosine kinase (207569_at), score: 0.74
RPGRIP1retinitis pigmentosa GTPase regulator interacting protein 1 (206608_s_at), score: 0.85
S100A14S100 calcium binding protein A14 (218677_at), score: 0.78
SCN10Asodium channel, voltage-gated, type X, alpha subunit (208578_at), score: 0.73
SLC15A1solute carrier family 15 (oligopeptide transporter), member 1 (211349_at), score: 0.74
SLC26A10solute carrier family 26, member 10 (214951_at), score: 0.86
SLCO1C1solute carrier organic anion transporter family, member 1C1 (220460_at), score: 0.74
SOCS3suppressor of cytokine signaling 3 (206359_at), score: 0.73
TACR1tachykinin receptor 1 (208048_at), score: 0.9
TAS2R9taste receptor, type 2, member 9 (221461_at), score: 0.77
TBX21T-box 21 (220684_at), score: 0.81
TBX6T-box 6 (207684_at), score: 0.78
TGM4transglutaminase 4 (prostate) (217566_s_at), score: 0.74
TMSB4Ythymosin beta 4, Y-linked (206769_at), score: 0.8
VGFVGF nerve growth factor inducible (205586_x_at), score: 1
Non-Entrez genes
Unknown, score:
HELP
Conditions in the module, given in the same order as on the expression
plot above. Red color means over-expression, green under-expression in
the given condition.
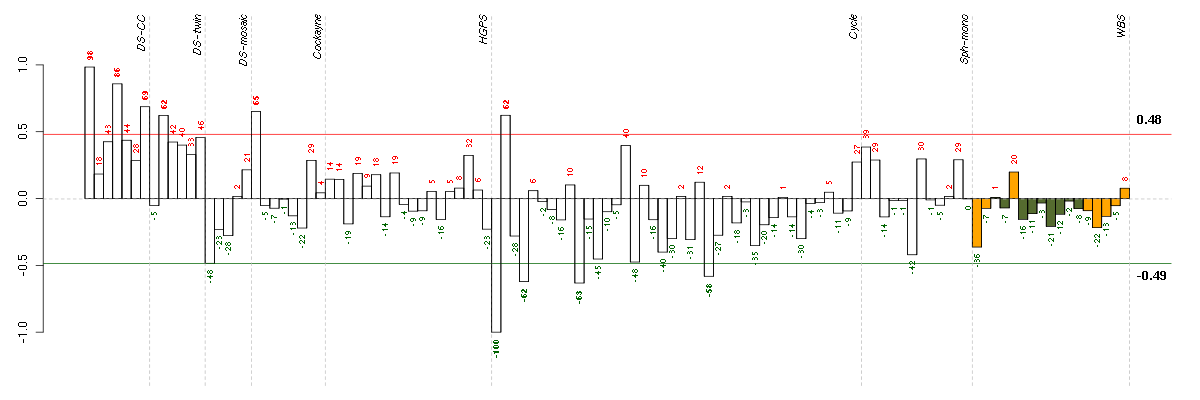
The barplot below shows the condition (sample) scores. A separate bar
is shown for each sample, its height is the corresponding score of the
sample in the module. The red and green numbers on the bars are the
sample scores expressed in percents, i.e. 100% is 1.0.
The red and green lines show the module thresholds, samples above
the red line and below the green line are included in the module.
The different experiments that were part of the study, are separated
by dashed vertical lines.
— Click on the Help button again to close this help window.
| Id | sample | Experiment | ExpName | Array | Syndrome | Cell.line |
| E-TABM-263-raw-cel-1515485651.cel | 1 | 6 | Cycle | hgu133a2 | none | Cycle 1 |
| E-TABM-263-raw-cel-1515485831.cel | 10 | 6 | Cycle | hgu133a2 | none | Cycle 1 |
| E-TABM-263-raw-cel-1515485711.cel | 4 | 6 | Cycle | hgu133a2 | none | Cycle 1 |
| E-TABM-263-raw-cel-1515486111.cel | 24 | 6 | Cycle | hgu133a2 | none | Cycle 1 |
| 2Twin.CEL | 2 | 2 | DS-twin | hgu133plus2 | none | DS-twin 2 |
| E-TABM-263-raw-cel-1515485671.cel | 2 | 6 | Cycle | hgu133a2 | none | Cycle 1 |
| E-GEOD-3407-raw-cel-1437949557.cel | 1 | 4 | Cockayne | hgu133a | CS | eGFP |
| t21d 08-03.CEL | 7 | 1 | DS-CC | hgu133a | Down | DS-CC 7 |
| t21a 08-03.CEL | 4 | 1 | DS-CC | hgu133a | Down | DS-CC 4 |
| ctrl a 08-03.CEL | 1 | 1 | DS-CC | hgu133a | none | DS-CC 1 |


© 2008-2010 Computational Biology Group, Department of Medical Genetics,
University of Lausanne, Switzerland