Previous module |
Next module
Module #708, TG: 2.6, TC: 2, 119 probes, 119 Entrez genes, 8 conditions


HELP
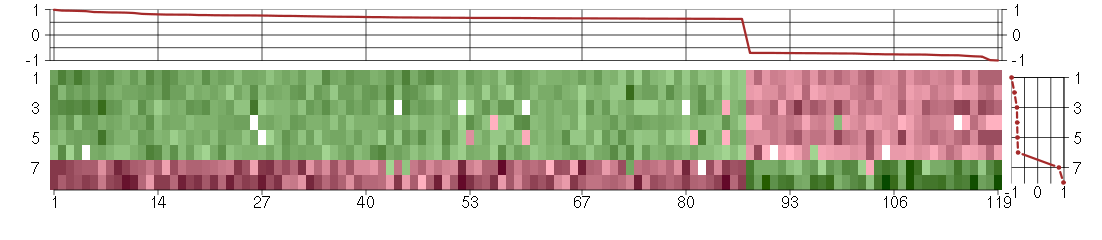
The image plot shows the color-coded level of gene expression, for the
genes and conditions in a given transcription module. The genes are on
the horizontal, the conditions on the vertical axis.
The genes are ordered according to their ISA gene scores, similarly
the conditions are ordered according to their condition scores. The
score of a gene means the «degree of inclusion» in
the module: a high score gene is essential in the module.
Condition scores can also be negative, that means that the genes of
the module are all down-regulated in the condition. Here the absolute
value of the score gives the «degree of inclusion».
The plots above and beside the expression matrix show the gene scores
and condition scores, respectively.
Note that the plot is interactive, you can see the name of the gene
and condition under the mouse cursor.
The expression matrix was normalized to have mean zero and standard
deviation one for every gene separately across all conditions
(i.e. not just for the conditions in the module).
— Click on the Help button again to close this help window.

Under-expression is coded with green,
over-expression with red color.
Help |
Hide |
Top
Help |
Show |
Top
The GO tree — Biological processes
HELP
This is one of three sections showing Gene Ontology enrichment of the
current module: in this case for biological processes.
The graph shows the hierarchy of the GO categories, their enrichment
for the current module is color coded, and the blue number beside the
category is the minus log ten p-value of the enrichment. (Calculated
using the standard hypergeometric test.) The color of the arrows code
«is a» (cyan) and «part of» relationships.
The tree was built the following way. First all GO terms with more
significant enrichment p-value than 0.05 were collected. Then all
paths from these terms to the root node of the GO tree were included
too. If a GO term is included more than once in the tree, then the
green numbers show 1) the id of the node, this makes it easier to find
other appereances of the term, and 2) the number of appearences.
Note that the same GO category might show up on the graph many
times. This is because the GO was «straightened» for this
graph, i.e. if there are more paths from a GO term to the root node of
the tree, all of them are included. The green numbers
Move the mouse cursor over the terms to get their definition. Clicking
on them takes you to the corresponding Gene Ontology web page.
If you cannot see a graph here at all, that means that there were no
significantly enriched GO categories, at the 0.05 level.
— Click on the Help button again to close this help window.

cell adhesion
The attachment of a cell, either to another cell or to an underlying substrate such as the extracellular matrix, via cell adhesion molecules.
homophilic cell adhesion
The attachment of an adhesion molecule in one cell to an identical molecule in an adjacent cell.
calcium-dependent cell-cell adhesion
The attachment of one cell to another cell via adhesion molecules that require the presence of calcium for the interaction.
biological_process
Any process specifically pertinent to the functioning of integrated living units: cells, tissues, organs, and organisms. A process is a collection of molecular events with a defined beginning and end.
cellular process
Any process that is carried out at the cellular level, but not necessarily restricted to a single cell. For example, cell communication occurs among more than one cell, but occurs at the cellular level.
cell-cell adhesion
The attachment of one cell to another cell via adhesion molecules.
biological adhesion
The attachment of a cell or organism to a substrate or other organism.
all
This term is the most general term possible
cell adhesion
The attachment of a cell, either to another cell or to an underlying substrate such as the extracellular matrix, via cell adhesion molecules.
Help |
Hide |
Top
Help |
Show |
Top
The GO tree — Cellular Components
HELP
This is one of three sections showing Gene Ontology enrichment of the
current module: in this case for cellular components.
The graph shows the hierarchy of the GO categories, their enrichment
for the current module is color coded, and the blue number beside the
category is the minus log ten p-value of the enrichment. (Calculated
using the standard hypergeometric test.) The color of the arrows code
«is a» (cyan) and «part of» relationships.
The tree was built the following way. First all GO terms with more
significant enrichment p-value than 0.05 were collected. Then all
paths from these terms to the root node of the GO tree were included
too. If a GO term is included more than once in the tree, then the
green numbers show 1) the id of the node, this makes it easier to find
other appereances of the term, and 2) the number of appearences.
Note that the same GO category might show up on the graph many
times. This is because the GO was «straightened» for this
graph, i.e. if there are more paths from a GO term to the root node of
the tree, all of them are included. The green numbers
Move the mouse cursor over the terms to get their definition. Clicking
on them takes you to the corresponding Gene Ontology web page.
If you cannot see a graph here at all, that means that there were no
significantly enriched GO categories, at the 0.05 level.
— Click on the Help button again to close this help window.
Help |
Hide |
Top
Help |
Show |
Top
The GO tree — Molecular Function
HELP
This is one of three sections showing Gene Ontology enrichment of the
current module: in this case for molecular function.
The graph shows the hierarchy of the GO categories, their enrichment
for the current module is color coded, and the blue number beside the
category is the minus log ten p-value of the enrichment. (Calculated
using the standard hypergeometric test.) The color of the arrows code
«is a» (cyan) and «part of» relationships.
The tree was built the following way. First all GO terms with more
significant enrichment p-value than 0.05 were collected. Then all
paths from these terms to the root node of the GO tree were included
too. If a GO term is included more than once in the tree, then the
green numbers show 1) the id of the node, this makes it easier to find
other appereances of the term, and 2) the number of appearences.
Note that the same GO category might show up on the graph many
times. This is because the GO was «straightened» for this
graph, i.e. if there are more paths from a GO term to the root node of
the tree, all of them are included. The green numbers
Move the mouse cursor over the terms to get their definition. Clicking
on them takes you to the corresponding Gene Ontology web page.
If you cannot see a graph here at all, that means that there were no
significantly enriched GO categories, at the 0.05 level.
— Click on the Help button again to close this help window.
Help |
Hide |
Top
Help |
Show |
Top
GO BP test for over-representation
HELP
List of all enriched GO categories (biological processes), at the 0.05
p-value level.
The columns:
- ExpCount is the expected count of genes in the
module annotated with the given GO term, just by chance.
- Count
is the number of genes in the module annotated with the given GO
term.
- Size is the total number of genes (in our universe)
annotated with the GO term.
Clicking on Count shows the genes that drive the
enrichment. You can also click on the individual numbers in
the Count column, to show the driving genes for that individual
GO category.
Clicking on the GO identifiers takes you to the Gene Ontology web
pages.
— Click on the Help button again to close this help window.
| Id | Pvalue | ExpCount | Count | Size | Term |
| GO:0016339 | 3.020e-03 | 0.06579 | 3
CDH13, DCHS1, PCDHGC3 | 6 | calcium-dependent cell-cell adhesion |
| GO:0007156 | 6.947e-03 | 0.4386 | 5
CDH13, CDH6, DCHS1, PCDHGA1, PCDHGC3 | 40 | homophilic cell adhesion |
| GO:0000389 | 3.972e-02 | 0.04386 | 2
SF1, SF3A2 | 4 | nuclear mRNA 3'-splice site recognition |
| GO:0030030 | 4.976e-02 | 1.59 | 7
CAPG, CDH13, KAL1, MAP1S, NEFM, NRXN3, PIP5K1C | 145 | cell projection organization |
Help |
Hide |
Top
Help |
Show |
Top
GO CC test for over-representation
HELP
List of all enriched GO categories (cellular components), at the 0.05
p-value level.
The columns:
- ExpCount is the expected count of genes in the
module annotated with the given GO term, just by chance.
- Count
is the number of genes in the module annotated with the given GO
term.
- Size is the total number of genes (in our universe)
annotated with the GO term.
Clicking on Count shows the genes that drive the
enrichment. You can also click on the individual numbers in
the Count column, to show the driving genes for that individual
GO category.
Clicking on the GO identifiers takes you to the Gene Ontology web
pages.
— Click on the Help button again to close this help window.
Help |
Hide |
Top
Help |
Show |
Top
GO MF test for over-representation
HELP
List of all enriched GO categories (molecular function), at the 0.05
p-value level.
The columns:
- ExpCount is the expected count of genes in the
module annotated with the given GO term, just by chance.
- Count
is the number of genes in the module annotated with the given GO
term.
- Size is the total number of genes (in our universe)
annotated with the GO term.
Clicking on Count shows the genes that drive the
enrichment. You can also click on the individual numbers in
the Count column, to show the driving genes for that individual
GO category.
Clicking on the GO identifiers takes you to the Gene Ontology web
pages.
— Click on the Help button again to close this help window.
Help |
Hide |
Top
Help |
Show |
Top
KEGG Pathway test for over-representation
HELP
List of all enriched KEGG pathways, at the 0.05
p-value level.
The columns:
- ExpCount is the expected count of genes in the
module annotated with the given KEGG pathway, just by chance.
- Count
is the number of genes in the module annotated with the given KEGG
pathway.
- Size is the total number of genes (in our universe)
annotated with the KEGG pathway.
Clicking on Count shows the genes that drive the
enrichment. You can also click on the individual numbers in
the Count column, to show the driving genes for that individual
KEGG pathway.
Clicking on the KEGG identifiers takes you to the KEGG web site.
— Click on the Help button again to close this help window.
Help |
Hide |
Top
Help |
Show |
Top
miRNA test for over-representation
HELP
List of all enriched miRNA families, at the 0.05
p-value level.
The columns:
- ExpCount is the expected count of genes in the
module regulated by the given miRNA family, just by chance.
- Count
is the number of genes in the module regulated by the given miRNA
family.
- Size is the total number of genes (in our universe)
regulated with the given miRNA family.
Clicking on Count shows the genes that drive the
enrichment. You can also click on the individual numbers in
the Count column, to show the driving genes for that individual
miRNA family.
The miRNA regulation data was taken from the TargetScan database.
(Only the conserved sites were used for the current analysis.)
Clicking on the miRNA names takes you to the TargetScan web site.
— Click on the Help button again to close this help window.
Help |
Hide |
Top
Help |
Show |
Top
Chromosome test for over-representation
HELP
List of all enriched Chromosomes, at the 0.05
p-value level.
The columns:
- ExpCount is the expected number of genes in the
module on the given chromosome, just by chance.
- Count
is the number of genes in the module on the given chromosome.
- Size is the total number of genes (in our universe)
on the given chromosome.
Clicking on Count shows the genes that drive the
enrichment. You can also click on the individual numbers in
the Count column, to show the driving genes for that individual
chromosome.
— Click on the Help button again to close this help window.
HELP
A list of all genes in the current module, in alphabetical order. The
size of the text corresponds to the gene scores.
Note that some gene symbols may show up more than once, if many
probes match the same Entrez gene.
Genes with no Entrez mapping are given separately, with their
Affymetrics probe ID.
— Click on the Help button again to close this help window.
Entrez genes
ACN9ACN9 homolog (S. cerevisiae) (218981_at), score: -0.7
ADCK2aarF domain containing kinase 2 (221893_s_at), score: 0.68
AHNAKAHNAK nucleoprotein (211986_at), score: 0.65
AKAP2A kinase (PRKA) anchor protein 2 (202759_s_at), score: 0.71
ATN1atrophin 1 (40489_at), score: 0.77
B3GAT3beta-1,3-glucuronyltransferase 3 (glucuronosyltransferase I) (203452_at), score: 0.68
BACE2beta-site APP-cleaving enzyme 2 (217867_x_at), score: 0.77
BIN1bridging integrator 1 (210201_x_at), score: 0.8
BRD9bromodomain containing 9 (220155_s_at), score: 0.69
BTBD2BTB (POZ) domain containing 2 (207722_s_at), score: 0.72
C16orf57chromosome 16 open reading frame 57 (218060_s_at), score: 0.65
C4orf43chromosome 4 open reading frame 43 (218513_at), score: -0.71
C5orf28chromosome 5 open reading frame 28 (219029_at), score: -0.71
CAPGcapping protein (actin filament), gelsolin-like (201850_at), score: 0.63
CASC3cancer susceptibility candidate 3 (207842_s_at), score: 0.68
CDC42BPBCDC42 binding protein kinase beta (DMPK-like) (217849_s_at), score: 0.75
CDH13cadherin 13, H-cadherin (heart) (204726_at), score: -0.78
CDH6cadherin 6, type 2, K-cadherin (fetal kidney) (205532_s_at), score: -0.73
CDR2Lcerebellar degeneration-related protein 2-like (213230_at), score: 0.67
CHD8chromodomain helicase DNA binding protein 8 (212571_at), score: 0.63
CICcapicua homolog (Drosophila) (212784_at), score: 0.68
CITcitron (rho-interacting, serine/threonine kinase 21) (212801_at), score: 0.67
CIZ1CDKN1A interacting zinc finger protein 1 (205516_x_at), score: 0.71
CNIH3cornichon homolog 3 (Drosophila) (214841_at), score: 0.65
CNOT3CCR4-NOT transcription complex, subunit 3 (203239_s_at), score: 0.75
CRTC3CREB regulated transcription coactivator 3 (218648_at), score: 0.9
DCHS1dachsous 1 (Drosophila) (222101_s_at), score: 0.65
DMWDdystrophia myotonica, WD repeat containing (213231_at), score: 0.72
DNM1dynamin 1 (215116_s_at), score: 0.78
EPS15epidermal growth factor receptor pathway substrate 15 (217887_s_at), score: -0.76
F2Rcoagulation factor II (thrombin) receptor (203989_x_at), score: -0.77
FAM168Bfamily with sequence similarity 168, member B (212017_at), score: 0.73
FAM18Bfamily with sequence similarity 18, member B (218446_s_at), score: -0.72
FASNfatty acid synthase (212218_s_at), score: 0.66
FBXO17F-box protein 17 (220233_at), score: 0.64
FHfumarate hydratase (203032_s_at), score: -0.72
FLJ12529pre-mRNA cleavage factor I, 59 kDa subunit (217866_at), score: 0.96
FOXK2forkhead box K2 (203064_s_at), score: 0.82
GMCL1germ cell-less homolog 1 (Drosophila) (218458_at), score: -0.85
HNRNPH2heterogeneous nuclear ribonucleoprotein H2 (H') (201132_at), score: -0.84
HNRNPUL1heterogeneous nuclear ribonucleoprotein U-like 1 (209675_s_at), score: 0.72
HSPA12Aheat shock 70kDa protein 12A (214434_at), score: 0.95
KAL1Kallmann syndrome 1 sequence (205206_at), score: -0.72
KPNA6karyopherin alpha 6 (importin alpha 7) (212101_at), score: 0.64
LHFPL2lipoma HMGIC fusion partner-like 2 (212658_at), score: 0.77
LOC100132540similar to LOC339047 protein (214870_x_at), score: 0.95
LOC100133105hypothetical protein LOC100133105 (214237_x_at), score: -0.7
LOC339047hypothetical protein LOC339047 (221501_x_at), score: 0.99
LOC399491LOC399491 protein (214035_x_at), score: 0.78
LRFN4leucine rich repeat and fibronectin type III domain containing 4 (219491_at), score: 0.67
LRRN3leucine rich repeat neuronal 3 (209841_s_at), score: -1
LRRTM4leucine rich repeat transmembrane neuronal 4 (220345_at), score: 0.68
MAP1Smicrotubule-associated protein 1S (218522_s_at), score: 0.73
MAP7D1MAP7 domain containing 1 (217943_s_at), score: 0.75
MAST2microtubule associated serine/threonine kinase 2 (211593_s_at), score: 0.77
MC4Rmelanocortin 4 receptor (221467_at), score: -0.75
MFAP3Lmicrofibrillar-associated protein 3-like (205442_at), score: -0.82
MINK1misshapen-like kinase 1 (zebrafish) (214246_x_at), score: 0.67
MLL4myeloid/lymphoid or mixed-lineage leukemia 4 (203419_at), score: 0.64
NBL1neuroblastoma, suppression of tumorigenicity 1 (37005_at), score: 0.88
NCOR2nuclear receptor co-repressor 2 (207760_s_at), score: 0.63
NEFMneurofilament, medium polypeptide (205113_at), score: -0.98
NFATC4nuclear factor of activated T-cells, cytoplasmic, calcineurin-dependent 4 (205897_at), score: 0.65
NKX3-1NK3 homeobox 1 (209706_at), score: 0.68
NPIPnuclear pore complex interacting protein (204538_x_at), score: 0.94
NR1D1nuclear receptor subfamily 1, group D, member 1 (31637_s_at), score: 0.63
NRXN3neurexin 3 (205795_at), score: -0.79
OLFM1olfactomedin 1 (213131_at), score: 0.64
OLFML2Bolfactomedin-like 2B (213125_at), score: 0.65
OPCMLopioid binding protein/cell adhesion molecule-like (214111_at), score: -0.76
OR7E156Polfactory receptor, family 7, subfamily E, member 156 pseudogene (222327_x_at), score: -0.71
OTUD3OTU domain containing 3 (213216_at), score: 0.65
PCDHG@protocadherin gamma cluster (215836_s_at), score: 0.66
PCDHGA1protocadherin gamma subfamily A, 1 (209079_x_at), score: 0.86
PCDHGC3protocadherin gamma subfamily C, 3 (211066_x_at), score: 0.77
PHLPPPH domain and leucine rich repeat protein phosphatase (212719_at), score: 0.67
PIP5K1Cphosphatidylinositol-4-phosphate 5-kinase, type I, gamma (212518_at), score: 0.8
PNPLA2patatin-like phospholipase domain containing 2 (212705_x_at), score: 0.63
POLR2Apolymerase (RNA) II (DNA directed) polypeptide A, 220kDa (202725_at), score: 0.64
POLSpolymerase (DNA directed) sigma (202466_at), score: 0.8
POM121POM121 membrane glycoprotein (rat) (212178_s_at), score: 0.8
POM121CPOM121 membrane glycoprotein C (213360_s_at), score: 0.65
POMZP3POM (POM121 homolog, rat) and ZP3 fusion (204148_s_at), score: 0.66
PTPN9protein tyrosine phosphatase, non-receptor type 9 (202958_at), score: 0.7
RAD54L2RAD54-like 2 (S. cerevisiae) (213205_s_at), score: 0.67
RBM15BRNA binding motif protein 15B (202689_at), score: 0.69
REREarginine-glutamic acid dipeptide (RE) repeats (200940_s_at), score: 0.69
RNF11ring finger protein 11 (208924_at), score: -0.71
RNF220ring finger protein 220 (219988_s_at), score: 0.9
RPL18AP6ribosomal protein L18a pseudogene 6 (216383_at), score: -0.79
RPS17P5ribosomal protein S17 pseudogene 5 (216348_at), score: -0.74
SCAMP1secretory carrier membrane protein 1 (206667_s_at), score: -0.76
SCAMP4secretory carrier membrane protein 4 (213244_at), score: 0.89
SCN9Asodium channel, voltage-gated, type IX, alpha subunit (206950_at), score: -0.73
SDC1syndecan 1 (201287_s_at), score: 0.63
SETBP1SET binding protein 1 (205933_at), score: 0.76
SF1splicing factor 1 (208313_s_at), score: 0.83
SF3A2splicing factor 3a, subunit 2, 66kDa (37462_i_at), score: 0.65
SLC6A8solute carrier family 6 (neurotransmitter transporter, creatine), member 8 (202219_at), score: 0.64
SMG7Smg-7 homolog, nonsense mediated mRNA decay factor (C. elegans) (201794_s_at), score: 0.7
SNAP23synaptosomal-associated protein, 23kDa (214544_s_at), score: -0.75
SOLHsmall optic lobes homolog (Drosophila) (204275_at), score: 0.74
STRN4striatin, calmodulin binding protein 4 (217903_at), score: 0.88
SUSD5sushi domain containing 5 (214954_at), score: -0.77
TAPBPTAP binding protein (tapasin) (208829_at), score: 0.7
TBCDtubulin folding cofactor D (211052_s_at), score: 0.66
TBX3T-box 3 (219682_s_at), score: 0.64
TFPItissue factor pathway inhibitor (lipoprotein-associated coagulation inhibitor) (209676_at), score: -0.7
TICAM2toll-like receptor adaptor molecule 2 (214658_at), score: -0.77
TMED7transmembrane emp24 protein transport domain containing 7 (209404_s_at), score: -0.79
TMEM123transmembrane protein 123 (211967_at), score: -0.7
TSKUtsukushin (218245_at), score: 0.65
TXLNAtaxilin alpha (212300_at), score: 0.81
VPS37Bvacuolar protein sorting 37 homolog B (S. cerevisiae) (221704_s_at), score: 0.77
WDR6WD repeat domain 6 (217734_s_at), score: 0.69
WDR62WD repeat domain 62 (215218_s_at), score: 0.67
XAB2XPA binding protein 2 (218110_at), score: 0.65
YTHDC2YTH domain containing 2 (213077_at), score: -0.71
ZNF536zinc finger protein 536 (206403_at), score: 0.76
Non-Entrez genes
Unknown, score:
HELP
Conditions in the module, given in the same order as on the expression
plot above. Red color means over-expression, green under-expression in
the given condition.
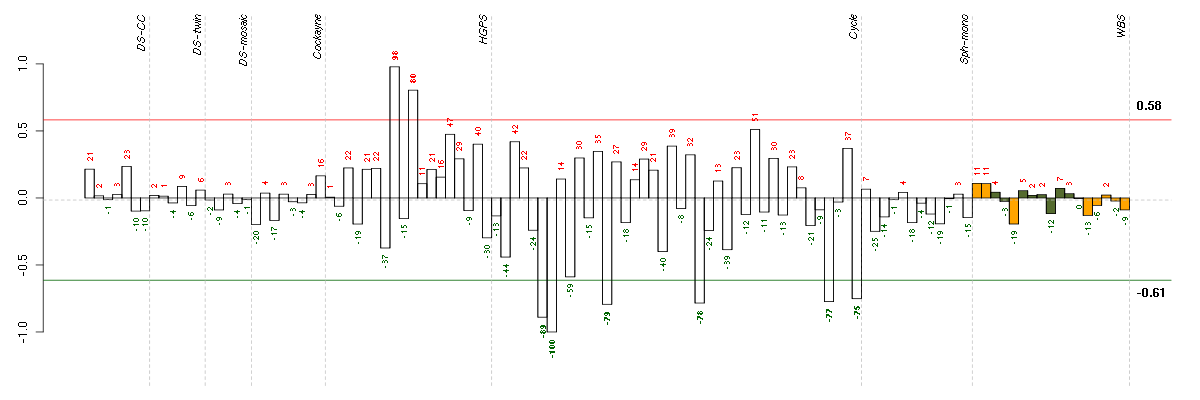
The barplot below shows the condition (sample) scores. A separate bar
is shown for each sample, its height is the corresponding score of the
sample in the module. The red and green numbers on the bars are the
sample scores expressed in percents, i.e. 100% is 1.0.
The red and green lines show the module thresholds, samples above
the red line and below the green line are included in the module.
The different experiments that were part of the study, are separated
by dashed vertical lines.
— Click on the Help button again to close this help window.
| Id | sample | Experiment | ExpName | Array | Syndrome | Cell.line |
| E-TABM-263-raw-cel-1515485771.cel | 7 | 6 | Cycle | hgu133a2 | none | Cycle 1 |
| E-TABM-263-raw-cel-1515485751.cel | 6 | 6 | Cycle | hgu133a2 | none | Cycle 1 |
| E-TABM-263-raw-cel-1515485891.cel | 13 | 6 | Cycle | hgu133a2 | none | Cycle 1 |
| E-TABM-263-raw-cel-1515486091.cel | 23 | 6 | Cycle | hgu133a2 | none | Cycle 1 |
| E-TABM-263-raw-cel-1515486371.cel | 37 | 6 | Cycle | hgu133a2 | none | Cycle 1 |
| E-TABM-263-raw-cel-1515486431.cel | 40 | 6 | Cycle | hgu133a2 | none | Cycle 1 |
| E-GEOD-3860-raw-cel-1561690344.cel | 10 | 5 | HGPS | hgu133a | none | GM00038C |
| E-GEOD-3860-raw-cel-1561690304.cel | 8 | 5 | HGPS | hgu133a | none | GMO8398C |


© 2008-2010 Computational Biology Group, Department of Medical Genetics,
University of Lausanne, Switzerland