Previous module |
Next module
Module #719, TG: 2.6, TC: 2, 129 probes, 129 Entrez genes, 3 conditions


HELP
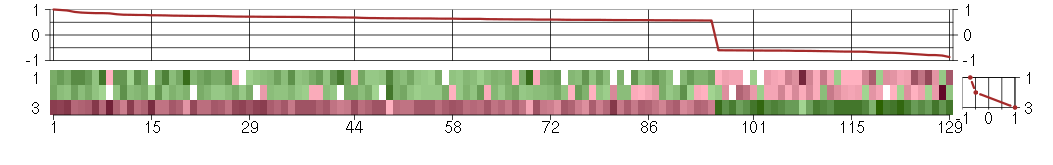
The image plot shows the color-coded level of gene expression, for the
genes and conditions in a given transcription module. The genes are on
the horizontal, the conditions on the vertical axis.
The genes are ordered according to their ISA gene scores, similarly
the conditions are ordered according to their condition scores. The
score of a gene means the «degree of inclusion» in
the module: a high score gene is essential in the module.
Condition scores can also be negative, that means that the genes of
the module are all down-regulated in the condition. Here the absolute
value of the score gives the «degree of inclusion».
The plots above and beside the expression matrix show the gene scores
and condition scores, respectively.
Note that the plot is interactive, you can see the name of the gene
and condition under the mouse cursor.
The expression matrix was normalized to have mean zero and standard
deviation one for every gene separately across all conditions
(i.e. not just for the conditions in the module).
— Click on the Help button again to close this help window.

Under-expression is coded with green,
over-expression with red color.
Help |
Hide |
Top
Help |
Show |
Top
The GO tree — Biological processes
HELP
This is one of three sections showing Gene Ontology enrichment of the
current module: in this case for biological processes.
The graph shows the hierarchy of the GO categories, their enrichment
for the current module is color coded, and the blue number beside the
category is the minus log ten p-value of the enrichment. (Calculated
using the standard hypergeometric test.) The color of the arrows code
«is a» (cyan) and «part of» relationships.
The tree was built the following way. First all GO terms with more
significant enrichment p-value than 0.05 were collected. Then all
paths from these terms to the root node of the GO tree were included
too. If a GO term is included more than once in the tree, then the
green numbers show 1) the id of the node, this makes it easier to find
other appereances of the term, and 2) the number of appearences.
Note that the same GO category might show up on the graph many
times. This is because the GO was «straightened» for this
graph, i.e. if there are more paths from a GO term to the root node of
the tree, all of them are included. The green numbers
Move the mouse cursor over the terms to get their definition. Clicking
on them takes you to the corresponding Gene Ontology web page.
If you cannot see a graph here at all, that means that there were no
significantly enriched GO categories, at the 0.05 level.
— Click on the Help button again to close this help window.

Help |
Hide |
Top
Help |
Show |
Top
The GO tree — Cellular Components
HELP
This is one of three sections showing Gene Ontology enrichment of the
current module: in this case for cellular components.
The graph shows the hierarchy of the GO categories, their enrichment
for the current module is color coded, and the blue number beside the
category is the minus log ten p-value of the enrichment. (Calculated
using the standard hypergeometric test.) The color of the arrows code
«is a» (cyan) and «part of» relationships.
The tree was built the following way. First all GO terms with more
significant enrichment p-value than 0.05 were collected. Then all
paths from these terms to the root node of the GO tree were included
too. If a GO term is included more than once in the tree, then the
green numbers show 1) the id of the node, this makes it easier to find
other appereances of the term, and 2) the number of appearences.
Note that the same GO category might show up on the graph many
times. This is because the GO was «straightened» for this
graph, i.e. if there are more paths from a GO term to the root node of
the tree, all of them are included. The green numbers
Move the mouse cursor over the terms to get their definition. Clicking
on them takes you to the corresponding Gene Ontology web page.
If you cannot see a graph here at all, that means that there were no
significantly enriched GO categories, at the 0.05 level.
— Click on the Help button again to close this help window.
membrane
Double layer of lipid molecules that encloses all cells, and, in eukaryotes, many organelles; may be a single or double lipid bilayer; also includes associated proteins.
cellular_component
The part of a cell or its extracellular environment in which a gene product is located. A gene product may be located in one or more parts of a cell and its location may be as specific as a particular macromolecular complex, that is, a stable, persistent association of macromolecules that function together.
cell
The basic structural and functional unit of all organisms. Includes the plasma membrane and any external encapsulating structures such as the cell wall and cell envelope.
intrinsic to membrane
Located in a membrane such that some covalently attached portion of the gene product, for example part of a peptide sequence or some other covalently attached moiety such as a GPI anchor, spans or is embedded in one or both leaflets of the membrane.
anchored to membrane
Tethered to a membrane by a covalently attached anchor, such as a lipid moiety, that is embedded in the membrane. When used to describe a protein, indicates that none of the peptide sequence is embedded in the membrane.
membrane part
Any constituent part of a membrane, a double layer of lipid molecules that encloses all cells, and, in eukaryotes, many organelles; may be a single or double lipid bilayer; also includes associated proteins.
cell part
Any constituent part of a cell, the basic structural and functional unit of all organisms.
all
This term is the most general term possible
cell part
Any constituent part of a cell, the basic structural and functional unit of all organisms.
membrane part
Any constituent part of a membrane, a double layer of lipid molecules that encloses all cells, and, in eukaryotes, many organelles; may be a single or double lipid bilayer; also includes associated proteins.
Help |
Hide |
Top
Help |
Show |
Top
The GO tree — Molecular Function
HELP
This is one of three sections showing Gene Ontology enrichment of the
current module: in this case for molecular function.
The graph shows the hierarchy of the GO categories, their enrichment
for the current module is color coded, and the blue number beside the
category is the minus log ten p-value of the enrichment. (Calculated
using the standard hypergeometric test.) The color of the arrows code
«is a» (cyan) and «part of» relationships.
The tree was built the following way. First all GO terms with more
significant enrichment p-value than 0.05 were collected. Then all
paths from these terms to the root node of the GO tree were included
too. If a GO term is included more than once in the tree, then the
green numbers show 1) the id of the node, this makes it easier to find
other appereances of the term, and 2) the number of appearences.
Note that the same GO category might show up on the graph many
times. This is because the GO was «straightened» for this
graph, i.e. if there are more paths from a GO term to the root node of
the tree, all of them are included. The green numbers
Move the mouse cursor over the terms to get their definition. Clicking
on them takes you to the corresponding Gene Ontology web page.
If you cannot see a graph here at all, that means that there were no
significantly enriched GO categories, at the 0.05 level.
— Click on the Help button again to close this help window.
Help |
Hide |
Top
Help |
Show |
Top
GO BP test for over-representation
HELP
List of all enriched GO categories (biological processes), at the 0.05
p-value level.
The columns:
- ExpCount is the expected count of genes in the
module annotated with the given GO term, just by chance.
- Count
is the number of genes in the module annotated with the given GO
term.
- Size is the total number of genes (in our universe)
annotated with the GO term.
Clicking on Count shows the genes that drive the
enrichment. You can also click on the individual numbers in
the Count column, to show the driving genes for that individual
GO category.
Clicking on the GO identifiers takes you to the Gene Ontology web
pages.
— Click on the Help button again to close this help window.
| Id | Pvalue | ExpCount | Count | Size | Term |
| GO:0042745 | 1.313e-02 | 0.02495 | 2
CHRNB2, NPAS2 | 2 | circadian sleep/wake cycle |
| GO:0048512 | 1.313e-02 | 0.02495 | 2
CHRNB2, NPAS2 | 2 | circadian behavior |
| GO:0006952 | 2.674e-02 | 3.28 | 11
ADA, CD24, CFI, CHST1, COLEC12, DDX58, KCNN4, LY75, MASP1, PLA2G7, SAA4 | 263 | defense response |
| GO:0007622 | 2.958e-02 | 0.03742 | 2
CHRNB2, NPAS2 | 3 | rhythmic behavior |
| GO:0033632 | 2.958e-02 | 0.03742 | 2
ADA, CD24 | 3 | regulation of cell-cell adhesion mediated by integrin |
| GO:0009611 | 3.418e-02 | 2.881 | 10
ADA, CD24, CFI, CHST1, LY75, MASP1, PLA2G7, PLSCR1, SAA4, TMPRSS6 | 231 | response to wounding |
| GO:0006954 | 3.601e-02 | 1.908 | 8
ADA, CD24, CFI, CHST1, LY75, MASP1, PLA2G7, SAA4 | 153 | inflammatory response |
| GO:0009605 | 3.657e-02 | 4.615 | 13
ACADS, ADA, CD24, CDKN2D, CFI, CHST1, IL16, LY75, MASP1, PLA2G7, PLSCR1, SAA4, TMPRSS6 | 370 | response to external stimulus |
| GO:0002902 | 4.694e-02 | 0.04989 | 2
ADA, CD24 | 4 | regulation of B cell apoptosis |
| GO:0030431 | 4.694e-02 | 0.04989 | 2
CHRNB2, NPAS2 | 4 | sleep |
| GO:0070228 | 4.694e-02 | 0.04989 | 2
ADA, CD24 | 4 | regulation of lymphocyte apoptosis |
Help |
Hide |
Top
Help |
Show |
Top
GO CC test for over-representation
HELP
List of all enriched GO categories (cellular components), at the 0.05
p-value level.
The columns:
- ExpCount is the expected count of genes in the
module annotated with the given GO term, just by chance.
- Count
is the number of genes in the module annotated with the given GO
term.
- Size is the total number of genes (in our universe)
annotated with the GO term.
Clicking on Count shows the genes that drive the
enrichment. You can also click on the individual numbers in
the Count column, to show the driving genes for that individual
GO category.
Clicking on the GO identifiers takes you to the Gene Ontology web
pages.
— Click on the Help button again to close this help window.
| Id | Pvalue | ExpCount | Count | Size | Term |
| GO:0031225 | 6.055e-04 | 0.5362 | 6
ART1, CD24, CEACAM5, CEACAM6, GFRA1, OPCML | 39 | anchored to membrane |
Help |
Hide |
Top
Help |
Show |
Top
GO MF test for over-representation
HELP
List of all enriched GO categories (molecular function), at the 0.05
p-value level.
The columns:
- ExpCount is the expected count of genes in the
module annotated with the given GO term, just by chance.
- Count
is the number of genes in the module annotated with the given GO
term.
- Size is the total number of genes (in our universe)
annotated with the GO term.
Clicking on Count shows the genes that drive the
enrichment. You can also click on the individual numbers in
the Count column, to show the driving genes for that individual
GO category.
Clicking on the GO identifiers takes you to the Gene Ontology web
pages.
— Click on the Help button again to close this help window.
| Id | Pvalue | ExpCount | Count | Size | Term |
| GO:0005044 | 3.177e-02 | 0.149 | 3
CFI, COLEC12, HPN | 12 | scavenger receptor activity |
Help |
Hide |
Top
Help |
Show |
Top
KEGG Pathway test for over-representation
HELP
List of all enriched KEGG pathways, at the 0.05
p-value level.
The columns:
- ExpCount is the expected count of genes in the
module annotated with the given KEGG pathway, just by chance.
- Count
is the number of genes in the module annotated with the given KEGG
pathway.
- Size is the total number of genes (in our universe)
annotated with the KEGG pathway.
Clicking on Count shows the genes that drive the
enrichment. You can also click on the individual numbers in
the Count column, to show the driving genes for that individual
KEGG pathway.
Clicking on the KEGG identifiers takes you to the KEGG web site.
— Click on the Help button again to close this help window.
Help |
Hide |
Top
Help |
Show |
Top
miRNA test for over-representation
HELP
List of all enriched miRNA families, at the 0.05
p-value level.
The columns:
- ExpCount is the expected count of genes in the
module regulated by the given miRNA family, just by chance.
- Count
is the number of genes in the module regulated by the given miRNA
family.
- Size is the total number of genes (in our universe)
regulated with the given miRNA family.
Clicking on Count shows the genes that drive the
enrichment. You can also click on the individual numbers in
the Count column, to show the driving genes for that individual
miRNA family.
The miRNA regulation data was taken from the TargetScan database.
(Only the conserved sites were used for the current analysis.)
Clicking on the miRNA names takes you to the TargetScan web site.
— Click on the Help button again to close this help window.
Help |
Hide |
Top
Help |
Show |
Top
Chromosome test for over-representation
HELP
List of all enriched Chromosomes, at the 0.05
p-value level.
The columns:
- ExpCount is the expected number of genes in the
module on the given chromosome, just by chance.
- Count
is the number of genes in the module on the given chromosome.
- Size is the total number of genes (in our universe)
on the given chromosome.
Clicking on Count shows the genes that drive the
enrichment. You can also click on the individual numbers in
the Count column, to show the driving genes for that individual
chromosome.
— Click on the Help button again to close this help window.
HELP
A list of all genes in the current module, in alphabetical order. The
size of the text corresponds to the gene scores.
Note that some gene symbols may show up more than once, if many
probes match the same Entrez gene.
Genes with no Entrez mapping are given separately, with their
Affymetrics probe ID.
— Click on the Help button again to close this help window.
Entrez genes
ABCG1ATP-binding cassette, sub-family G (WHITE), member 1 (204567_s_at), score: 0.7
ACADSacyl-Coenzyme A dehydrogenase, C-2 to C-3 short chain (202366_at), score: 0.61
ACOX3acyl-Coenzyme A oxidase 3, pristanoyl (204241_at), score: 0.59
ADAadenosine deaminase (204639_at), score: 0.59
ADCY2adenylate cyclase 2 (brain) (217687_at), score: 1
AGAP2ArfGAP with GTPase domain, ankyrin repeat and PH domain 2 (215080_s_at), score: 0.88
ALKBH4alkB, alkylation repair homolog 4 (E. coli) (222228_s_at), score: 0.65
ANKRD17ankyrin repeat domain 17 (212211_at), score: -0.61
ART1ADP-ribosyltransferase 1 (207919_at), score: 0.59
ASB1ankyrin repeat and SOCS box-containing 1 (212819_at), score: -0.63
ASPNasporin (219087_at), score: 0.62
ATG2AATG2 autophagy related 2 homolog A (S. cerevisiae) (213300_at), score: -0.65
BDH13-hydroxybutyrate dehydrogenase, type 1 (211715_s_at), score: 0.72
BIDBH3 interacting domain death agonist (204493_at), score: -0.6
BRCC3BRCA1/BRCA2-containing complex, subunit 3 (216521_s_at), score: 0.65
BRD1bromodomain containing 1 (204520_x_at), score: -0.71
C11orf30chromosome 11 open reading frame 30 (219012_s_at), score: 0.6
C20orf39chromosome 20 open reading frame 39 (219310_at), score: 0.85
CAMK1Gcalcium/calmodulin-dependent protein kinase IG (217128_s_at), score: 0.63
CCRN4LCCR4 carbon catabolite repression 4-like (S. cerevisiae) (220671_at), score: 0.6
CD24CD24 molecule (209771_x_at), score: 0.77
CDC37L1cell division cycle 37 homolog (S. cerevisiae)-like 1 (219343_at), score: -0.65
CDKN2Dcyclin-dependent kinase inhibitor 2D (p19, inhibits CDK4) (210240_s_at), score: 0.7
CEACAM5carcinoembryonic antigen-related cell adhesion molecule 5 (201884_at), score: 0.76
CEACAM6carcinoembryonic antigen-related cell adhesion molecule 6 (non-specific cross reacting antigen) (211657_at), score: 0.57
CFIcomplement factor I (203854_at), score: -0.81
CHRNB2cholinergic receptor, nicotinic, beta 2 (neuronal) (206635_at), score: 0.7
CHST1carbohydrate (keratan sulfate Gal-6) sulfotransferase 1 (205567_at), score: 0.81
COLEC12collectin sub-family member 12 (221019_s_at), score: -0.69
CST6cystatin E/M (206595_at), score: 0.66
CTSEcathepsin E (205927_s_at), score: 0.63
DDX58DEAD (Asp-Glu-Ala-Asp) box polypeptide 58 (218943_s_at), score: -0.6
DENND4BDENN/MADD domain containing 4B (202860_at), score: -0.69
DNAH3dynein, axonemal, heavy chain 3 (220725_x_at), score: 0.65
EPHA3EPH receptor A3 (206070_s_at), score: 0.71
EPHA4EPH receptor A4 (206114_at), score: 0.86
EPORerythropoietin receptor (215054_at), score: 0.66
FRAT2frequently rearranged in advanced T-cell lymphomas 2 (209864_at), score: -0.67
GABARAPL1GABA(A) receptor-associated protein like 1 (208868_s_at), score: 0.59
GABARAPL3GABA(A) receptors associated protein like 3 (pseudogene) (211458_s_at), score: 0.6
GFRA1GDNF family receptor alpha 1 (205696_s_at), score: 0.7
GNAZguanine nucleotide binding protein (G protein), alpha z polypeptide (204993_at), score: 0.58
GPATCH4G patch domain containing 4 (220596_at), score: 0.57
GPR63G protein-coupled receptor 63 (220993_s_at), score: 0.71
GTPBP3GTP binding protein 3 (mitochondrial) (213835_x_at), score: 0.58
HECW1HECT, C2 and WW domain containing E3 ubiquitin protein ligase 1 (215584_at), score: 0.6
HHIPL2HHIP-like 2 (220283_at), score: 0.75
HIP1Rhuntingtin interacting protein 1 related (209558_s_at), score: 0.98
HLA-DMBmajor histocompatibility complex, class II, DM beta (203932_at), score: 0.79
HOXA5homeobox A5 (213844_at), score: -0.77
HPNhepsin (204934_s_at), score: 0.62
IL16interleukin 16 (lymphocyte chemoattractant factor) (209827_s_at), score: 0.63
IRF1interferon regulatory factor 1 (202531_at), score: -0.6
IRF2interferon regulatory factor 2 (203275_at), score: -0.79
JMJD2Ajumonji domain containing 2A (203204_s_at), score: 0.74
KCNN4potassium intermediate/small conductance calcium-activated channel, subfamily N, member 4 (204401_at), score: 0.58
KRT33Akeratin 33A (208483_x_at), score: 0.72
LHPPphospholysine phosphohistidine inorganic pyrophosphate phosphatase (218523_at), score: 0.62
LOC100129500hypothetical protein LOC100129500 (212884_x_at), score: 0.58
LOC128192similar to peptidyl-Pro cis trans isomerase (217346_at), score: 0.64
LOC93432maltase-glucoamylase-like pseudogene (216666_at), score: 0.64
LPCAT3lysophosphatidylcholine acyltransferase 3 (202793_at), score: 0.59
LRIG1leucine-rich repeats and immunoglobulin-like domains 1 (211596_s_at), score: -0.65
LY75lymphocyte antigen 75 (205668_at), score: -0.75
MAFv-maf musculoaponeurotic fibrosarcoma oncogene homolog (avian) (209348_s_at), score: 0.75
MAGI1membrane associated guanylate kinase, WW and PDZ domain containing 1 (206144_at), score: -0.62
MAPK10mitogen-activated protein kinase 10 (204813_at), score: 0.59
MAPK8IP3mitogen-activated protein kinase 8 interacting protein 3 (213178_s_at), score: -0.61
MASP1mannan-binding lectin serine peptidase 1 (C4/C2 activating component of Ra-reactive factor) (213749_at), score: 0.57
MAST4microtubule associated serine/threonine kinase family member 4 (40016_g_at), score: -0.62
MED22mediator complex subunit 22 (206593_s_at), score: -0.7
MEGF6multiple EGF-like-domains 6 (213942_at), score: 0.64
MPP2membrane protein, palmitoylated 2 (MAGUK p55 subfamily member 2) (213270_at), score: 0.65
MUC13mucin 13, cell surface associated (218687_s_at), score: 0.77
MYO5Bmyosin VB (202002_at), score: 0.57
NCRNA00092non-protein coding RNA 92 (215861_at), score: 0.69
NPAS2neuronal PAS domain protein 2 (39549_at), score: -0.73
NTRK3neurotrophic tyrosine kinase, receptor, type 3 (217033_x_at), score: 0.58
NUDT13nudix (nucleoside diphosphate linked moiety X)-type motif 13 (214136_at), score: 0.76
OPCMLopioid binding protein/cell adhesion molecule-like (214111_at), score: 0.6
PBXIP1pre-B-cell leukemia homeobox interacting protein 1 (214176_s_at), score: 0.63
PDE5Aphosphodiesterase 5A, cGMP-specific (206757_at), score: 0.59
PGS1phosphatidylglycerophosphate synthase 1 (219394_at), score: -0.65
PLA2G7phospholipase A2, group VII (platelet-activating factor acetylhydrolase, plasma) (206214_at), score: 0.75
PLAC8placenta-specific 8 (219014_at), score: 0.96
PLSCR1phospholipid scramblase 1 (202446_s_at), score: -0.61
PODNL1podocan-like 1 (220411_x_at), score: 0.71
PRAMEF11PRAME family member 11 (217365_at), score: 0.71
PRKCHprotein kinase C, eta (218764_at), score: 0.57
PTCD2pentatricopeptide repeat domain 2 (219658_at), score: -0.66
QPRTquinolinate phosphoribosyltransferase (204044_at), score: 0.73
RCAN2regulator of calcineurin 2 (203498_at), score: -0.61
RHBDD3rhomboid domain containing 3 (204402_at), score: 0.69
RIMS2regulating synaptic membrane exocytosis 2 (215478_at), score: 0.77
RMND1required for meiotic nuclear division 1 homolog (S. cerevisiae) (220329_s_at), score: -0.63
SAA4serum amyloid A4, constitutive (207096_at), score: 0.57
SCD5stearoyl-CoA desaturase 5 (220232_at), score: 0.72
SEPT5septin 5 (209767_s_at), score: 0.69
SERF1Bsmall EDRK-rich factor 1B (centromeric) (219982_s_at), score: 0.75
SH3D19SH3 domain containing 19 (211620_x_at), score: 0.66
SH3GL3SH3-domain GRB2-like 3 (211565_at), score: 0.71
SHPKsedoheptulokinase (219713_at), score: 0.61
SMA4glucuronidase, beta pseudogene (215599_at), score: -0.79
SPAG8sperm associated antigen 8 (206816_s_at), score: 0.79
STARD8StAR-related lipid transfer (START) domain containing 8 (206868_at), score: 0.65
SVILsupervillin (202565_s_at), score: -0.61
TBX10T-box 10 (207689_at), score: 0.73
TCP10t-complex 10 homolog (mouse) (207503_at), score: 0.87
THG1LtRNA-histidine guanylyltransferase 1-like (S. cerevisiae) (219122_s_at), score: 0.58
THSD1thrombospondin, type I, domain containing 1 (219477_s_at), score: 0.71
TLE3transducin-like enhancer of split 3 (E(sp1) homolog, Drosophila) (206472_s_at), score: -0.62
TMCC2transmembrane and coiled-coil domain family 2 (213096_at), score: 0.91
TMEM110transmembrane protein 110 (213851_at), score: 0.58
TMEM30Btransmembrane protein 30B (213285_at), score: -0.64
TMPRSS6transmembrane protease, serine 6 (214955_at), score: 0.67
TNFRSF8tumor necrosis factor receptor superfamily, member 8 (206729_at), score: 0.86
TRIM45tripartite motif-containing 45 (219923_at), score: 0.79
TSPYL2TSPY-like 2 (218012_at), score: -0.61
UAP1L1UDP-N-acteylglucosamine pyrophosphorylase 1-like 1 (214755_at), score: 0.65
UNC5Bunc-5 homolog B (C. elegans) (213100_at), score: 0.62
UTXubiquitously transcribed tetratricopeptide repeat, X chromosome (203992_s_at), score: -0.6
VAV3vav 3 guanine nucleotide exchange factor (218807_at), score: 0.72
WDTC1WD and tetratricopeptide repeats 1 (215497_s_at), score: 0.59
ZNF117zinc finger protein 117 (207605_x_at), score: 0.8
ZNF510zinc finger protein 510 (206053_at), score: -0.87
ZNF552zinc finger protein 552 (219741_x_at), score: 0.67
ZNF702Pzinc finger protein 702 pseudogene (206557_at), score: 0.61
ZNF814zinc finger protein 814 (60794_f_at), score: -0.61
ZNF816Azinc finger protein 816A (217541_x_at), score: 0.7
Non-Entrez genes
Unknown, score:
HELP
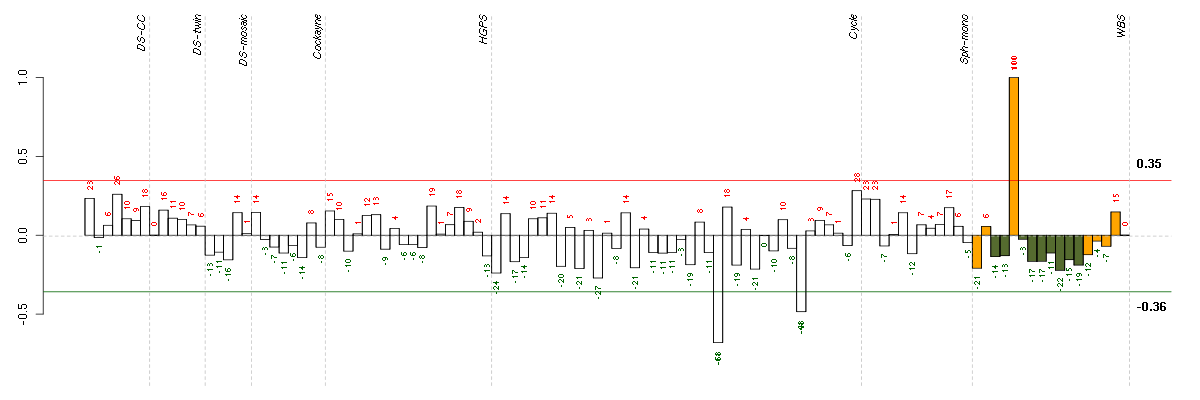
Conditions in the module, given in the same order as on the expression
plot above. Red color means over-expression, green under-expression in
the given condition.
The barplot below shows the condition (sample) scores. A separate bar
is shown for each sample, its height is the corresponding score of the
sample in the module. The red and green numbers on the bars are the
sample scores expressed in percents, i.e. 100% is 1.0.
The red and green lines show the module thresholds, samples above
the red line and below the green line are included in the module.
The different experiments that were part of the study, are separated
by dashed vertical lines.
— Click on the Help button again to close this help window.
| Id | sample | Experiment | ExpName | Array | Syndrome | Cell.line |
| E-TABM-263-raw-cel-1515486131.cel | 25 | 6 | Cycle | hgu133a2 | none | Cycle 1 |
| E-TABM-263-raw-cel-1515486311.cel | 34 | 6 | Cycle | hgu133a2 | none | Cycle 1 |
| 4319_WBS.CEL | 5 | 8 | WBS | hgu133plus2 | WBS | WBS 1 |


© 2008-2010 Computational Biology Group, Department of Medical Genetics,
University of Lausanne, Switzerland